Abstract
Background
The regulation of lipid biosynthesis is essential in photosynthetic eukaryotic cells. This regulation occurs during the direct synthesis of fatty acids and triacylglycerols (TAGs), as well as during other controlling processes in the main carbon metabolic pathway.
Results
In this study, the mRNA levels of Chlamydomonas citrate synthase (CrCIS) were found to decrease under nitrogen-limited conditions, which suggests suppressed gene expression. Gene silencing by RNA interference (RNAi) was conducted to determine whether CrCIS suppression affected the carbon flux in TAG biosynthesis. Results showed that the TAG level increased by 169.5%, whereas the CrCIS activities in the corresponding transgenic algae decreased by 16.7% to 37.7%. Moreover, the decrease in CrCIS expression led to the increased expression of TAG biosynthesis-related genes, such as acyl-CoA:diacylglycerol acyltransferase and phosphatidate phosphatase. Conversely, overexpression of CrCIS gene decreased the TAG level by 45% but increased CrCIS activity by 209% to 266% in transgenic algae.
Conclusions
The regulation of CrCIS gene can indirectly control the lipid content of algal cells. Our findings propose that increasing oil by suppressing CrCIS expression in microalgae is feasible.
Keywords: Citrate synthase, Triacylglycerol biosynthesis, RNAi interference, Overexpression, Chlamydomonas reinhardtii, Nitrogen deprivation
Background
Considering that fossil fuel resources are limited, the importance of conserving energy and saving the environment is gaining increased interest. Microalgae biodiesel, a crucial renewable biomass energy that uses solar energy to fix CO2 into biomass, is the most promising alternative to fossil fuels. However, studies on lipid metabolism in eukaryotic, single-celled, photosynthetic microalgae are limited compared with those on oil crops. Basic knowledge on microalgae is less than that of crops, such as rice, wheat, and corn. With the intensification of microalgae-derived biodiesel research at the global scale, more researchers are focusing on the mechanism underlying the formation of high lipid production and high cell-density cultures. These processes are crucial in genetic strain improvement, as well as in the future cultivation of commercial and industrial microalgae.
The substrate competition hypothesis was proposed by Sugimoto et al. and Chen et al. [1-3]. According to this hypothesis, the lipids and proteins of seeds compete for the same substrate, i.e., pyruvate, which is a product of glycolysis. Phosphoenolpyruvate carboxylase (PEPC; EC4.1.1.31) catalyzes the formation of oxaloacetate (OAA) from phosphoenolpyruvate (PEP), and then enters the tricarboxylic (TCA) cycle to provide the substrate and energy needed for protein synthesis. Meanwhile, acetyl–CoA carboxylase (ACCase) catalyzes the formation of acetyl coenzyme A from pyruvate, and then enters the fatty acid synthesis pathway. Hence, photosynthetic carbon flux tends to synthesize proteins or lipids depending on the relative activity of PEPC and ACCase. Using antisense RNA technology to suppress PEPC activity, they obtained stable, high-oil rape seed lines and high-oil soybean lines whose lipid contents increased by 6.4% to 18%. Citrate synthase (CIS; E.C. 2.3.3.1) is common within various organisms. CIS isozymes exhibit diverse subcellular localization patterns, and are involved in crucial physiological metabolic pathways. CIS, which is located in the mitochondria, is a rate-limiting enzyme during the first step of the TCA cycle. Through this step, CIS forms citroyl–CoA by catalyzing the reaction of acetyl–CoA. Currently, biological, functional, and applied research regarding CIS in plants mainly focus on the following aspects. First, crops are stimulated to secrete citric acids through CIS gene overexpression, which can activate hard-soluble P in soil to increase soil phosphorus utilization. In this context, Tong et al. cloned a CIS gene from rape and detected the gene expression under stressful conditions [4]. Correspondingly, Hu et al. bred a low-phosphorus resistant stain by overexpressing CIS gene into rice; the rice exhibited rapid root growth and high secretion of citric acid [5]. Second, CIS may increase cell resistance to aluminum toxicity. Citric acid forms a complex with Al3+. This complex exhibits either low toxicity or non-toxicity. The overexpression of CIS in alfalfa evidently strengthens the tolerance of the plant to acidic soil and aluminum toxicity [6]. Third, CIS expression is related to organic acid accumulation during fruit ripening [7]. Under this aspect, Zhang et al. provided evidence that the citric acid content of pineapple fruit is positively correlated with CIS activity during pineapple maturation [8]. Studies on CIS in microalgae are rarely reported compared with those in vascular plants and animals. As early as the 1970s, Barrie et al. published a study on CIS in microalgae. They detected CIS activity in four kinds of Cyanophyta, whose activity is inhibited by factors such as α-ketoglutaric acid, nicotinamide adenine dinucleotide phosphate, and ATP; this inhibition is speculated to lead fixed carbon flux to lipid synthesis [9].
We have confirmed that existing studies have not demonstrated any evidence that CIS gene expression and regulation are related to cellular lipid accumulation. Accordingly, this study aimed to determine whether such relationship exists. The mRNA abundances of CrCIS and lipid accumulation were detected under plus/minus nitrogen conditions in Chlamydomonas reinhardtii CC124. Knockdown by RNAi and overexpression of CrCIS gene were then performed in Chlamydomonas to determine the effect of overexpression or inhibition of CrCIS on cellular carbon flux and lipid accumulation. Furthermore, the results of this study can contribute in establishing the relationship of lipid accumulation with carbon flux distribution.
Results
Cloning of CrCIS gene and bioinformatics analysis
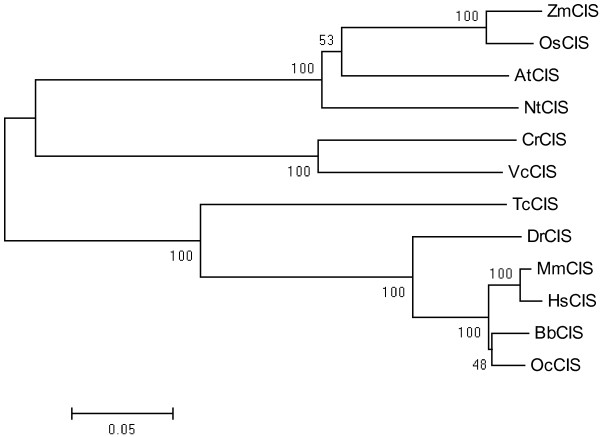
An approximately 1500 bp DNA fragment of CrCIS gene full-length CDS was amplified, cloned, and sequenced, exhibiting 100% homology with Chlamydomonas CIS gene (Protein ID194915). Using the BLAST programs and the Chlamydomonas CIS gene as entries, we obtained the CrCIS orthologous genes from the NCBI database. The amino acid sequence alignment of the CIS orthologous genes was created using ClustalW (http://www.genome.jp/tools/clustalw/). The phylogenetic tree of the CIS orthologous genes is presented in Figure 1. All listed CIS orthologous genes contained the citrate synthase function domain. The predicted subcellular location of CrCIS (by Euk-mPLoc 2.0) was within the mitochondrion (http://www.csbio.sjtu.edu.cn/bioinf/euk-multi-2/).
Figure 1.
Clustering analysis of citrate synthase orthologous genes in C. reinhardtii and other species. AtCIS: Arabidopsis thaliana citrate synthase(AAM62868); BbCIS: Bubalus bubalis citrate synthase (AEO51018); DrCIS: Danio rerio citrate synthase (NP_955892); TcCIS :Tribolium castaneum citrate synthase (XP_970124); HsCIS:Homo sapiens citrate synthase (BAG58964); MmCIS: Mus musculus citrate synthase (NP_080720); NtCIS: Nicotiana tabacum citrate synthase (CAA59008); OcCIS: Oryctolagus cuniculus citrate synthase (XP_002711121); OsCIS: Oryza sativa citrate synthase (NP_001068031); VcCIS:Volvox carteri citrate synthase (XP_002948056.1); ZmCIS: Zea mays citrate synthase (NP_001132846).
mRNA level of CrCIS under N sufficient and N limited conditions
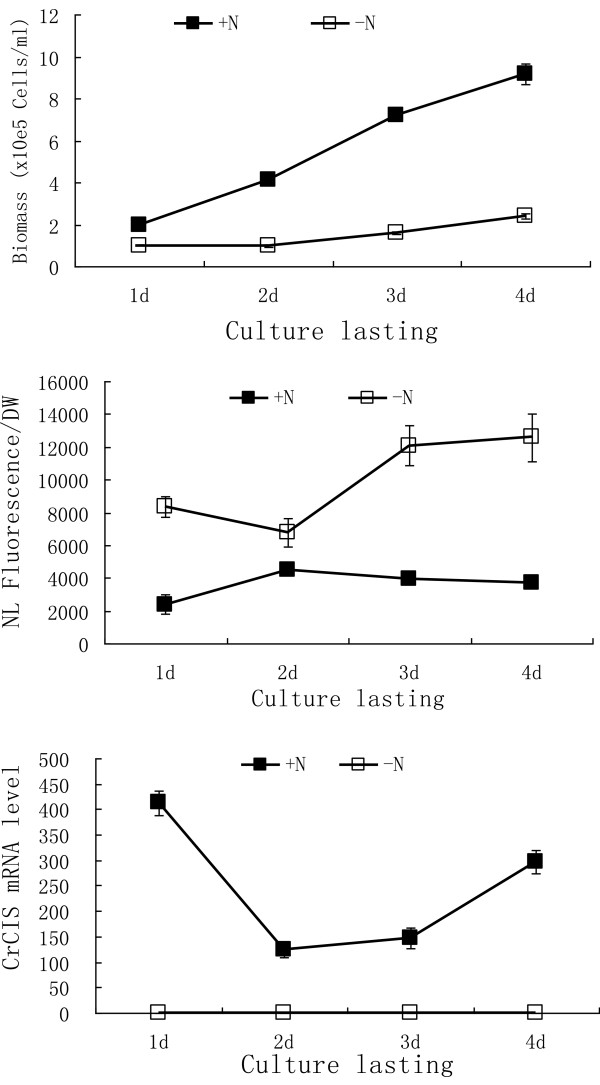
To determine the mRNA levels of the CrCIS under N-sufficient and N-limited conditions, 50 mL of cultivated Chlamydomonas (2 × 10⁶ cells/mL) was collected through centrifugation. After washing with HSM-N medium, the cells were suspended and half of them were transferred to a new 50 mL of HSM and HSM-N medium for further cultivation. Algal cells harvested at 24, 48, 72, or 96 h were used for RNA extraction. We quantitatively determined the expression of CrCIS gene in these samples through reverse transcription followed by real-time polymerase chain reaction (PCR). Results presented in Figure 2 exhibit the difference in lipid accumulation of cells in the two conditions; cells accumulated three to six times more lipids under the N-limited condition than under the N-sufficient condition. Interestingly, CrCIS mRNA was undetectable under the N-limited condition. Thus, we further determined whether the decline in the mRNA of CrCIS levels influenced the increase in lipid accumulation.
Figure 2.
The mRNA abundance of CrCIS gene and corresponding biomass and lipid content of the cells in HSM and HSM-N media. The mRNA levels were analyzed through RT-PCR of C. reinhardtii CC425 samples grown in the indicated media for 1, 2, 3, or 4 d. +N: cells cultivated in N sufficient HSM medium; -N: cells cultivated in N free HSM medium.
Silencing of CrCIS gene increases triacylglycerol (TAG) content in C. reinhardtii
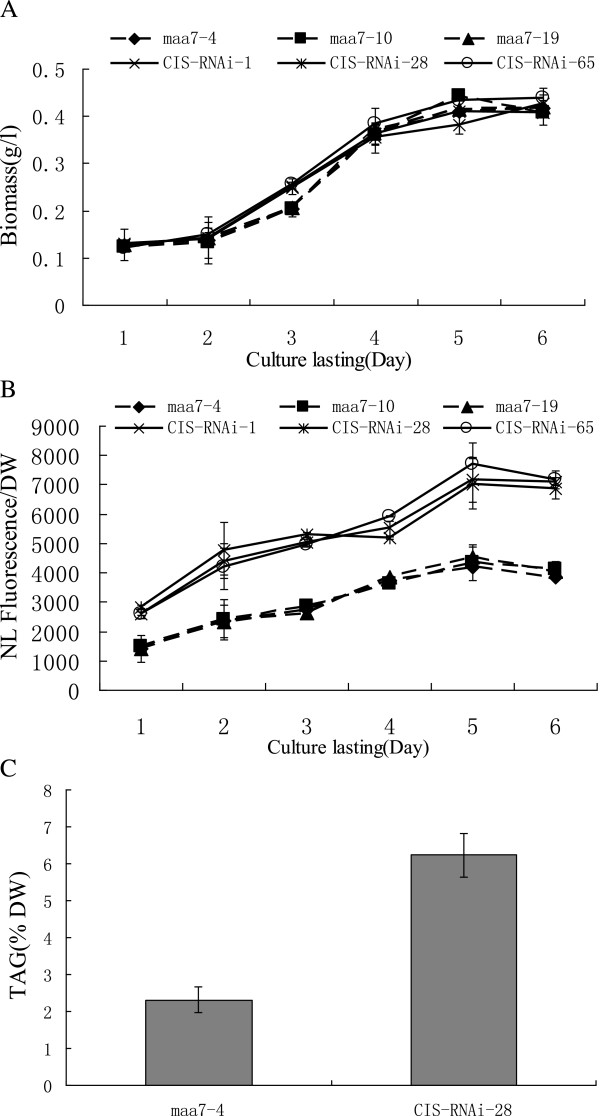
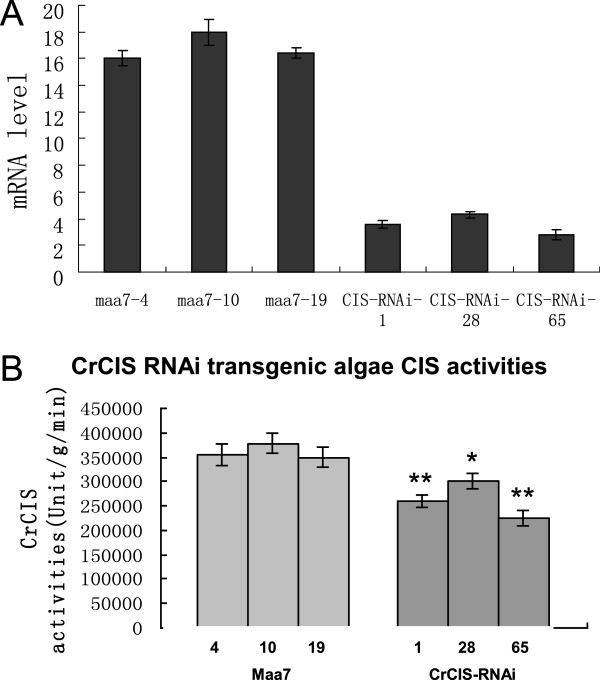
To determine the relationship between CrCIS expression and lipid accumulation, we examined the effects of the artificial silencing of CrCIS gene on the lipid content of C. reinhardtii. Based on the CrCIS (194915) sequences of the gene retrieved from the JGI C. reinhardtii v4.0 database, we designed primers (Additional file 1: Table S1) to amplify the fragment of the coding region of CrCIS. The DNA fragments were subcloned and then used to generate CrCIS RNAi constructs pMaa7IR/CrCIS IR. More than 120 positive transformants were obtained after transforming the silencing construct into C. reinhardtii CC425. Three transgenic algae were selected to measure the lipid content and mRNA levels of the targeted gene. Strains transformed with the vector pMaa7IR/XIR were used as controls. In cells harboring the CrCIS construct, analysis of the transgenic lines through the Nile red fluorescence method indicated the increase of the lipid content by 75.0% to 92.6% (Figure 3B) after six days of cultivation. The TAG level of the transgenic strain CIS-RNAi-28 increased by 169.5% compared with the control (Figure 3C). To evaluate the effectiveness of the RNAi construct, the abundance of target gene-specific mRNA through real-time PCR in transgenic algae was analyzed. The CrCIS mRNA abundance decreased by 72.8% to 81.0% (Figure 4A), indicating high-efficiency silencing by these constructs.
Figure 3.
The biomass and lipid content detected through Nile Red staining method and TAG level in CrCIS RNAi transgenic C. reinhardtii. A) The growth curve of CrCIS RNAi transgenic algae. B) The lipid content detected Nile Red staining method of CrCIS RNAi transgenic algae. C) TAG level detected by GC/MS after the strains cultivated for six days. Maa7-4(10,19): pMaa7IR/XIR transgenic algae strains; CIS-RNAi-1(28,65): pMaa7IR/CrCISIR transgenic algae strains.
Figure 4.
Comparison of the mRNA abundance and enzyme activity of CrCIS in transgenic C. reinhardtii. (A) The mRNA abundance of CrCIS in transgenic C. reinhardtii; (B) CIS activity in CrCIS RNAi transgenic C. reinhardtii.Maa7-4(10,19), pMaa7IR/XIR transgenic algae strains; CIS-RNAi-1(28,65), pMaa7IR/CrCISIR transgenic algae strains. Statistical analysis was performed using SPSS statistical software. Significance is indicated as *P < 0.05, **P < 0.01.
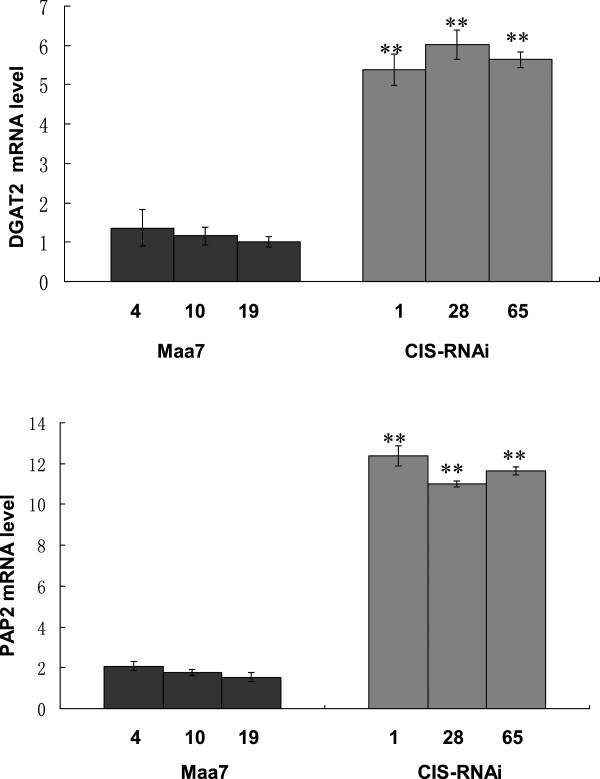
The enzyme activities of CrCIS of transgenic strains were tested. Compared with that of the wild strains, the CrCIS activity of CrCIS RNAi transgenic strains decreased by 16.7% to 37.7% (Figure 4B). Subsequently, the mRNA levels of DGAT2 (acyl-CoA:diacylglycerol acyltransferase) (Deng et al. [10]) and PAP2 (phosphatidate phosphatase) genes are directly related to lipid synthesis, and were measured in CrCIS RNAi transgenic strains. This result showed that the mRNA levels of DGAT2 and PAP2 genes increased in both transgenic strains (Figure 5). These outcomes indicated the decrease in enzyme activities caused by the silencing of CrCIS gene, thereby slowing down cellular TCA. The silencing of the CrCIS gene indirectly partitioned photosynthetic carbon into fatty acid and lipid synthesis by increasing DGAT2 and PAP2 gene expression.
Figure 5.
The mRNA abundance of DGAT2 and PAP2 gene in CrCIS RNAi transgenic algae strains. Maa7-4(10,19): pMaa7IR/XIR transgenic algae strains; CIS-RNAi-1(28,65): pMaa7IR/CrCISIR transgenic algae strains. Statistical analysis was performed using SPSS statistical software. Significance is indicated as *P < 0.05, **P < 0.01.
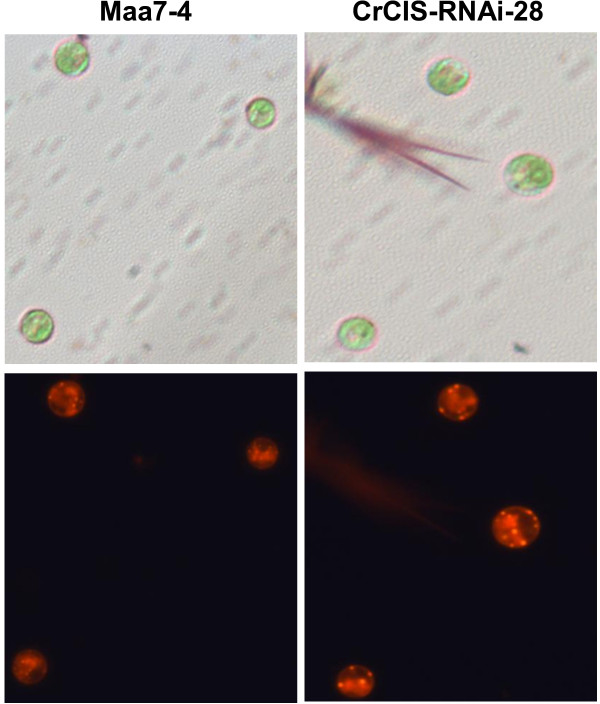
Similar results were obtained in Nile Red staining. More oil droplets were found in CrCIS RNAi transgenic algae compared with those in pMaa7IR/XIR transgenic algae as determined by microscopic analysis (Figure 6) and counting the number of oil droplets of transgenic strains (Additional file 1: Table S3). These data indicated the increase in cell lipid content through the regulation of CrCIS gene expression despite different metabolic pathways.
Figure 6.
Microscopic observations of CrCIS RNAi transgenic C. reinhardtii. After 4 days of cultivation in HSM medium, more oil droplets of CrCIS RNAi transgenic algae had been found. Maa7-4, pMaa7IR/XIR transgenic algae strain number 4; CIS-RNAi-28, pMaa7IR/CrCISIR transgenic algae strain number 28.
Overexpression of CrCIS reduced the lipid content of C. reinhardtii
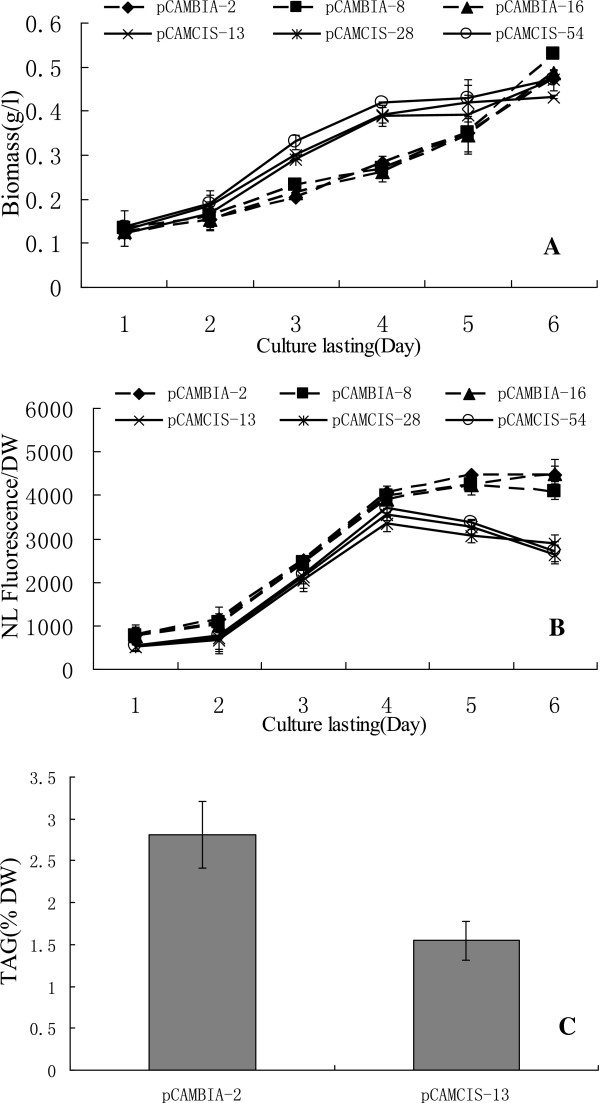
The increase in lipid content caused by RNAi silencing of CrCIS suggested the effect of the expression of these genes on the biosynthesis of triglycerides in C. reinhardtii. Thus, we determined whether CrCIS overexpression can reduce the lipid content of C. reinhardtii. Vector pCAMCIS, which expressed CrCIS gene from the CAMV 35S promoter, was introduced into C. reinhardtii. The lipid contents and growth rate of three randomly selected transgenic algae were detected in each transgenic algae line. Overexpression of CrCIS gene increased growth rate in the early stages from day two to day five. Moreover, overexpression of CrCIS decreased the lipid content compared with that of the control pCAMBIA1302 transgenic algae lines. For example, after six days of growth in HSM medium, the lipid contents of CrCIS overexpressing transgenic lines determined by the Nile Red fluorescence method decreased by 33.8% to 39.5% (Figure 7B). The TAG level of the transgenic strain pCAMCIS-13 decreased by 45% compared with the control (Figure 7C). Compared with pCAMBIA1302 transgenic stains, the mRNA levels of CrCIS increased by 1003% to 1419%, whereas the enzyme activities of CrCIS increased by 209% to 266% (Figure 8). In summary, the overexpression of CrCIS gene encodes a key enzyme in the TCA cycle and causes photosynthetic carbon flux without fatty acid synthesis, thereby decreasing lipid synthesis in cells. The enhancement of CrCIS activity accelerated TCA and increased ATP synthesis, as demonstrated in the increased early growth rates of transgenic algae strains. Decreased lipid content was also observed using Nile red dye staining (Figure 9) and oil droplet counting (Additional file 1: Table S3). Fewer oil droplets were found in CrCIS overexpression transgenic algae than in the control.
Figure 7.
The biomass and lipid content detected through Nile Red staining method and TAG level of over-expression of CrCIS in transgenic algae in HSM medium. A) The growth curve of CrCIS transgenic algae. B) The lipid content detected through Nile Red staining method of CrCIS transgenic algae. C) TAG level detected through GC/MS after the strains cultivated for 6 days. pCAMBIA-2(8,16): pMCAMBIA1302 transgenic algae strains; pCAMCIS-13(28,54): pCAMCIS transgenic algae strains.
Figure 8.

Comparison of the mRNA abundance and enzyme activity of CrCIS in transgenic C. reinhardtii. A) The mRNA abundance of CrCIS transgenic algae; B) The CIS enzyme activity of CrCIS transgenic algae. pCAMBIA-2(8,16): pMCAMBIA1302 transgenic algae strains; pCAMCIS-13(28,54): pCAMCIS transgenic algae strains. Statistical analysis was performed using SPSS statistical software. Significance is indicated as *P < 0.05, **P < 0.01.
Figure 9.
Lipid content in transgenic algae line detected through Nile red staining method. After 4 days cultivation in HSM medium, less oil droplets of CrCIS transgenic algae had been found. pCAMBIA-2: pMCAMBIA1302 transgenic algae strain number 2; pCAMCIS-13: pCAMCIS transgenic algae strain number 13.
Expression of CrCIS in E. coli BL21 and detection of in vitro enzyme activities
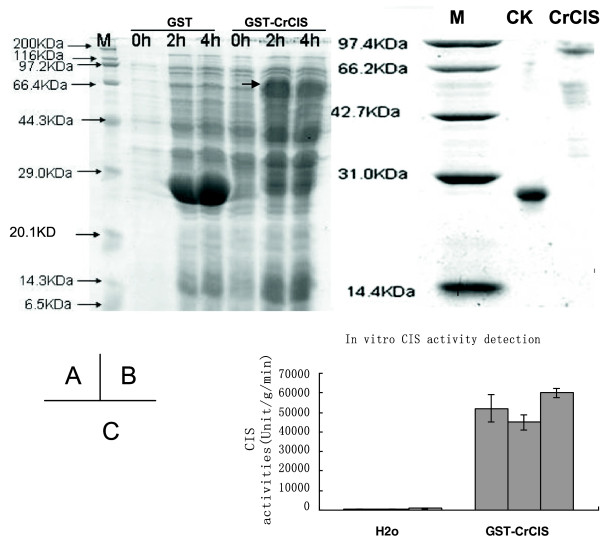
Plasmids of pGEX-6p-1-CIS were constructed to express CrCIS in E. coli and verify enzyme activities. The recombinant vector was transformed into E. coli BL21 strain. Transformants were grown in LB medium and induced with 1 mM of isopropylthiogalactoside. The supernatant fraction of the denatured cells was loaded onto a 15% SDS-PAGE gel. A GST-CrCIS protein band of 75 kD was observed (Figure 10A). The fusion protein was purified with columns followed by enzyme activity assay (Figure 10B). Compared with the control, the enzyme activity of CIS increased 56-fold to 100-fold (Figure 10C). These behaviors indicated that the cloned gene of CrCIS exhibited biological activities.
Figure 10.
Expressions of CrCIS gene in E. coli BL21 and enzyme activity detected in vitro. After induced by IPTG and cultivated in 0, 2, 4, and 6 hours, total protein had been harvested and run through SDS-PAGE. A) Expression of CrCIS in E. coli BL21; B) Purified GST-CrCIS; C) Enzyme activity of GST-CrCIS detected in vitro.
Discussion
Metabolic networks of photosynthetic eukaryotic organisms are complicated by the interplay of synthesis and degradation of carbohydrates, proteins, and lipids. Hence, the regulation of a main carbon metabolic pathway can affect other metabolic pathways. To increase lipid production, the synthesis of fatty acids of the substrates through a substitute method of metabolic pathway regulation should be improved. Studies on the relationships between carbon flux and lipid accumulation have focused on Arabidopsis thaliana and oil crops. Thus far, the genes involved were ACCase [11], sn-glycerol-3-phosphate dehydrogenase [12], pyruvate dehydrogenase kinase [13,14], pyuvate kinase complex [15,16], and d-glucose-6-phosphate dehydrogenase [17]. Ratcliffe and Shachar-Hill labeled carbon flux with isotope in rape seed development. They identified sugar cane and glucose as the main source of carbon flux during rape seed development [18]. This process produced TP, PAG, and PEP. The photosynthetic carbon flux was divided into four parts: 6.1% was used to synthesize OAA through PEP catalyzed by PEPC in the glycolytic pathway; 23.8% entered the TCA pathway through Pyr and Ac–CoA produced from PEP; 23.8% was used to synthesize amino acids through the intermediate products TP, PAG, and PEP; and the remaining 46.3% was used for lipid production through Ac–COA. Therefore, carbon efficiently flowed into lipid synthesis through directly or indirectly inhibiting PEPC activity, TCA pathway, and protein synthesis. Fan et al. identified starch as that the main storage sink for Chlamydomonas rather than oil. Even under N starvation conditions, the carbon flux derived from acetate has two destinations, namely, starch and oil. Significant increase in oil accumulation was caused by the blocking of starch biosynthesis in the starchless mutant BAFJ5. Thus, carbon supply was the limiting factor in TAG biosynthesis by Chlamydomonas[19]. In our study, the effective blocking of CrCIS activity through the RNA interference method increased lipid accumulation, whereas increased CrCIS activity in transgenic algal cells decreased lipid accumulation. CIS is one of the key enzymes involved in cell metabolism. This enzyme catalyzes acetyl–CoA and OAA to form citrate, the first reaction of TCA in mitochondria. This reaction uses most of the carbon flux. Modulating CIS activity is the most important step affecting carbon flux distribution in TCA. The activity of CIS determines the speed of TCA and the concentrations of PEP and pyruvic acid. Both PEP and pyruvic acid can enter the plastid and then transform into acetyl–CoA and propionyl–CoA, respectively. Acetyl–CoA and propionyl–CoA are substrates for fatty acid synthesis. In this study, CrCIS gene silencing increased TAG production by 169.5% in algal cells. CrCIS activity decreased by 16.7% to 37% in transgenic strains compared with that of the control. The mRNA levels of DGAT2 and PAP2 directly related to lipid biosynthesis significantly increased. This result proposed that carbon flux in lipid synthesis was altered in transgenic strains. Application of the same method in rape development is unsuitable, as determined by Tong et al. [4]. Antisense gene silencing in CIS was introduced to rape, decreasing the mRNA level of CIS but not its lipid production. The results obtained were contradictory with the expected low lipid production of seeds and leaves, as well as with the corresponding phenotypes such as dwarf, small lamina, and shortened pod. The association of this phenotype with the complexity of multicellular organisms was speculated because the CIS gene can function in rape development. The knockdown of CIS can affect the expression of genes related to cell differentiation and development. Nevertheless, our results showed that in unicellular photosynthetic eukaryote Chlamydomonas, CrCIS gene silencing did not slow down cell proliferation (Figure 3).
We observed that CrCIS gene silencing resulted in the artificial blockage of TCA pathways, which caused photosynthetic carbon flux to mainly enter the oil accumulation in C. reinhardtii. This observation is consistent with the hypothesis that carbon supply is the limiting factor in TAG synthesis by Chlamydomonas[19]. Further studies are required to elucidate the mechanisms underlying the exact signals triggering the switches. Our findings suggested that increasing oil by suppressing CrCIS expression in microalgae was feasible. Furthermore, the success of inducing oil accumulation by CrCIS silencing validated the usefulness and effectiveness of biotechnology methods in manipulating microalgae to promote oil production.
Conclusions
In this study, CrCIS gene silencing increased TAG production by 169.5% in algal cells. CrCIS activity decreased by 16.7% to 37% in transgenic strains compared with that of the control. The mRNA levels of DGAT2 and PAP2 that are directly related to lipid biosynthesis significantly increased. Conversely, overexpression of CrCIS gene decreased the TAG level by 45% but increased CrCIS activity by 209% to 266% in transgenic algae. This result suggested that the silencing or overexpression of CrCIS gene caused photosynthetic carbon flux to enter fatty acid synthesis or the TCA cycle, thereby controling the lipid synthesis in cells.
Methods
Bioinformatics
Information on Chlamydomonas CIS gene (JGI Protein ID: 194915; NCBI XP_001695571) was obtained from the JGI Chlamydomonas database (C. reinhardtii v4.0 http://genome.jgi-psf.org/Chlre4/Chlre4.home.html). Subcellular localization of proteins was predicted by Euk-mPLoc 2.0 [20,21]. Sequence alignment and the phylogenetic tree of CIS was created using ClustalW (http://www.genome.jp/tools/clustalw/) [22]. Active consensus sites were identified based on the Sanger Pfam database (http://pfam.sanger.ac.uk/search).
Algal strain, cultivation conditions, and biomass assay
C. reinhardtii CC425 (mt) was purchased from the Chlamydomonas Genetics Center at Duke University. Cells were grown on a Tris-acetate-phosphate (TAP) agar plate, inoculated into 100 mL Erlenmeyer flasks containing 50 mL of HSM and N-deficient HSM (HSM-N) media [23]. The HSM medium was composed of NH4Cl (0.500 g L-1), MgSO4 · 7H2O (0.020 g L-1), CaCl2 · 2H2O (0.010 g L-1), K2HPO4 (1.440 g L-1), KH2PO4 (0.720 g L-1), NaAc (2.000 g L-1), H3BO3 (0.001 g L-1), MnCl2 · 4H2O (0.005 g L-1), ZnSO4 · 7H2O (0.022 g L-1), FeSO4 · 7H2O (0.005 g L-1), CoCl2 · 6H2O (0.002 g L-1), Na2Mo7O24 · 4H2O (0.002 g L-1), and Na2 · EDTA (0.050 g L-1). The HSM-N medium contained the same components but with NH4Cl instead of NaCl. All cultures were maintained in an incubator shaker (230 rpm at 25°C) and then exposed to continuous illumination at a light intensity of 150 μmol · m-2 · s-1.
Biomass concentration (g/L) was determined by measuring the optical density of the samples at 490 nm (OD490) as described in a previous study [24]. To generate the standard curve, a series of C. reinhardtii CC425 samples with different biomass concentrations were collected. The OD490 and cell dry weight were gravimetrically determined using dried cells to plot the standard curve of OD490 versus biomass concentration (g/L). Samples were diluted to appropriate ratios to ensure that the measured OD490 values ranged from 0.15 to 0.75, if applicable. Biomass concentration was then calculated using the following formula: cell dry weight (g/L) = 0.7444 × OD490 – 0.0132 (Additional file 1: Figure S1).
Lipid content analysis
The Nile Red fluorescence method and GC/MS were used to determine lipid and TAG levels [24,25]. Algal cells were directly stained with 0.1 mg/mL Nile Red for 10 min, and then fluorescence was measured at excitation and emission wavelengths of 470 and 570 nm, respectively. The fluorescence value was calculated using the Equation FD (470/570) = (A2 – A1), where A2 is the fluorescence value of algal cells after staining with Nile Red, and A1 is that of algal cells before staining (Additional file 1: Figure S2). Total lipid extraction was carried out according to a modified method. Logarithmic-phase algal cells were collected by centrifugation and extracted using an extraction buffer (methanol : chloroform : methanoic acid, 2 : 1 : 0.1), 1 M KCl, and 0.2 M H3PO4. The lipids were obtained by centrifugation at 13780 g for 3 min. For TAG separation, we used Si60 silica TLC plates for thin-layer chromatography. The TLC plates were immersed in 0.15 M (NH4)2SO4 for 30 s and stored in an airtight container for two days. These plates were then placed in an oven at 120°C for 2.5 h and cooled at room temperature. Samples were then placed under N2 flow, and TAGs were observed on TLC plates through iodine staining. Lipid analysis was conducted as previously described. Fatty acid methyl esters derived from TAG were analyzed through GC/MS [26]. For the microscopic assay, images were acquired using a Nikon 80i Fluorescence Microscope after cells were stained with Nile Red. Nile Red signals were captured using an excitation wavelength of 480 nm, and emission was collected between 560 nm and 600 nm [27-29]. Thirty cell lipid droplets from each algal strain were examined to determine the difference between lipid contents.
RNA extraction
Total RNA was prepared as described by Li et al. with some modifications [30]. Cells from 10 mL of cultivated algae were collected by centrifugation at 10,000 × g for 1 min. After a series of phenol–chloroform extractions, nucleic acids were precipitated with two volumes of absolute ethanol and then washed with 75% ethanol. Finally, the air-dried pellet was dissolved in 40 μL of RNase-free water. RNA concentration was determined through spectrophotometry, and the integrity was examined through agarose gel electrophoresis.
Cloning of CrCIS gene
First-strand cDNA was synthesized using SuperScriptTM III Reverse Transcriptase (Invitrogen, USA) according to the instructions of the manufacturer. A fragment of the CrCIS gene was amplified by PCR using the primers CrCISL: 5′-TACTTGGCCCGTGCCTGTAT-3′ and CrCISR: 5′-CCTCCCTCCTTCATGTGTGT-3′. PCR reactions were performed in a final volume of 25 μL containing 1× PCR reaction buffer, 2 mM MgCl2, 0.4 μmol of each primer, 0.25 mM dNTPs, 1 μL DMSO, 0.5 M Betain, and 0.5 U Taq DNA polymerase (Promega, USA) according to the following program: 4 min at 95°C; 35 cycles of denaturation for 40 s at 95°C, annealing for 40 s at 58°C, and elongation for 20 s at 72°C; and 10 min at 72°C. After purification using the EZ-10 Spin Column DNA Gel Extraction Kit (BBI, Canada), DNA was inserted into vector pMD18-T following the instructions of the manufacturer (TaKaRa, Japan). The resulting plasmid was designated as pMD18T-CrCIS. The sequences of the cloned CrCIS gene were verified through double-stranded sequence analysis (Shanghai Sangon Biological Engineering Technology & Services Co., Ltd).
Construction of the RNAi vector against CrCIS gene
To construct the RNAi vector against CrCIS gene, a fragment of C. reinhardtii 18S gene was amplified with primers 5′-CGAACTTCTGCGAAAGCAT-3′ and 5′-TCAGCCTTGCGACCATACT-3′ and then inserted into pMD18-T producing pMD18T-18S. The fragment of CrCIS and its reverse complementary sequences were amplified through PCR using pMD18T-CrCIS as the template and the primers CISRNAiL: 5′-GACGCGCACAGCGGCGTGCT-3′ and CISRNAiR: 5′-CCTCCCTCCTTCATGTGTGT-3′. The PCR fragment was then digested with KpnI/BamHI and HindIII/SalI, after which the fragment was inserted into the corresponding cloning sites of pMD18T-18S. The fragment yielded pMD18-CrCIS F-18S-CrCIS R, which contained an inverted repeat sequence of CrCIS (CrCIS IR). pMD18-CrCIS F-18S-CrCIS R was double digested with KpnI and HindIII to obtain CrCIS IR. Finally, CrCIS IR was inserted as a blunt-end fragment into EcoRI-digested pMaa7/XIR to produce pMaa7IR/CrCIS IR.
Construction of the overexpression vector of CrCIS gene for Chlamydomonas
To construct the overexpression vector of CrCIS gene, the coding sequence of CrCIS was amplified through PCR using pMD18T-CrCIS and primers 5′-TTCAAGATCTGATGCTGGCCACGGCC-3′ and 5′-TAACACTAGTTTACGCGGACTGGCC-3′ as templates. The fragment was digested with NcoI/SpeI and inserted into similarly digested pCAMBIA1302 to yield pCAMBIACIS facilitating the overexpression of CrCIS.
Transformation of Chlamydomonas
Transformation of C. reinhardtii strain CC425 was performed as described by Kindle [31]. C. reinhardtii cells were grown in TAP medium until having a cell density of 1–2 × 10⁶ cells/mL. Cells were collected by centrifugation, washed twice, and then resuspended in TAP medium until having a cell density of approximately 1 × 10⁸ cells/mL. Plasmid DNA was introduced into the cells through the glass bead procedure. In each case, 2 μg of plasmid DNA was added to a mixture containing 400 μl of cells, 100 μl of 20% polyethylene glycol, and 300 mg of sterile glass beads. The reaction was mixed for 15 s on a benchtop vortex. To enable induction of RNAi or gene expression, cells were allowed to recover for one day before plating onto selective media. RNAi transformants were selected on TAP medium containing 1.5 mM l-tryptophan, 5 μg/mL paromomycin, and 5 μM 5-FI. Meanwhile, pCAMBIACIS transformants were selected on TAP medium containing 50 μg/mL hygromycin. Plates were incubated under dim light (approximately 50 μmol · m-2 · s-1 photosynthetically active radiation), and isolated transgenic strains were kept under constant selective pressure.
Expression of CrCIS in Escherichia coli BL21
To express CrCIS in E. coli BL21, the coding region was amplified from pMD18T-CrCIS with primer pairs GEXCIS-F: 5′-TAAAGGATCCATGCTGGCCACGGCC-3′ and GEXCIS-R: 5′-TAAGCTCGAGTTACGCGGACTGGCC-3′. The amplified fragments were digested with BamHI/SalI and then inserted into similar digested pGEX-6p-1 to administer pGEXCIS. The transformation of E. coli BL21 and subsequent foreign protein detection by sodium dodecyl sulfate polyacrylamide gel electrophoresis (SDS-PAGE) and purification of the glutathione S-transferase (GST)-fusion protein were conducted as described by Sambrook and Russell [32].
Quantitative real-time PCR
Samples for real-time PCR analysis were performed as described by Fei et al. and Deng et al. [10,33]. RNA was extracted using TRIzol Reagent (Shanghai Sangon Biological Engineering Technology & Service Co.). Single-strand cDNA was synthesized using an Invitrogen SuperScriptTM III cDNA synthesis kit with 100 ng of RNA, and random primers performed at 65°C for 5 min, 25°C for 5 min, and 42°C for 50 min. Real-time PCR was performed on a BioRad iCycler iQ Real-Time PCR Detection System using SYBR Green as the fluorescent dye. Each reaction was performed with a final volume of 25 μl with the following components: 0.2 pmol of each primer, 1 μl of cDNA, and 12.5 μl of SYBR Green Mix (Invitrogen SYBR GreenER qPCR). Water was used to adjust the volume to 25 μl. The iCycler protocol was performed as follows: denaturing at 95°C, 5 min, and 40 cycles of denaturing at 95°C for 30 s; annealing at 54°C for 30 s; and amplification at 72°C for 15 s. The specificity of PCR amplification was examined with a melting curve program (55°C to 100°C at a heating rate of 0.5°C/s). 18S rRNA was used as the control with primers 18SrRNAF (5′-TCAACTTTCGATGGTAGGATAGTG-3′) and 18SrRNAR (5′-CCGTGTCAGGATTGGGTAATTT-3′). The expression of this control gene was measured and concluded to be constant under all conditions used in this study. The gene-specific primers listed in Table S2 (Additional file 1) were used to evaluate the quantity of target cDNA. The amplification rate of each transcript (Ct) was calculated through the PCR baseline-subtracted method performed with iCycler software at a constant fluorescence level. Ct values were determined over three repeats. Relative fold differences were calculated based on the relative quantification analytical method (2-ΔΔCT) using 18 s rRNA amplification as an internal standard [34].
Detection of CIS activities
Transgenic algal samples cultivated in the log phase were collected and centrifuged (3000 rpm for 5 min). Algal cell pellets were then collected and washed with phosphate buffer. Cells were sonicated in 3 mL of extract buffer and then centrifuged (3000 rpm for 5 min) to collect the supernatant totaling a volume of 6 mL through adding extract buffer. The enzyme extract to be detected was obtained by dialyzing with extract buffer. CIS activity was measured as described by Sienkiewicz et al. with some modifications [35]. The dialyzed enzyme sample was mixed with 40 mmol/L Tris–HCl buffer (pH 9.0), 0.04 mmol/L DTNB, 0.08 mmol/L acetyl–CoA, and 0.04 mmol/L OAA. The absorbance of the samples requiring 15 s per scan was measured, and the total scan time was 3 min.
Competing interests
The authors declare that they have no competing interests.
Authors’ contributions
XDD executed the molecular biology studies, participated in the data analysis and drafted the manuscript. JJC performed the lipid and TAG content detection, participated in the SDS-PAGE and CIS activity detection. XWF accomplished the statistical analysis, conceived the study, participated designing the study, coordinated the research, and assisted in drafting the manuscript. All authors read and approved the final manuscript.
Supplementary Material
The correlation between biomass (Cell dry weight g/L) and the optical density OD490. Figure S2: The correlation between lipid concentration (Triolein mg/20 mL) and the fluorescence value FD470/570. Table S1: Primers used in this work. Table S2: Primers for Real Time PCR. Table S3: The numbers of lipid droplets in algae cell.
Contributor Information
Xiaodong Deng, Email: xiaodong9deng@hotmail.com.
Jiajia Cai, Email: Caijiajia236@126.com.
Xiaowen Fei, Email: feixw2000@hotmail.com.
Acknowledgement
This work was supported by the National Natural Science Foundation of China (31160050, 31360051, 31000117), the Major Technology Project of Hainan (ZDZX2013023-1), the National Nonprofit Institute Research Grants (CATAS-ITBB110507, 130305), the Funds of Hainan Engineering and Technological Research (GCZX2011006, GCZX2012004, GCZX2013004), and the Natural Science Foundation of Hainan Provence (313077).
References
- Sugimoto T, Tanaka K, Monma M. Phosphoenolpyruvate carboxylase level in soybean seed highly correlates to its contents of protein and lipid. Agri Bio Chem. 1989;14:885–887. doi: 10.1271/bbb1961.53.885. [DOI] [Google Scholar]
- Chen JQ, Huang RZ, Lang CX, Hu ZH, Liu ZH. Molecular cloning and sequencing of the PEP gene from Brassica napus and the construction of the antisense PEP gene. J Zhejiang Univ Sci B. 1999;14:365–367. [Google Scholar]
- Chen JQ, Lang CX, Hu ZH, Liu ZH, Huang RZ. Antisense PEP gene regulates to ratio of protein and lipid content in Brassica napus seeds. J Agri Biotech. 1999;14:316–320. [Google Scholar]
- Tong J, Zhan GM, Wang XF, Liu GH, Hua W, Wang HZ. Cloning of citrate synthase gene in rapeseed (Brassica napus L.) and its expression under stresses. Acta Agro Sin. 2009;14:33–40. doi: 10.3724/SP.J.1006.2009.00033. [DOI] [Google Scholar]
- Hu LH, Wu HM, Zhou ZM, Lin YJ. Introduction of citrate synthase gene (CS) into an elite indica rice restorer line Minghui 86 by Agrobacterium-mediated method. Mol Plant Bre. 2006;14:160–166. [Google Scholar]
- Barone P, Rosellini D, LaFayette P, Bouton J, Veronesi F, Parrott W. Bacterial citrate synthase expression and soil aluminum tolerance in transgenic alfalfa. Plant Cell Rep. 2008;14:893–901. doi: 10.1007/s00299-008-0517-x. [DOI] [PubMed] [Google Scholar]
- Chi GH, Zhou XL, Li MY, Xu BY, Jing ZQ. Cloning and bioinformatic analysis of MaGCS encoding a homolog citrate synthase from banana. Chinese J Tropi Agri. 2009;14:12–18. [Google Scholar]
- Zhang XM, Du LQ, Sun GM, Gong DQ, Chen JY, Li WC, Xie JH. Changes in organic acid concentrations and the relative enzyme activities during the development of Cayenne pineapple fruit. J Fruit Sci. 2007;14:381–384. [Google Scholar]
- Barrie FT. Fine control of citrate synthase activity in blue-green algae. Arch Mikrobiol. 1973;14:245–249. doi: 10.1007/BF00411205. [DOI] [PubMed] [Google Scholar]
- Deng XD, Gu B, Li YJ, Hu XW, Guo JC, Fei XW. The roles of acyl-CoA: diacylglycerol acyltransferase 2 genes in the biosynthesis of triacylglycerols by the green algae Chlamydomonas reinhardtii. Mol Plant. 2012;14:945–947. doi: 10.1093/mp/sss040. [DOI] [PubMed] [Google Scholar]
- Roesler K, Shintani D, Savage L, Boddupalli S, Ohlrogge J. Targeting of the Arabidopsis homomeric acetyl-coenzyme A carboxylase to plastids of rapeseeds. Plant Physiol. 1997;14:75–81. doi: 10.1104/pp.113.1.75. [DOI] [PMC free article] [PubMed] [Google Scholar]
- Vigeolas H, Waldeck P, Zank T, Geigenberger P. Increasing seed oil content in oil-seed rape (Brassica napus L.) by over-expression of a yeast glycerol-3-phosphate dehydrogenase under the control of a seed-specific promoter. Plant Biotech J. 2007;14:431–441. doi: 10.1111/j.1467-7652.2007.00252.x. [DOI] [PubMed] [Google Scholar]
- Zou JT, Qi Q, Katavic V, Marillia E-F, Taylor DC. Effects of antisense repression of an Arabidopsis thaliana pyruvate dehydrogenase kinase cDNA on plant development. Plant Mol Biol. 1999;14:837–849. doi: 10.1023/A:1006393726018. [DOI] [PubMed] [Google Scholar]
- Marillia EF, Micallef BJ, Micallef M, Weninger A, Pedersen KK, Zou J. Biochemical and physiological studies of Arabidopsis thaliana transgenic lines with repressed expression of the mitochondrial pyruvate dehydrogenase kinase. J Exp Bot. 2003;14:259–270. doi: 10.1093/jxb/erg020. [DOI] [PubMed] [Google Scholar]
- Baud S, Santos MM, To A, Harsoët LL, Dubreucq B. WRINKLED1 specifies the regulatory action of LEAFY COTYLEDON2 towards fatty acid metabolism during seed maturation in Arabidopsis. Plant J. 2007;14:825–838. doi: 10.1111/j.1365-313X.2007.03092.x. [DOI] [PubMed] [Google Scholar]
- Andre C, Froehlich JE, Moll MR, Benning C. A heteromeric plastidic pyruvate kinase complex involved in seed oil biosynthesis in Arabidopsis. Plant Cell. 2007;14:2006–2022. doi: 10.1105/tpc.106.048629. [DOI] [PMC free article] [PubMed] [Google Scholar]
- Wakao S, Andre C, Benning C. Functional analyses of cytosolic glucose-6-phosphate dehydrogenases and their contribution to seed oil accumulation in Arabidopsis. Plant Physiol. 2008;14:277–288. doi: 10.1104/pp.107.108423. [DOI] [PMC free article] [PubMed] [Google Scholar]
- Ratcliffe RG, Shachar-Hill Y. Measuring multiple fluxes through plant metabolic networks. Plant J. 2006;14:490–511. doi: 10.1111/j.1365-313X.2005.02649.x. [DOI] [PubMed] [Google Scholar]
- Fan J, Yan C, Andre C, Shanklin J, Schwender J, Xu C. Oil accumulation is controlled by carbon precursor supply for fatty acid synthesis in Chlamydomonas reinhardtii. Plant Cell Physiol. 2012;14:1380–1390. doi: 10.1093/pcp/pcs082. [DOI] [PubMed] [Google Scholar]
- Chou KC, Shen HB. Cell-PLoc: a package of web-servers for predicting subcellular localization of proteins in various organisms. Nat Protoc. 2008;14:153–162. doi: 10.1038/nprot.2007.494. [DOI] [PubMed] [Google Scholar]
- Chou KC, Shen HB. A new method for predicting the subcellular localization of eukaryotic proteins with both single and multiple sites: Euk-mPLoc 2.0. PLoS ONE. 2010;14:e9931. doi: 10.1371/journal.pone.0009931. [DOI] [PMC free article] [PubMed] [Google Scholar]
- Li KB. ClustalW-MPI: ClustalW analysis using distributed and parallel computing. Bioinformatics. 2003;14:1585–1586. doi: 10.1093/bioinformatics/btg192. [DOI] [PubMed] [Google Scholar]
- Harris EH. The Chlamydomonas source book: a comprehensive guide to biology and laboratory use. San Diego, CA: Academic Press; 1989. [DOI] [PubMed] [Google Scholar]
- Deng XD, Li YJ, Fei XW. The mRNA abundance of pepc2 gene is negatively correlated with oil content in Chlamydomonas reinhardtii. Biomass Bioenergy. 2011;14:1811–1817. doi: 10.1016/j.biombioe.2011.01.005. [DOI] [Google Scholar]
- Liu B, Vieler A, Li C, Daniel Jones A, Benning C. Triacylglycerol profiling of microalgae Chlamydomonas reinhardtii and Nannochloropsis oceanica. Bioresour Technol. 2013;14:310–316. doi: 10.1016/j.biortech.2013.07.088. [DOI] [PubMed] [Google Scholar]
- La Russa M, Bogen C, Uhmeyer A, Doebbe A, Filippone E, Kruse O, Mussgnug JH. Functional analysis of three type-2 DGAT homologue genes for triacylglycerol production in the green microalga Chlamydomonas reinhardtii. J Biotechnol. 2012;14:13–20. doi: 10.1016/j.jbiotec.2012.04.006. [DOI] [PubMed] [Google Scholar]
- Gao CF, Xiong W, Zhang YL, Yuan WQ, Wu QY. Rapid quantitation of lipid in microalgae by time-domain nuclear magnetic resonace. J Microbiol Meth. 2008;14:437–440. doi: 10.1016/j.mimet.2008.07.019. [DOI] [PubMed] [Google Scholar]
- Huang GH, Chen G, Chen F. Rapid screening method for lipid production in alga based on Nile red fluorescence. Biomass Bioenergy. 2009;14:1386–1392. doi: 10.1016/j.biombioe.2009.05.022. [DOI] [Google Scholar]
- Chen W, Zhang C, Song L, Sommerfeld M, Hu Q. A high throughput Nile red method for quantitative measurement of neutral lipids in microalgae. J Microbiol Meth. 2009;14:41–47. doi: 10.1016/j.mimet.2009.01.001. [DOI] [PubMed] [Google Scholar]
- Li YJ, Fei XW, Deng XD. Novel molecular insights into nitrogen starvation-induced triacylglycerols accumulation revealed by differential gene expression analysis in green algae Micractinium pusillum. Biomass Bioenergy. 2012;14:199–211. [Google Scholar]
- Kindle KL. High frequency nuclear transformation of Chlamydomonas reinhardtii. Proc Natl Acad Sci USA. 1990;14:1228–1232. doi: 10.1073/pnas.87.3.1228. [DOI] [PMC free article] [PubMed] [Google Scholar]
- Sambrook J, Russell DW. Molecular Cloning: A Laboratory Manual, volume 3. Cold Spring Harbour, NY: Cold Spring Harbour Laboratory Press; 2001. [Google Scholar]
- Fei XW, Deng XD. A novel Fe deficiency responsive element (FeRE) regulates the expression of atx1 in Chlamydomonas reinharditii. Plant Cell Physiol. 2007;14:1496–1503. doi: 10.1093/pcp/pcm110. [DOI] [PubMed] [Google Scholar]
- Livak KJ, Schmittgen TD. Analysis of relative gene expression data using real-time quantitative PCR and the 2(-Delta Delta C(T)) Method Methods. 2001;14:402–408. doi: 10.1006/meth.2001.1262. [DOI] [PubMed] [Google Scholar]
- Sienkiewicz PA, Nunes NA, Sulpice R, Lisec J, Centeno DC, Carillo P, Leisse A, Urbanczyk WE, Fernie AR. Mild reductions in mitochondrial citrate synthase activity result in a compromised nitrate assimilation and reduced leaf pigmentation but have no effect on photosynthetic performance or growth. Plant Physiol. 2008;14:115–127. doi: 10.1104/pp.108.117978. [DOI] [PMC free article] [PubMed] [Google Scholar]
Associated Data
This section collects any data citations, data availability statements, or supplementary materials included in this article.
Supplementary Materials
The correlation between biomass (Cell dry weight g/L) and the optical density OD490. Figure S2: The correlation between lipid concentration (Triolein mg/20 mL) and the fluorescence value FD470/570. Table S1: Primers used in this work. Table S2: Primers for Real Time PCR. Table S3: The numbers of lipid droplets in algae cell.


