

Abstract
BACKGROUND: A few studies in the last several years have shown that metabolomics, the study of metabolites and small intermediate molecules, may help better understand the breast carcinogenesis. However, breast cancer is a heterogeneous disease with different subtypes. Additionally, there is a significant racial difference in terms of breast cancer incidence and mortality. Few, if any, metabolomics studies in breast cancer have considered race and tumor subtypes in the study design. METHODS: We performed a global metabolomic profiling using mass spectrometry and samples from 60 breast cancer cases and 60 matched controls. RESULTS: A total of 375 named metabolites were observed, with 117 metabolites whose levels were significantly different between African American and Caucasian American women (P < .05 and q < 0.10) and 78 that differed between breast cancer cases and healthy controls (P < .05 and q < 0.10). Most of those differentiated metabolites belong to amino acids, fatty acids, and lysolipids. In the pathway-based analysis, we found that plasma levels of many amino acids were statistically significantly lower in patients with breast cancer, especially those with triple-negative breast cancer, than healthy controls. However, plasma levels of many FAs related to β-oxidation were statistically significantly higher in patients with breast cancer than healthy controls, suggesting the possibility of altered FA β-oxidation in patients with breast cancer. CONCLUSIONS: Because of small sample size, the clinical usage of the metabolites from this study is unclear. Further validation of those significant metabolites is warranted, especially with the consideration of racial difference.
Introduction
Metabolomics is a science that provides a dynamic portrait of metabolic status. Downstream from genomics, transcriptomics, and proteomics, metabolomics assesses end products of the myriad of intercellular pathways. Because they are end products, metabolites are much more stable compared to the upstream products, such as mRNAs and proteins [1]. However, the metabolic phenotype is sensitive to genetic modification, pathophysiological stimuli, pharmaceutical interventions, and environmental exposures [2–4]. Major changes can be seen even after minor stimuli. Therefore, metabolites can potentially serve as indicators of the overall physiological status, such as cancer, as well as the response to host and environmental stimuli.
Breast cancer is the most common form of cancer in women. Metabolomics may be valuable in furthering our understanding the etiology of breast cancer, especially the difference between African Americans (AAs) and Caucasian Americans (CAs), and among different tumor subtypes. Breast cancer results from multistep carcinogenesis. Mounting evidence from cancer cell metabolism demonstrates that the transforming process from normal to malignant cells is associated with profound metabolic disturbances [5–7], and individual tumors rely on complex, dynamic interaction between tumor and host. The malignant metabolic phenotype and tumor dependence on host form the biologic rationale underlying the exploration of the evolving field of metabolomics in breast cancer.
Although the application of metabolomics in breast cancer research is still at an early stage, a few studies have already been carried out to explore the possibility of using metabolomic profiles as biomarkers of early detection, tumor characterization, and clinical outcome prediction [8–14]. Borgan et al. identified a panel of metabolites in breast tumor tissues, including glucose, myoinositol, and alanine, which can successfully differentiate subgroups of breast tumors [11]. In another study by Sitter et al., they found that a panel of metabolites in breast tumor tissues can discriminate the patients with good prognosis from the ones with poor prognosis [9]. The metabolite profiles have also been interrogated in body fluids from patients with breast cancer and healthy controls, such as serum, urine, and saliva [10,12,13]. For example, Asiago et al. found a panel of 11 metabolites including choline and tyrosine in serum that can predict 55% of the patients who have recurrence 13 months before the recurrence was diagnosed clinically [12].
However, to our knowledge, there has been no study to date examining the metabolomic profiles in plasma samples with the consideration of race and tumor subtypes in breast cancer. To fill the gap, we conducted the current study to explore whether metabolomic profiles could differentiate patients with breast cancer and healthy women, with the consideration of race (CA vs AA) and tumor receptor status [triple-negative vs estrogen receptor-positive/progesterone receptor-positive (ER+/PR+) breast tumors].
Materials and Methods
Study Population
The study was approved by the Institutional Research Board of Roswell Park Cancer Institute. Anonymized biospecimens and questionnaire data used were made available through the Roswell Park Cancer Institute Data Bank and BioRepository (DBBR) [15]. Patients are enrolled through site-specific clinics before surgery and/or chemotherapy, and controls are individuals who are free from cancer and are visitors or family members of patients. Relationships between patients and controls are carefully annotated, so that we avoid overmatching patients to their own family or friends. Written consent is obtained from every individual before he/she enrolls in the DBBR. The consent allows DBBR to provide anonymized biospecimens and questionnaire data for Institutional Research Board-approved protocols (such as this study) without further consent. Patients and controls are consented to provide a blood sample and to complete a questionnaire. Blood samples are drawn in phlebotomy and transferred to the DBBR laboratory. Following DBBR standard operating procedure, samples are processed and blood components were stored within 1 hour of collection to minimize degradation. Ten milliliters of whole blood was obtained from each study subject. Plasma was extracted by centrifuging whole blood at 3000 rpm for 10 minutes at room temperature. All extracted plasma samples were stored in phased liquid nitrogen. To minimize the effect of freeze-thaw on metabolites, we only used plasma samples that had not been previously thawed. In addition, to minimize the potential effect of fasting/nonfasting, we only used fasting plasma samples. In this study, a total of 60 women with breast cancer and 60 cancer-free women were included in the metabolomic profiling analysis.
Metabolomic Analysis
Metabolomic profiling was conducted on plasma samples at Metabolon Inc (Durham, NC) according to the protocol described below.
Sample accessioning. Each sample received was accessioned into a laboratory information management system (LIMS) and was assigned by the LIMS a unique identifier that was associated with the original source identifier only. This identifier was used to track all sample handling, tasks, results, and so on. The samples (and all derived aliquots) were tracked by LIMS. All portions of any sample were automatically assigned their own unique identifiers by LIMS when a new task was created; the relation of these samples was also tracked. All samples were maintained at 80°C until processed.
Sample preparation. Sample extraction was conducted by using aqueous methanol, delivered by an automated liquid handler to remove the protein fraction while allowing maximum recovery of small molecules. The resulting extract was divided into four fractions: one for analysis by ultra-HPLC tandem mass spectroscopy (UPLC/MS/MS2) in the positive mode, one for UPLC/MS/MS2 (negative mode), one for gas chromatography-mass spectrometry (GC-MS), and one for backup. Samples were placed briefly on a TurboVap (Zymark) to remove the organic solvent. Each sample was then frozen and dried under vacuum. Samples were then prepared for the appropriate instrument, either UPLC/MS/MS2 or GC-MS.
Ultra-HPLC tandem mass spectroscopy. The sample extracts destined for UPLC/MS/MS2 positive and negative mode analyses were reconstituted and analyzed. Briefly, two of the dried extracts were reconstituted in acidic or basic liquid chromatography (LC)-compatible solvents, respectively. The acidic reconstituted extract was analyzed under positive ion optimized MS conditions, and the basic extract was analyzed by using negative ion MS optimized conditions in two independent injections by using separate dedicated columns. The Orbitrap Elite used a heated electrospray ionization source and Orbitrap mass analyzer operated at 30,000 mass resolution, scanned 80 to 1000 m/z, and alternated between MS and data-dependent MS2 scans by using dynamic exclusion.
Gas chromatography-mass spectroscopy. The samples destined for GC-MS analysis were redried under vacuum desiccation for a minimum of 24 hours before being derivatized under dried nitrogen with the use of bis-trimethylsilyl triflouroacetamide. The GC column was 5% phenyl, and the temperature ramp was from 40°C to 300°C in a 16-minute period. Samples were analyzed on a Thermo-Finnigan Trace DSQ fast scanning single-quadrupole mass spectrometer by using electron impact ionization. The instrument was tuned and calibrated for mass resolution and mass accuracy on a daily basis. The information output from the raw data files was automatically extracted as discussed below.
Quality assurance/quality control. For quality assurance/quality control (QC) purposes, additional samples were included with each day's analysis. These samples included extracts of a pool of well-characterized human plasma, extracts of a pool created from a small aliquot of the experimental samples, and process blanks. QC samples were spaced evenly among the injections, and all experimental samples were randomly distributed throughout the run. A selection of QC compounds was added to every sample for chromatographic alignment, including those under test. These compounds were carefully chosen so as not to interfere with the measurement of the endogenous compounds.
Data extraction and compound identification. Raw data were extracted, peak-identified, and QC processed. Briefly, compounds were identified by comparison of experimental data to the laboratory's authenticated standard library of purified standards or recurrent unknown entities. This library contains the retention time/index, m/z of the intact standard and its fragmentation spectral data (MS2 or MS/MS), and chromatographic data on all molecules present in the library. Biochemical identifications were based on three criteria: retention index within a narrow retention time/index window of the proposed identification, accurate mass match to the library, and the MS/MS forward and reverse scores between the experimental data and authentic standards. More than 3000 commercially available purified standard compounds have been acquired and registered into LIMS for distribution to both the LC and GC platforms for determination of their analytic characteristics. A total of 375 named compounds were identified in our samples. Metabolites were then grouped into eight mutually exclusive chemical classes (amino acids, carbohydrates, cofactors and vitamins, energy metabolites, lipids, nucleotide metabolites, peptides, and xenobiotics) based on the available literature.
Statistical Analysis
Normalized metabolite concentrations were log-transformed. The missing values were imputed to the minimum of nonmissing values. Two types of statistical analysis were performed: 1) significance tests and 2) pathway analysis. 1) Analysis of variance (ANOVA) contrasts were used to identify metabolites that differed significantly between experimental groups. A group of metabolites that achieved statistical significance (P < .05), as well as those approaching significance (.05 < P < .10), was identified. Analysis by two-way ANOVA identified metabolites exhibiting significant interaction and main effects for experimental parameters of race and cancer disease status. An estimate of the false discovery rate (q value) was calculated to take into account the multiple comparisons that normally occur inmetabolomic-based studies. A low q value (q < 0.10) is an indication of high confidence in a result. 2) For pathway, we used random forest analyses. Random forests give an estimate of how well we can classify individuals in a new data set into each group, in contrast to a t test, which tests whether the unknown means for two populations are different or not. Random forests create a set of classification trees based on continual sampling of the experimental units and compounds. Then, each observation is classified on the basis of the majority votes from all the classification trees. Statistical analyses were performed with the program “R” (http://cran.r-project.org/).
Results
The study population included 60 patients with breast cancer and 60 healthy women as controls. Per their cancer status (case vs control), race (AA vs CA), and receptor status (ER+/PR+ vs triple negative), they were divided into six groups, namely, C-P: CA breast cancer patients with ER+/PR+ breast tumors (N = 15), A-P: AA breast cancer patients with ER+/PR+ breast tumors (N = 15), C-3N: CA breast cancer patients with triple-negative breast tumors (N = 15), A-3N: AA breast cancer patients with triple-negative breast tumors (N = 15), C-C: CA control subjects (N = 36), and A–C: AA control subjects (N = 24). The groups did not differ on age (P = .87), menopausal status (P = .74), and body mass index (BMI; P = .53).
Following log transformation and imputation with minimum observed values for each metabolite, a total of 375 named metabolites were included in the analysis. The original data were presented in Table W1. Overall, plasma levels of metabolites were significantly different by cancer status, race, and tumor receptor status. Using two-way ANOVA to explore the impact of race and cancer status, we observed 117 metabolites whose levels were significantly different between AA and CA women (P < .05) and 78 metabolites whose levels were significantly different between patients with breast cancer and healthy controls after adjusting for multiple comparisons (P < .05 and q < 0.10; Table 1). Among metabolites that were different between AA and CA women, the dominant metabolic classes include amino acids [17], fatty acids (FAs) [27], lysolipids [26], and xanthine metabolism [10]. Figure 1 shows the box plot of six metabolites whose levels were most significantly different between AA and CA women (both P and q value < 0.001). They are 5-oxoproline, tetradecanedioate, hexadecanedioate, 1-myristoylglycerophosphocholine, 2-myristoylglycerophosphorcholine, and α-tocopherol. Among metabolites that were different between breast cancer cases and healthy controls, the dominant metabolic classes include amino acids [15], FAs [23], and lysolipids [19]. Figure 2 shows the box plot of five metabolites whose levels were most significantly different between breast cancer cases and healthy controls (P < .001 and q value ranges from 0.0059 to 0.0131). They are alanine, tyrosine, hexanoylcarnitine, 1-myristoylglycerophosphocholine, and 2-palmitoylglycerophosphocholine*. In addition, 15 metabolites were observed to have significant interactions between race and cancer status (P < .05), although none of them reached statistical significance after adjusting for multiple comparisons. In further stratified analysis by race and cancer status, there were 70 and 81 metabolites whose levels were found to be significantly different between AA and CA healthy women and between AA and CA breast cancer cases (P < .05), respectively. Plasma levels of metabolites were also significantly different by tumor receptor status. We observed 31, 17, and 26 metabolites whose levels were significantly different between A-P and A-3N, C-P and C-3N, and P and 3N (P < .05), respectively.
Table 1.
Summary of Findings among Patients with Breast Cancer and Healthy Controls by Race and Tumor Receptor Status.
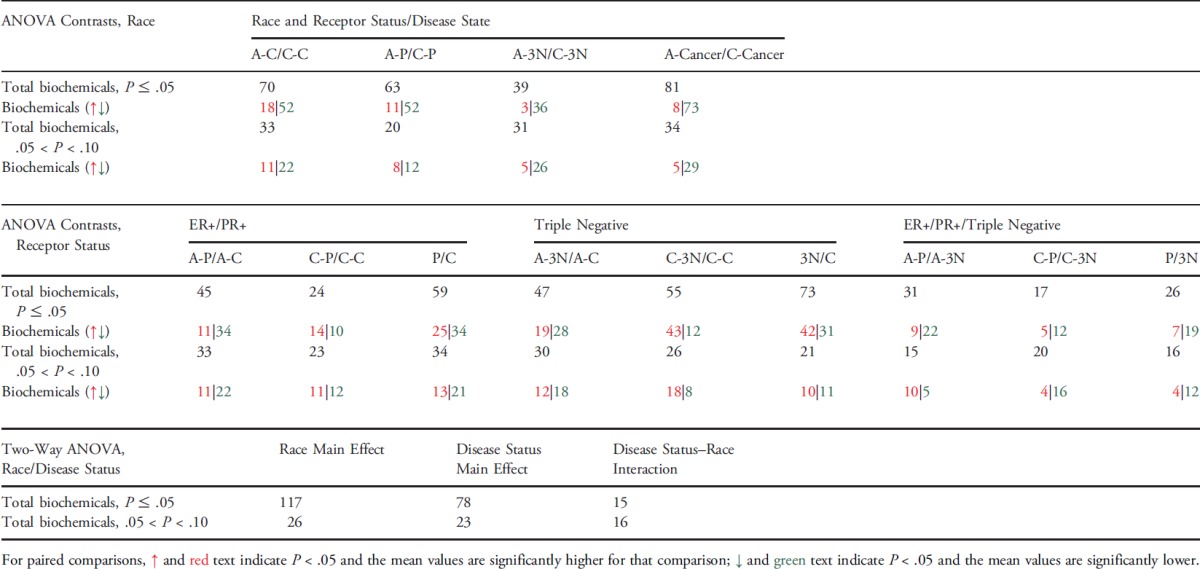 |
Figure 1.
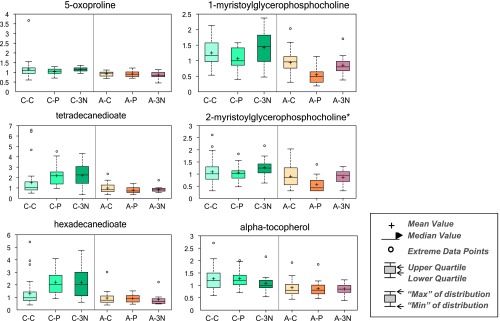
Top 6 metabolites whose levels differed between AA and CA women.
Figure 2.
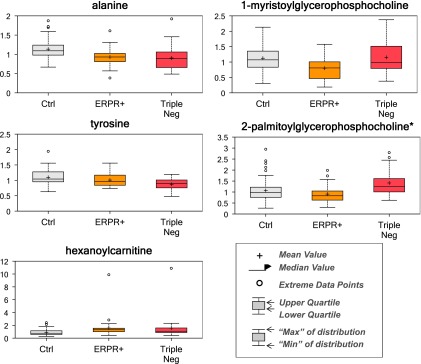
Top 5 metabolites whose levels differed between breast cancer cases and healthy controls.
Pathway-based analysis was performed to explore the significant metabolic pathways that might be involved in breast carcinogenesis. Below is the highlight of the most significant findings:
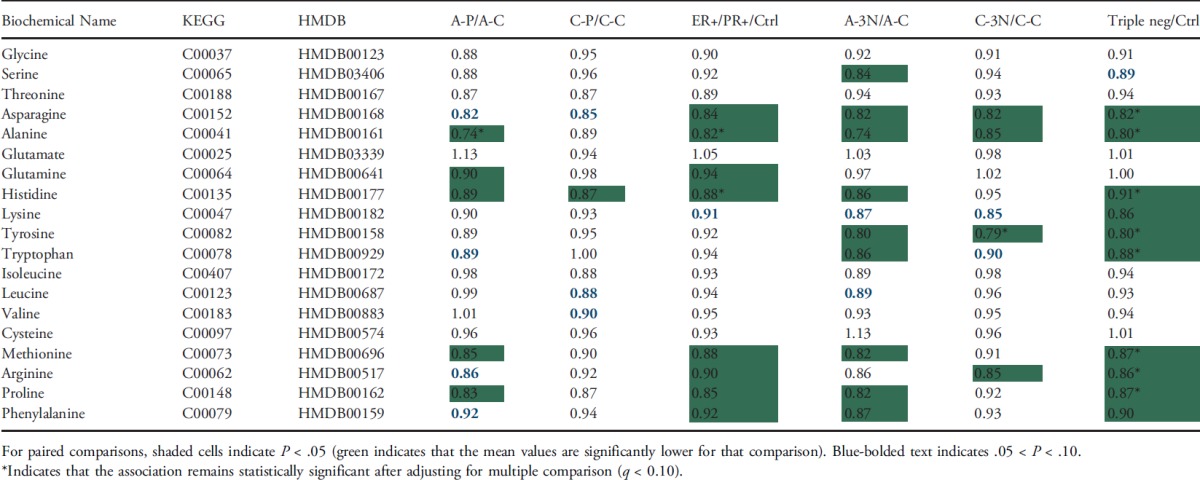
Lower levels of amino acids in patients with breast cancer than healthy controls. The majority of amino acids identified in this study were lower in the plasma samples from patients with breast cancer, especially those with triple-negative breast cancer, than healthy controls. Table 2 lists 19 amino acids observed in this study. We observed 10 amino acids whose levels were significantly lower in patients with triple-negative breast cancer than healthy controls (P < .05), and the difference remained statistically significant for eight of them even after adjusting for multiple comparisons (q ≤ 0.10). By comparison, we did not observe any amino acids whose levels were significantly higher in patients with triple-negative breast cancer than healthy controls. Similarly, we observed eight amino acids whose levels were significantly lower in patients with ER+/PR+ breast cancer than healthy controls (P ≤ .05), and the difference remained statistically significant for two amino acids even after adjusting for multiple comparison (q ≤ 0.10). When stratified by race, the difference appeared to be more evident in AA than CA study subjects. However, because of small sample size, the significant difference in both AA and CA did not remain after adjusting for multiple comparisons.
Table 2.
Comparison of Amino Acids between Patients with Breast Cancer and Healthy Controls, Stratified by Race and Tumor Receptor Status.
 |
Higher levels of FAs in patients with breast cancer than healthy controls. Levels of many FAs were higher in the plasma samples from patients with breast cancer, especially those with triple-negative breast cancer, than healthy controls. The most significantly differentiated FA metabolites are listed in Table 3. They include 4 essential FAs, 17 long-chain FAs, 3 monohydroxy FAs, 4 dicarboxylate acids, and 5 carnitine metabolites. Among them, levels of 27 FAs were significantly higher in patients with triple-negative breast cancer than healthy controls, and levels of 17 FAs were significantly higher in patients with ER+/PR+ breast cancer than healthy controls (P < .05). After adjusting for multiple comparisons, 22 of them remained statistically significant for triple-negative breast cancer, and 5 of them remained statistically significant for ER+/PR+ breast cancer (q ≤ 0.10). The higher levels of dicarboxylates, monohydroxy FAs, and medium-chain acylcarnitines in patients with breast cancer may suggest altered FA β-oxidation in patients with breast cancer [16]. When further stratified by race, we observed that dicarboxylates were significantly higher in the plasma of C-P and C-3N subjects compared to C-C subjects. For example, levels of hexadecanedioate, and octadecanedioate were significantly higher in C-P (fold changes: 1.72 and 1.64) and C-3N (fold changes: 1.71 and 1.72) subjects than C-C subjects after the adjustment of multiple comparisons. Similar trend was observed for medium-chain acylcarnitines in both breast cancer tumor subtypes compared to control subjects.
Table 3.
Comparison of Selected FA Metabolites between Patients with Breast Cancer and Healthy Controls, Stratified by Race and Tumor Receptor Status.
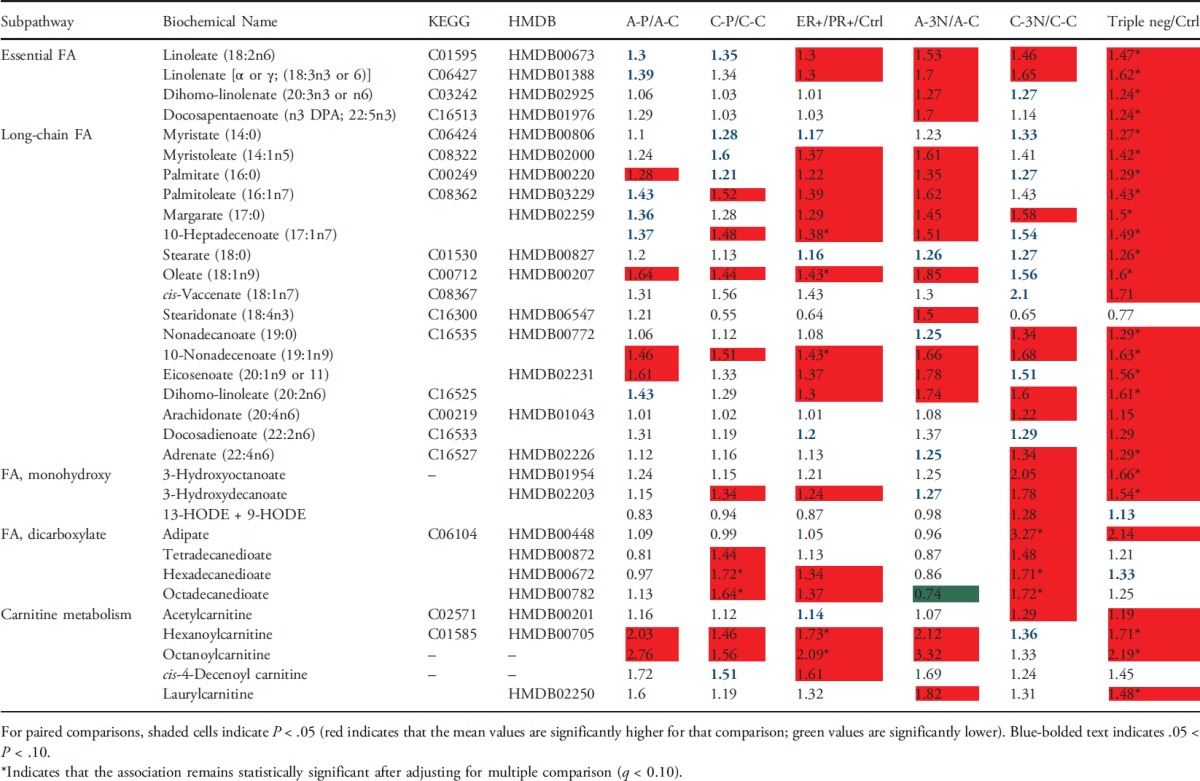 |
Patients with triple-negative breast cancer may have a stronger inflammation signature, especially in the Caucasian population. The essential FAs linoleate (18:2n6), γ-linolenate (18:3n6) [presented as an isobar with α-linolenate (18:3n3)], and dihomo-linolenate (20:3n3 or n6) were significantly higher and had an increased trend in the plasma of triple-negative and ER+/PR+ breast cancer subjects, respectively. Whereas the changes were independent of race, they were most profound in CA women (Table 3 and Figure 3). The linoleate metabolites 13-HODE + 9-HODE were also significantly higher in C-3N subjects. Metabolism of these essential FAs can increase the levels of the inflammation-associated free FA arachidonate (20:4n6), which was also significantly higher in C-3N subjects and had a nonsignificant increased trend in A-3N subjects compared to control subjects. These changes are potentially a result of the increased lipid profile of CA women with triple-negative breast cancer and could suggest increased inflammation in C-3N subjects.
Figure 3.
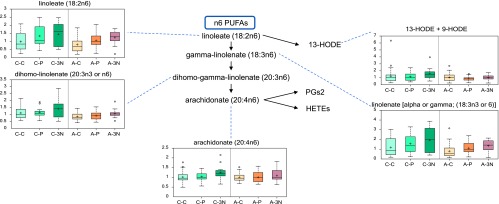
Subjects with triple-negative breast cancer have a stronger inflammation signature, especially in the CA women.
Discussion
In this analysis of metabolomic profiles of plasma samples from 60 patients with breast cancer and 60 healthy women, we observed that metabolomic profiles appeared to be different by race, cancer status, and breast tumor receptor status. Using the pathway-based approach, we found that levels of many amino acids were statistically significantly lower in patients with breast cancer than healthy controls, possibly suggesting the high demand of amino acids in breast tumor metabolism. However, we found that many FA metabolites related to FA β-oxidation were significantly higher in breast cancer cases than healthy controls, indicating overwhelmed FA β-oxidation in patients with breast cancer. In addition, we found that patients with triple-negative breast cancer had a stronger inflammation signature, especially in CA women. To our knowledge, this is the first study to use the global metabolomics analysis to characterize metabolomic profiles in breast cancer cases and healthy controls by race, cancer status, and receptor status.
One of the most important findings from this study is the widespread racial difference in plasma levels of metabolites. Racial differences may not only affect the levels of metabolites but also modify the associations between metabolites and breast cancer. Racial disparities in breast cancer are well documented [17–21]. Compared to CA women, AA women tend to develop more aggressive tumors, characterized by earlier age at diagnosis, higher nuclear grade, higher mitotic index, and lower prevalence of ER and/or PR expression, and subsequently have poorer survival. Genetic susceptibility has been suggested to play a role in the racial/ethnic disparity of breast cancer [20,22,23]. However, currently known genetic factors explain only a small fraction of the heritability for breast cancer. A substantial proportion of the observed racial/ethnic disparity remains unexplained. Additionally, most of the genetic variants identified so far are located in non-protein-encoding regions with undetermined biologic functional significance. Thus, alternative approaches are critically needed to provide new insight to biologic function and carcinogenesis. Therefore, studies focusing on metabolic profiles may prove to be a useful alternative approach. Interestingly, a recent study by Gieger et al. found that up to 12% of the observed variance in the metabolic homeostasis of the human body could be explained by genetic variants [24]. Therefore, the results from this study may help elucidate the racial difference in genetic susceptibility to breast cancer.
Tocopherols are a class of biochemicals that have different antioxidant properties dependent on the tocopherol isoform [25]. α-Tocopherol is believed to be the main source found in supplements and in the European diet, whereas γ-tocopherol is the most common form in the American diet. α-Tocopherol is the form of vitamin E that is preferentially absorbed and accumulated in humans. In this study, we found the levels of α-tocopherol were statistically significantly higher in CA than AA women (Figure 1). Meanwhile, the levels of γ-tocopherol were statistically significantly lower in CA than AA women (data not shown). Those observations suggest a race-dependent disparity in tocopherol isomers. Furthermore, C-3N subjects had significantly higher levels of γ-tocopherol and a nonsignificant decreased trend in α-tocopherol compared to C-C or C-P subjects. This finding may indicate an association among higher γ-tocopherol levels, lower α-tocopherol levels, and triple-negative breast cancer and may provide a hint for why AAs have a higher incidence of triple-negative breast cancer.
The majority of amino acids identified in this study were lower in the plasma from patients with breast cancer, especially those with triple-negative breast cancer. This observation is consistent with the roles of amino acids in carcinogenesis. Various studies have shown that the availability of circulating amino acids is often reduced in patients with cancer [26–28]. The reduced availability is caused by the malnutrition in a tumor-bearing state and by an increase in the amino acid demand as a consequence of the presence of the tumor. However, no consistent cancer-specific amino acid has emerged. Increased or decreased levels of different amino acids in blood have been reported in breast cancer [29–31]. For example, tyrosine was reported to decrease in the blood of different kinds of cancer including breast cancer [26]. Reports about alanine and asparagine in the plasma of patients with breast cancer are inconsistent, with both increased and decreased plasma levels reported [26,28,30,32]. Heber suggested that decreased Ala in plasma of patients with cancer is due to the increased alanine flux for gluconeogenesis [26].
In addition, different types of FAs are found to be different between breast cancer cases and healthy controls, including essential FAs, long-chain FAs, monohydroxy FAs, dicarboxylate acids, and carnitine metabolites. Elevated levels of FAs, either from the cancer cell or exogenous fat sources, have been suggested to promote more aggressive tumorigenic phenotype [33]. Both epidemiological and animal studies have suggested an association between dietary FAs, obesity, and an increased risk of breast cancer [34,35]. Free FAs mediate cell proliferation, extracellular signal-regulated protein kinases 1 and 2 (ERK1/2) activation, and other biologic effects in breast cancer cells, and FA accumulation may induce mitochondrial dysfunction, increased ROS production, inflammation, and so on [36]. This is consistent with our findings in this study. For example, oleic acid, which had significantly higher levels in patients with triple-negative breast cancer than healthy controls, is reported to induce proliferation, migration, prolong survival, invasion, mitogen-activated protein kinase/extracellular signal-regulated kinase (ERK) kinase 1/2 (MEK1/2), ERK1/2, and Src/focal endocrine kinases (FAK) activation in breast cancer cells [37]. n-6 polyunsaturated FAs have been reported to promote inflammation and carcinogenesis by influencing the properties of cancer and host cells [38]. Linolenic acid and linoleic acid, both belonging to n-6 polyunsaturated FAs, are also increased in patients with triple-negative breast cancer in our study. Evidence suggests that linolenic acid may influence the proliferation, differentiation, and prognosis of breast cancer [39], and genes involved in the regulation of linolenic acid metabolism were associated with breast cancer risk in a genome-wide association study of breast cancer [40].
In order for long-chain FAs to cross the mitochondrial matrix for FA β-oxidation, they must be conjugated to carnitine forming long-chain acylcarnitines (e.g., laurylcarnitine and oleoylcarnitine). Thus, the significantly higher levels of long-chain FAs and long-chain acylcarnitines observed in breast cancer plasma regardless of breast tumor subtype and race could indicate either decreased liver FA β-oxidation or possibly overwhelmed β-oxidation. One of the by-products released by the liver during FA β-oxidation is the ketone body 3-hydroxybutyrate (BHBA), which is increased in patients with triple-negative breast cancer in our study. BHBA is a well-established marker of mitochondrial dysfunction. The significantly higher BHBA in patients with breast cancer suggests that FA β-oxidation is occurring at a high rate in breast cancer subjects.
A major limitation of this study is that the biospecimens from breast cancer cases were not collected before diagnosis, which will limit our ability to infer causations between metabolites and breast cancer. The relevance of a plasma measure to tissue activity is also a potential concern. One study found similar changes in metabolomic profiles as a result of exercise in muscle biopsies and plasma [41], suggesting the validity of using plasma as the surrogate tissue. One more concern is the representativeness of a single plasma sample to reflect long-term levels. Nevertheless, our study provides evidence that metabolomic profiles differ by race, cancer status, and breast tumor receptor status. Because of small sample size, we will not be able to draw a conclusion on the clinical usage of those identified metabolites. Clearly, they need to be further vigorously validated in sequential samples collected from large and prospective multi-ethnic populations.
Supplementary Material
Footnotes
This work was supported by the National Institutes of Health (7R01CA136483 and 7R21CA139201 to H.Z., 5R21CA162218 to S.L. and H.Z., 5R03CA162131 to J.S. and H.Z., and P30 CA016056 to Roswell Park Cancer Institute) and the Department of Defense Breast Cancer Program (BC074340 to H.Z.).
This article refers to supplementary material, which is designated by Table W1 and is available online at www.transonc.com.
References
- 1.Claudino WM, Goncalves PH, di Leo A, Philip PA. Metabolomics in cancer: a bench-to-bedside intersection. Crit Rev Oncol Hematol. 2012;84:1–7. doi: 10.1016/j.critrevonc.2012.02.009. [DOI] [PubMed] [Google Scholar]
- 2.Patti GJ, Yanes O, Siuzdak G. Innovation: metabolomics: the apogee of the omics trilogy. Nat Rev Mol Cell Biol. 2012;13:263–269. doi: 10.1038/nrm3314. [DOI] [PMC free article] [PubMed] [Google Scholar]
- 3.Go VL, Nguyen CT, Harris DM, Lee WN. Nutrient-gene interaction: metabolic genotype-phenotype relationship. J Nutr. 2005;135:3016S–3020S. doi: 10.1093/jn/135.12.3016S. [DOI] [PubMed] [Google Scholar]
- 4.Bictash M, Ebbels TM, Chan Q, Loo RL, Yap IK, Brown IJ, de Iorio M, Daviglus ML, Holmes E, Stamler J, et al. Opening up the “Black Box”: metabolic phenotyping and metabolome-wide association studies in epidemiology. J Clin Epidemiol. 2010;63:970–979. doi: 10.1016/j.jclinepi.2009.10.001. [DOI] [PMC free article] [PubMed] [Google Scholar]
- 5.Yamaguchi M. Suppressive role of regucalcin in liver cell proliferation: involvement in carcinogenesis. Cell Prolif. 2013;46:243–253. doi: 10.1111/cpr.12036. [DOI] [PMC free article] [PubMed] [Google Scholar]
- 6.Holland JD, Klaus A, Garratt AN, Birchmeier W. Wnt signaling in stem and cancer stem cells. Curr Opin Cell Biol. 2013;25:254–264. doi: 10.1016/j.ceb.2013.01.004. [DOI] [PubMed] [Google Scholar]
- 7.Yue W, Yager JD, Wang JP, Jupe ER, Santen RJ. Estrogen receptor-dependent and independent mechanisms of breast cancer carcinogenesis. Steroids. 2013;78:161–170. doi: 10.1016/j.steroids.2012.11.001. [DOI] [PubMed] [Google Scholar]
- 8.Giskeødegård GF, Grinde MT, Sitter B, Axelson DE, Lundgren S, Fjøsne HE, Dahl S, Gribbestad IS, Bathen TF. Multivariate modeling and prediction of breast cancer prognostic factors using MR metabolomics. J Proteome Res. 2010;9:972–979. doi: 10.1021/pr9008783. [DOI] [PubMed] [Google Scholar]
- 9.Sitter B, Bathen TF, Singstad TE, Fjøsne HE, Lundgren S, Halgunset J, Gribbestad IS. Quantification of metabolites in breast cancer patients with different clinical prognosis using HR MAS MR spectroscopy. NMR Biomed. 2010;23:424–431. doi: 10.1002/nbm.1478. [DOI] [PubMed] [Google Scholar]
- 10.Asiago VM, Alvarado LZ, Shanaiah N, Gowda GA, Owusu-Sarfo K, Ballas RA, Raftery D. Early detection of recurrent breast cancer using metabolite profiling. Cancer Res. 2010;70:8309–8318. doi: 10.1158/0008-5472.CAN-10-1319. [DOI] [PMC free article] [PubMed] [Google Scholar]
- 11.Borgan E, Sitter B, Lingjærde OC, Johnsen H, Lundgren S, Bathen TF, Sørlie T, Børresen-Dale AL, Gribbestad IS. Merging transcriptomics and metabolomics—advances in breast cancer profiling. BMC Cancer. 2010;10:628. doi: 10.1186/1471-2407-10-628. [DOI] [PMC free article] [PubMed] [Google Scholar]
- 12.Slupsky CM, Steed H, Wells TH, Dabbs K, Schepansky A, Capstick V, Faught W, Sawyer MB. Urine metabolite analysis offers potential early diagnosis of ovarian and breast cancers. Clin Cancer Res. 2010;16:5835–5841. doi: 10.1158/1078-0432.CCR-10-1434. [DOI] [PubMed] [Google Scholar]
- 13.Nam H, Chung BC, Kim Y, Lee K, Lee D. Combining tissue transcriptomics and urine metabolomics for breast cancer biomarker identification. Bioinformatics. 2009;25:3151–3157. doi: 10.1093/bioinformatics/btp558. [DOI] [PubMed] [Google Scholar]
- 14.Sugimoto M, Wong DT, Hirayama A, Soga T, Tomita M. Capillary electrophoresis mass spectrometry-based saliva metabolomics identified oral, breast and pancreatic cancer-specific profiles. Metabolomics. 2010;6:78–95. doi: 10.1007/s11306-009-0178-y. [DOI] [PMC free article] [PubMed] [Google Scholar]
- 15.Ambrosone CB, Nesline MK, Davis W. Establishing a cancer center data bank and biorepository for multidisciplinary research. Cancer Epidemiol Biomarkers Prev. 2006;15:1575–1577. doi: 10.1158/1055-9965.EPI-06-0628. [DOI] [PubMed] [Google Scholar]
- 16.Kuhajda FP. Fatty acid synthase and cancer: new application of an old pathway. Cancer Res. 2006;66:5977–5980. doi: 10.1158/0008-5472.CAN-05-4673. [DOI] [PubMed] [Google Scholar]
- 17.Chlebowski RT, Chen Z, Anderson GL, Rohan T, Aragaki A, Lane D, Dolan NC, Paskett ED, McTiernan A, Hubbell FA, et al. Ethnicity and breast cancer: factors influencing differences in incidence and outcome. J Natl Cancer Inst. 2005;97:439–448. doi: 10.1093/jnci/dji064. [DOI] [PubMed] [Google Scholar]
- 18.Carey LA, Perou CM, Livasy CA, Dressler LG, Cowan D, Conway K, Karaca G, Troester MA, Tse CK, Edmiston S, et al. Race, breast cancer subtypes, and survival in the Carolina Breast Cancer Study. JAMA. 2006;295:2492–2502. doi: 10.1001/jama.295.21.2492. [DOI] [PubMed] [Google Scholar]
- 19.Kwan ML, Kushi LH, Weltzien E, Maring B, Kutner SE, Fulton RS, Lee MM, Ambrosone CB, Caan BJ. Epidemiology of breast cancer subtypes in two prospective cohort studies of breast cancer survivors. Breast Cancer Res. 2009;11:R31. doi: 10.1186/bcr2261. [DOI] [PMC free article] [PubMed] [Google Scholar]
- 20.Mavaddat N, Antoniou AC, Easton DF, Garcia-Closas M. Genetic susceptibility to breast cancer. Mol Oncol. 2010).;4:174–191. doi: 10.1016/j.molonc.2010.04.011. [DOI] [PMC free article] [PubMed] [Google Scholar]
- 21.Amirikia KC, Mills P, Bush J, Newman LA. Higher population-based incidence rates of triple-negative breast cancer among young African-American women. Cancer. 2011;117:2747–2753. doi: 10.1002/cncr.25862. [DOI] [PMC free article] [PubMed] [Google Scholar]
- 22.Collaborative Group on Hormonal Factors in Breast Cancer, author. Familial breast cancer: collaborative reanalysis of individual data from 52 epidemiological studies including 58,209 women with breast cancer and 101,986 women without the disease. Lancet. 2001;358:1389–1399. doi: 10.1016/S0140-6736(01)06524-2. [DOI] [PubMed] [Google Scholar]
- 23.Pharoah PDP, Antoniou AC, Easton DF, Ponder BAJ. Polygenes, risk prediction, and targeted prevention of breast cancer. N Engl J Med. 2008;358:2796–2803. doi: 10.1056/NEJMsa0708739. [DOI] [PubMed] [Google Scholar]
- 24.Gieger C, Geistlinger L, Altmaier E, Hrabéde Angelis M, Kronenberg F, Meitinger T, Mewes HW, Wichmann HE, Weinberger KM, Adamski J, et al. Genetics meets metabolomics: a genome-wide association study of metabolite profiles in human serum. PLoS Genet. 2008;4:e1000282. doi: 10.1371/journal.pgen.1000282. [DOI] [PMC free article] [PubMed] [Google Scholar]
- 25.Chin KY, Mo H, Ima-Nirwana S. A review of the possible mechanisms of action of tocotrienol—a potential antiosteoporotic agent. Curr Drug Targets. 2013;14:1533–1541. doi: 10.2174/13894501113149990178. [DOI] [PubMed] [Google Scholar]
- 26.Miyagi Y, Higashiyama M, Gochi A, Akaike M. Plasma free amino acid profiling of five types of cancer patients and its application for early detection. PLoS One. 2011;6:e24143. doi: 10.1371/journal.pone.0024143. [DOI] [PMC free article] [PubMed] [Google Scholar]
- 27.Tiziani S, Lopes V, Günther UL. Early stage diagnosis of oral cancer using 1H NMR-based metabolomics. Neoplasia. 2009;11:269–276. doi: 10.1593/neo.81396. [DOI] [PMC free article] [PubMed] [Google Scholar]
- 28.Heber D, Byerly LO, Chlebowski RT. Metabolic abnormalities in the cancer patient. Cancer. 1985;55:225–229. doi: 10.1002/1097-0142(19850101)55:1+<225::aid-cncr2820551304>3.0.co;2-7. [DOI] [PubMed] [Google Scholar]
- 29.Bennegård K, Lindmark L, Edén E, Svaninger G, Lundholm K. Flux of amino acids across the leg in weight-losing cancer patients. Cancer Res. 1984;44:386–393. [PubMed] [Google Scholar]
- 30.Proenza AM, Oliver J, Palou A, Roca P. Breast and lung cancer are associated with a decrease in blood cell amino acid content. J Nutr Biochem. 2003;14:133–138. doi: 10.1016/s0955-2863(02)00225-5. [DOI] [PubMed] [Google Scholar]
- 31.Cascino A, Muscaritoli M, Cangiano C, Conversano L, Laviano A, Ariemma S, Meguid MM, Rossi Fanelli F. Plasma amino acid imbalance in patients with lung and breast cancer. Anticancer Res. 1995;15:507–510. [PubMed] [Google Scholar]
- 32.Lai HS, Lee JC, Lee PH, Wang ST, Chen WJ. Plasma free amino acid profile in cancer patients. Semin Cancer Biol. 2005;15:267–276. doi: 10.1016/j.semcancer.2005.04.003. [DOI] [PubMed] [Google Scholar]
- 33.Nomura DK, Long JZ, Niessen S, Hoover HS, Ng SW, Cravatt BF. Monoacylglycerol lipase regulates a fatty acid network that promotes cancer pathogenesis. Cell. 2010;140:49–61. doi: 10.1016/j.cell.2009.11.027. [DOI] [PMC free article] [PubMed] [Google Scholar]
- 34.Nieman KM, Romero IL, Van Houten B, Lengyel E. Adipose tissue and adipocytes support tumorigenesis and metastasis. Biochim Biophys Acta. 2013;1831:1533–1541. doi: 10.1016/j.bbalip.2013.02.010. [DOI] [PMC free article] [PubMed] [Google Scholar]
- 35.Soto-Guzman A, Navarro-Tito N, Castro-Sanchez L, Martinez-Orozco R, Salazar EP. Oleic acid promotes MMP-9 secretion and invasion in breast cancer cells. Clin Exp Metastasis. 2010;27:505–515. doi: 10.1007/s10585-010-9340-1. [DOI] [PubMed] [Google Scholar]
- 36.Serra D, Mera P, Malandrino MI, Mir JF, Herrero L. Mitochondrial fatty acid oxidation in obesity. Antioxid Redox Signal. 2013;19:269–284. doi: 10.1089/ars.2012.4875. [DOI] [PMC free article] [PubMed] [Google Scholar]
- 37.Navarro-Tito N, Soto-Guzman A, Castro-Sanchez L, Martinez-Orozco R, Salazar EP. Oleic acid promotes migration on MDA-MB-231 breast cancer cells through an arachidonic acid-dependent pathway. Int J Biochem Cell Biol. 2010;42:306–317. doi: 10.1016/j.biocel.2009.11.010. [DOI] [PubMed] [Google Scholar]
- 38.Wall R, Ross RP, Fitzgerald GF, Stanton C. Fatty acids fromfish: the antiinflammatory potential of long-chain omega-3 fatty acids. Nutr Rev. 2010;68:280–289. doi: 10.1111/j.1753-4887.2010.00287.x. [DOI] [PubMed] [Google Scholar]
- 39.Zhang H, Zhou L, Shi W, Song N, Tu K, Gu Y. A mechanism underlying the effects of polyunsaturated fatty acids on breast cancer. Int J Mol Med. 2012;30:487–494. doi: 10.3892/ijmm.2012.1022. [DOI] [PMC free article] [PubMed] [Google Scholar]
- 40.Li J, Humphreys K, Heikkinen T, Aittomäki K, Blomqvist C, Pharoah PD, Dunning AM, Ahmed S, Hooning MJ, Martens JW, et al. A combined analysis of genome-wide association studies in breast cancer. Breast Cancer Res Treat. 2011;126:717–727. doi: 10.1007/s10549-010-1172-9. [DOI] [PubMed] [Google Scholar]
- 41.Lewis GD, Farrell L, Wood MJ, Martinovic M, Arany Z, Rowe GC, Souza A, Cheng S, McCabe EL, Yang E, et al. Metabolic signatures of exercise in human plasma. Sci Transl Med. 2010;2:33ra7. doi: 10.1126/scitranslmed.3001006. [DOI] [PMC free article] [PubMed] [Google Scholar]
Associated Data
This section collects any data citations, data availability statements, or supplementary materials included in this article.