Abstract
The class Ic ribonucleotide reductase from Chlamydia trachomatis (Ct) uses a stable Mn(IV)/Fe(III) cofactor to initiate nucleotide reduction by a free-radical mechanism. Extended X-ray absorption fine structure (EXAFS) spectroscopy and density functional theory (DFT) calculations are used to postulate a structure for this cofactor. Fe and Mn K-edge EXAFS data yield an intermetallic distance of ~2.92 Å. The Mn data also suggest the presence of a short 1.74 Å Mn—O bond. These metrics are compared to the results of DFT calculations on 12 cofactor models derived from the crystal structure of the inactive Fe2(III/III) form of the protein. Models are differentiated by the protonation states of their bridging and terminal OHX ligands as well as the location of the Mn(IV) ion (site 1 or 2). The models that agree best with experimental observation feature a µ-1,3-carboxylate bridge (E120), terminal solvent (H2O/OH) to site 1, one µ-O bridge, and one µ-OH bridge. The site-placement of the metal ions cannot be discerned from the available data.
Introduction
A conventional class I (subclass a or b) ribonucleotide reductase (RNR) uses a tyrosyl radical (Y·) in its R2 subunit to initiate nucleotide reduction by a free-radical mechanism. The most recently recognized subclass of class I RNR, Ic, comprises bacterial and archaeal enzymes lacking the radical-harboring tyrosine;1 phenylalanine is found in its place.1,2 We recently showed that the class Ic enzyme from the human pathogen, Chlamydia trachomatis (Ct), uses a stable Mn(IV)/Fe(III) cluster in place of the Y· for radical initiation.3,4 Evidence suggests that the cofactor undergoes reduction of its Mn(IV) site by the R1 subunit4 via the PCET pathway5 that is conserved in all class I(a–c) RNRs.2,6,7 This step yields the Mn(III)/Fe(III) cluster4 and (presumably) the 3′-H-abstracting R1 cysteine radical proposed to form in other RNRs.6,7
Ct R2 is activated when its Mn(II)/Fe(II) cluster reacts with O2 to generate a Mn(IV)/Fe(IV) intermediate that decays by reduction of the Fe site to yield the active Mn(IV)/Fe(III) cofactor.4,8 The cofactor and its oxidized precursor are heterobinuclear homologues of the Fe2(IV/III) complex, X, that generates the Y· in conventional R2 proteins9–12 and the Fe2(IV/IV) complex, Q,13–19 that hydroxylates methane in the reaction of soluble methane monooxygenase.20,21 A remarkable trait of X and Q deduced by extended X-ray absorption fine structure (EXAFS) spectroscopy is a particularly short metal–metal distance of ~2.5 Å.22,23 These short intermetallic distances have proven to be rather enigmatic. They are difficult to replicate by computational modeling,24–32 and relevant synthetic models of X and Q possess significantly longer metal–metal distances (~2.7 Å).33–35 Although these discrepancies have attracted considerable attention, the issue remains unresolved, and questions about the core structures of X and Q linger.31,36–39
Ct R2 holds promise for new insight into the structures of high-valent dinuclear metal clusters. Several characteristics of its Mn/Fe complexes make them uniquely amenable to characterization by EXAFS spectroscopy. The Mn(IV)/Fe(III) complex is stable and, unlike X, can be prepared in nearly pure form (~90%) at high concentration without rapid freeze-quenching. Likewise, the Mn(IV)/Fe(IV) complex is more stable than Q5 and can also be prepared at high concentration by manual freezing. Perhaps most importantly, both complexes have two different metal ions that can be interrogated independently to corroborate the crucial metal–metal distance.
Here we report the use of Fe and Mn K-edge EXAFS spectroscopy to determine defining metrics of the Ct R2 Mn(IV)/Fe(III) cofactor. Comparison of these distances with the results of calculations on cofactor models provides insight into the cluster’s bridging ligation.
Experimental Procedures
Preparation of Mn(IV)/Fe(III)-R2 for X-ray Absorption Spectroscopy Studies
The heterobinuclear nature of the Ct R2 cofactor raises technical issues not previously encountered in investigations of conventional class I R2 proteins. The challenge is to avoid formation of the Fe2(II/II) complex. This complex is quite reactive toward O2, resulting in generation of a stable Fe2(III/III) product that is presumably identical to the crystallographically characterized form of the enzyme (1SYY).1 Formation of the Mn2(II/II) complex can also occur, but this species is labile and does not react with O2. As a result, use of excess Mn(II) does not prevent formation of the active Mn/Fe cofactor. On the basis of these considerations, the following procedure was designed for preparation of nearly pure (85–90%) Ct R2 Mn(IV)/Fe(III) for X-ray absorption spectroscopy (XAS) analysis.
To an air-saturated solution of 370 µM apo R2 (monomer concentration, 100 mM Na-HEPES, pH 7.6, 10% glycerol) at 5 °C, 1.5 equiv of Mn(II) and 5 mM sodium ascorbate (final concentration) were added. Next, an aliquot of 57Fe(II) stock solution containing 0.75 equiv of Fe(II) was added slowly over a period of 20 min with continuous stirring. After 1 h at 5 °C, unbound metal was removed by dialysis against a solution containing 10 mM EDTA, 100 mM Na-HEPES, pH 7.6, and 10% glycerol. Finally EDTA was removed from the protein by dialysis against buffer (100 mM Na-HEPES, pH 7.6, 10% glycerol). Removal of greater than 95% of the free Mn(II) was verified by electron paramagnetic resonance (EPR) spectroscopy. The concentration of glycerol was increased to 45% by exchange with an otherwise identical buffer, and protein was concentrated to ~2 mM (monomer concentration). Mössbauer analysis on this material revealed the presence of ~85–90% of the desired Mn(IV)/Fe(III) complex and 10–15% of the Fe2(III/III) contaminant (Supporting Information Figure S1). Treatment of this form with dithionite resulted in almost the complete (94%) reduction of Mn(IV)/Fe(III) to Mn(III)/Fe(III); see Supporting Information Figure S2.
XAS samples were prepared in modified Mössbauer cups. The bottom of each cup was removed, and the opening was covered with Kapton tape. Protein (~2 mM monomer concentration) was pipetted into the modified cups. Samples were then frozen in an isopentane bath (140 K) and stored in liquid N2 until XAS measurements were performed.
XAS Data Collection and Analysis
XAS data were collected in fluorescence mode at ~10 K with a 30 element germanium detector (SSRL, BL7-3). The Fe/Mn data were collected with a Si(220) ϕ= 0°/90° double-crystal monochromator with a 9.5 keV cutoff for harmonic rejection. To minimize the effects of photoreduction, samples were moved so that an unexposed portion was examined during each set of measurements (exposure time ~15 min/scan). Data sets used for EXAFS analysis were obtained by averaging only first-scan data (15/33 total scans for the Mn/Fe EXAFS).
Background removal was performed with AUTOBK as found in the ATHENA package (Rbkg = 0.7/0.9, k-weight = 3.0, spline range k = 0–11.6/0.5–12.0 Å−1 Mn/Fe).40 EXAFS data were analyzed with the curve-fitting program EXAFSPAK (available at http://www-ssrl.slac.stanford.edu/exafspak.html) using ab initio phases and amplitudes generated with the program FEFF v7.0.41 Raw and Fourier-filtered data sets were fit over the region of k = 1–11.6 Å−1. Both metals were fit with coordination numbers four to seven. Coordination numbers were constrained during fits. All distances and Debye–Waller factors were treated as adjustable parameters. The passive electron reduction factor S0 was adjusted from 0.8–1.0 in increments of 0.1.
Energies were calibrated using the appropriate metal foil. Edge positions were obtained from the first derivative of the data using EXAFSPAK (1.0 eV smoothing, third-order polynomial) and have uncertainties of ~0.3 eV.
Density Functional Theory Calculations
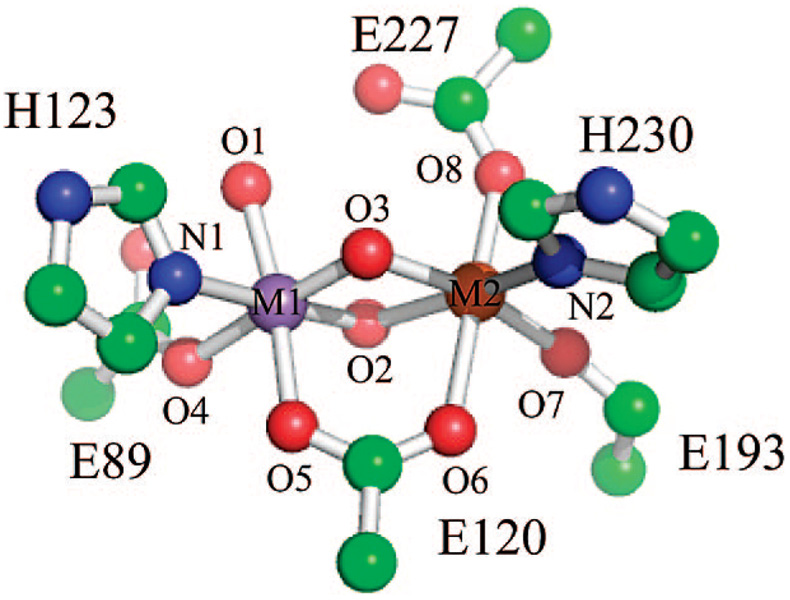
Plausible models for the Mn(IV)/Fe(III) cofactor were examined with density functional theory (DFT) techniques, and their theoretically determined bond distances, 57Fe Mössbauer parameters, and hyperfine tensors were compared with those determined experimentally.3 Cofactor models were derived from the crystal structure of the Fe2(III/III) form of Ct R2 (1SYY).1 Only first-shell amino acids and the two bridging and one terminal OHX ligands (X = 0–2) were retained. The amino acids were simplified such that His and Glu became imidazole and acetate. The protonation states of the oxygen ligands were systematically varied. For each protonation state, both possible placements of the metal ions were considered. We refer to the models by the symbols, AMBC, where M is the metal residing in site 1 (M1 in Figure 1), A represents the number of protons bound to the terminal oxygen ligand at site 1, and B and C represent the number of protons bound to the bridging O-atoms.
Figure 1.
Theoretical Mn(IV)/Fe(III) model derived from 1SYY crystal structure. Hydrogens are not shown.
Geometry optimizations were performed using Gaussian 03 rev. E.01 (G03) at the B3LYP/6-311G* level of theory42 and the Amsterdam density functional package 2007.01 (ADF) at the BP86/TZP level of theory.43 The S = 1 ground state of the Mn(IV)/Fe(III) cofactor, which arises from antiferromagnetic coupling of the SMn = 3/2 and SFe = 5/2 ions, was described using broken-symmetry techniques.44,45
57Fe isomer shifts and quadrupole splittings were determined with the B3LYP (G03) functional employing Neese’s core properties (CP) basis set and parametrization (6-311G* was used for Mn and Ahlrichs VDZ* was used for C, N, O, H).46 An integration grid of 199 radial shells and 590 angular points was used. The electron density at the nucleus was obtained using the Atoms In Molecules (AIM) option.42
Hyperfine coupling constants were determined at optimized geometries. Hyperfine tensors A = AisoI + T were based on computed spin densities, where Aiso is the Fermi contact term and T is the dipolar contribution. In their calculation of hyperfine couplings, both G03 and ADF assume a spin expectation value based on the total spin ST = |SMn − SFe| = 1. Thus, to obtain the intrinsic tensors ai for each site, the values obtained in the calculations were multiplied by ST/Si (2/3 for Mn(IV) and 2/5 for Fe(III)). These ai values were then rescaled by their first-order spin projection coupling coefficients ci to yield the experimentally observable parameter, Ai = ciai.47,48 Because G03 and ADF provide the intrinsic tensors with correct signs, only absolute values of ci are used (i.e., |−3/4| and |7/4| for Mn(IV) and Fe(III), respectively).
To evaluate the accuracy with which DFT can predict binuclear geometries, calculations were performed on two sets of dinuclear complexes. Each of the complexes in the first set (1–3) contains a doubly bridged µ-O/µ-O core, whereas the complexes in the second (4 and 5) are triply bridged. Complexes 4 and 5 contain µ-OR/µ-OR′/µ-1,3-carboxylato and µ-O/µ-O/µ-1,3-carboxylato bridging units, respectively. Complex 1 [(2,2′-bipyridine)2Mn(III)(µ-O)2Mn(IV)(2,2′-bipyridine)2]3+ was prepared by Plaksin et al.49 Complexes 2 [LFe(III)(µ-O)2Fe(IV)L]3+ with L = tris-(5-ethyl-2-pyridylmethyl)amine and 3 [L′Fe(IV)(µ-O)2Fe(IV)L′] with L′ = tris-(3,5-methyl-4-methoxy-2-pyridylmethyl)amine were prepared by Que and co-workers.33–35 Complex 4 [Mn(III)µ-L″µ-(OCH3)µ-1,3-(CH3COO)(OHCH3)Mn(III)]+ with L″ = 1,5-bis(salicylidene-amino)-3-pentanol was prepared by Nishida et al.50 Complex 5 [L″′Mn(IV)(µ-O)2µ-1,3-(CH3COO)Mn(III)L″′]2+ with L″′ = N,N-bis(2-pyridylmethyl)ethylamine was prepared by Pal et al.51 Geometry optimizations of the experimentally determined ground states were performed at the BP86/(TZP or 6-311G*) and B3LYP/6-311G* levels. Antiferromagnetic states were described using broken-symmetry techniques.
Results and Discussion
Mn and Fe K-Edge EXAFS
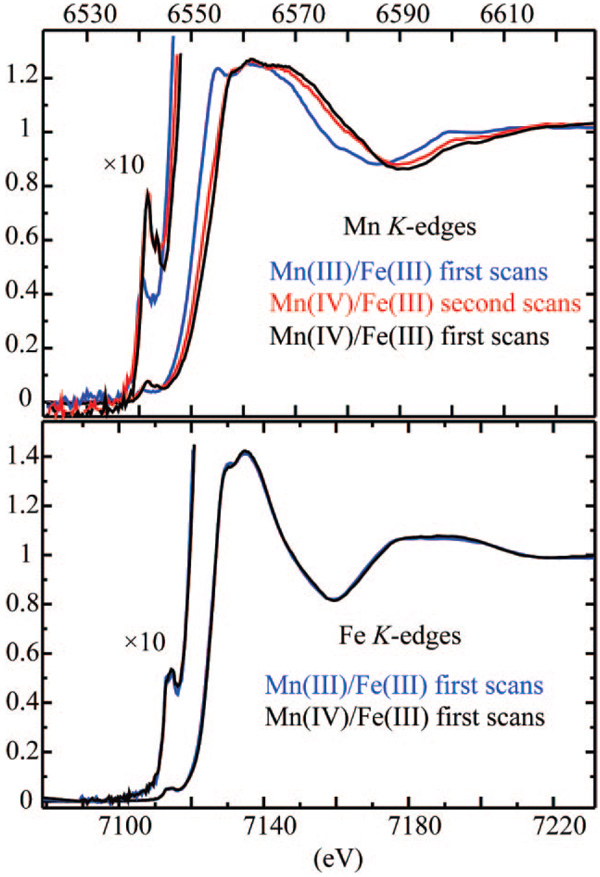
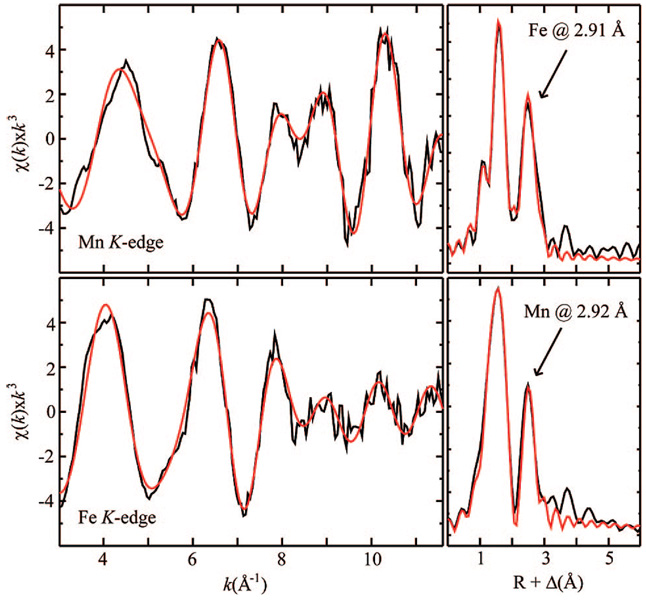
The Mn and Fe K-edge XAS data are shown in Figure 2. The Fourier transforms of the EXAFS data (Figure 3) reveal the presence of significant non-nearest-neighbor scattering interactions. Fits of the data indicate that the large peaks at R + Δ ~ 2.5 Å (Δis typically −0.4 Å) are directly attributable to metal backscattering. EXAFS data were fit to a simple three-shell model, which consisted of (1) a closest shell of bridging or terminal oxygen interactions, (2) a second shell of longer bridging and nonbridging O/N interactions, and (3) a metal scatterer. Both metals were fit with coordination numbers four to seven. Coordination numbers were constrained during fits. All distances and Debye–Waller factors were treated as adjustable parameters. The passive electron reduction factor S0 was adjusted from 0.8 to 1.0 in increments of 0.1. A nearly identical fit was obtained with each reduction factor. The best fits for each reduction factor are summarized in Tables 1 and 2. Table 1 also includes fits performed with a two-shell model. Additional fits can be found in the Supporting Information.
Figure 2.
Mn (top) and Fe (bottom) K-edge absorption edges of the Mn(IV)/Fe(III) and Mn(III)/Fe(III) complexes of Ct R2. First- and second-scan data for the Mn(IV)/Fe(III) state are shown in black and red, respectively, with edge energies of 6555.4 and 6552.6 eV. First-scan data for Mn(III)/Fe(III) is in blue and has an edge energy of 6550.6 eV. Fe edge energies are at 7126.6 eV. 57Fe Mössbauer characterization of the EXAFS samples can be found in the Supporting Information.
Figure 3.
Mn (top) and Fe (bottom) K-edge EXAFS data (left) and Fourier transforms (right) for the Mn(IV)/Fe(III) complex of Ct R2. Arrows designate contributions resulting from metal backscattering.
Table 1.
Mn K-Edge EXAFS Fitting Resultsa
| Mn–O | Mn–O/N | Mn–Fe | |||||||||
|---|---|---|---|---|---|---|---|---|---|---|---|
| S0 | N | R | σ2 | N | R | σ2 | N | R | σ2 | E0 | F |
| 0.8 | 1 | 1.74 | 0.0033 | 4 | 1.95 | 0.0038 | 1 | 2.91 | 0.0014 | −3.8 | 0.237 |
| 0 | 4 | 1.96 | 0.0057 | 1 | 2.92 | 0.0015 | 0.1 | 0.317 | |||
| 0.9 | 1 | 1.73 | 0.0037 | 4 | 1.94 | 0.0047 | 1 | 2.91 | 0.0020 | −4.3 | 0.240 |
| 0 | 4 | 1.96 | 0.0069 | 1 | 2.92 | 0.0021 | −0.3 | 0.337 | |||
| 1.0 | 1 | 1.76 | 0.0053 | 3 | 1.95 | 0.0032 | 1 | 2.91 | 0.0027 | −3.9 | 0.239 |
| 0 | 4 | 1.96 | 0.0081 | 1 | 2.92 | 0.0026 | −0.6 | 0.362 | |||
| range | 1.73–1.76 | 1.94–1.96 | 2.91–.92 | ||||||||
Best three- and two-shell fits for a given S0 are listed. Best overall fit is in bold. Additional fits can be found in the Supporting Information. Metal coordination numbers from four to seven were considered. Fits were performed over the region of k= 1–1.6 Å−1. Coordination number N, interatomic distance R (Å), mean-square deviation in R, σ2 (Å2), and the threshold energy shift E0 (eV) are listed. N was constrained during fits. The fit-error F is defined as (Σk6(χexptl – χcalc)2/Σk6χexptl2)1/2.
Table 2.
Fe K-Edge EXAFS Fitting Resultsa
| Fe–O | Fe–O/N | Fe–Mn | |||||||||
|---|---|---|---|---|---|---|---|---|---|---|---|
| S0 | N | R | σ2 | N | R | σ2 | N | R | σ2 | E0 | F |
| 0.8 | 5 | 1.96 | 0.0062 | 2 | 2.11 | 0.0011 | 1 | 2.92 | 0.0034 | −4.4 | 0.241 |
| 0.9 | 5 | 1.96 | 0.0081 | 2 | 2.11 | 0.0028 | 1 | 2.92 | 0.0043 | −5.2 | 0.238 |
| 1.0 | 4 | 1.96 | 0.0068 | 2 | 2.11 | 0.0027 | 1 | 2.92 | 0.0048 | −4.5 | 0.231 |
| range | 1.96 | 2.11 | 2.92 | ||||||||
Best fit for a given S0 is listed. Best overall fit is in bold. Additional fits can be found in the Supporting Information. Metal coordination numbers from four to seven were considered. Fits were performed over the region of k = 1–11.6 Å−1. Coordination number N, interatomic distance R (Å), mean-square deviation in R, σ2 (Å2), and the threshold energy shift E0 (eV) are listed. N was constrained during fits. The fit-error F is defined as (Σk6(χexptl – χcalc)2/Σk6χexptl2)1/2.
The best fit of the unfiltered Mn EXAFS data yields a Mn–Fe distance of 2.91 Å, four O/N scatterers at 1.95 Å, and a single O scatterer at 1.74 Å. Inclusion of the short Mn–O interaction improves the fit quality by 25%. Fits of the Fe EXAFS provide a metal–metal distance of 2.92 Å, in good agreement with the Mn data. Fits of the Fe data also indicate the presence of four O/N atoms at 1.96 Å and two O/N atoms at 2.11 Å. A short Fe–O interaction is not required to fit the Fe data.
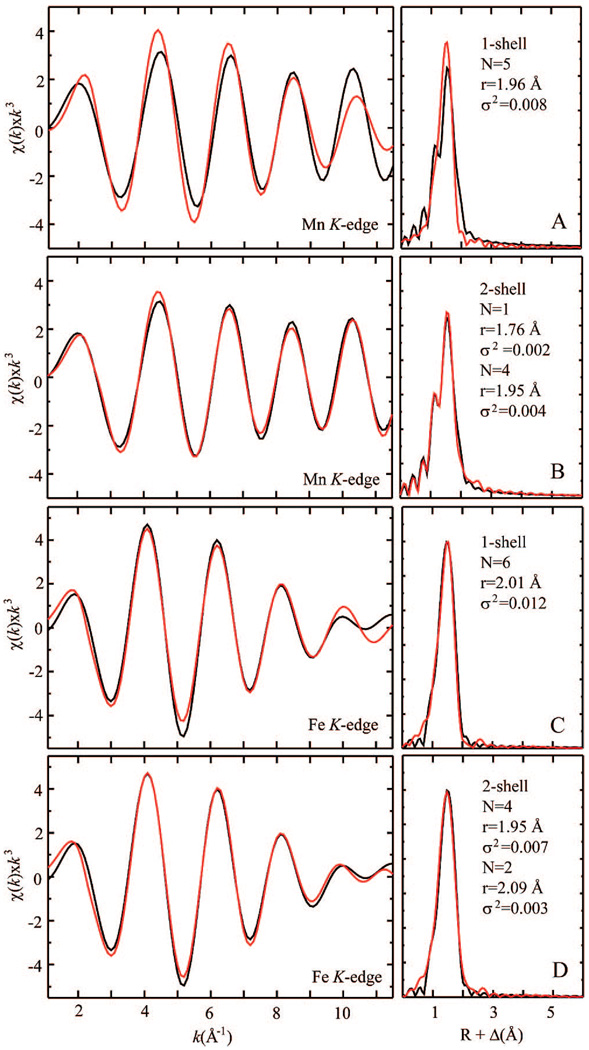
The need for a short Mn–O scattering path is highlighted by an analysis of the Fourier-filtered first-shell data (Figure 4). Whereas the Fe data can be fit reasonably well with only a single set of O/N scatterers (panels C and D), the Mn data cannot. Inclusion of a short 1.76 Å Mn–O interaction results in a substantial improvement in the fit of the Fourier-filtered data.
Figure 4.
Fits of the Fourier-filtered first-shell data for the Mn (A and B) and Fe (C and D) sites of the Ct R2 Mn(IV)/Fe(III) cofactor. Panels A and C display fits obtained with a single set of scatters. Panels B and D show fits obtained with a two-shell model. Details of these and additional fits can be found in the Supporting Information.
Photoreduction of the Mn(IV)/Fe(III) Complex
Photoreduction is a general concern when synchrotron radiation is used to examine high-valent metalloproteins.52,53 In this section we examine the degree to which our Mn(IV)/Fe(III) samples were photoreduced and analyze the effect that this reduction had on EXAFS-determined metrics.
Comparison of the first and second scans of the Mn(IV)/Fe(III) samples reveals that the Mn edge shifted to lower energy during the time required to obtain the first scan. This shift is indicative of photoreduction. To determine the amount of reduction that occurred, the second scan of the Mn(IV)/Fe(III) sample was fit to a linear combination of the first scans of the Mn(IV)/Fe(III) and Mn(III)/Fe(III) states. The best fit indicates that the Mn(IV)/Fe(III) complex was reduced by ~27% during the first scan (Supporting Information).
To assess the effects of photoreduction on the EXAFS-determined metrics, a smaller Mn data set was examined. This set, which contained first-scan data from k = 3.5–8.0 Å−1, had 42% of the full-scan exposure time and (assuming photoreduction varies linearly with exposure time) was only 11% reduced by k = 8.0 Å−1. In agreement with the full-scan data, this smaller set yields a metal–metal distance of 2.92 Å and a set of four O/N scatters at 1.95 Å. This result suggests that the metrics determined from the full-scan data are representative of the Mn(IV)/Fe(III) state (a short Mn–O scatter was not included in the fit, as the expected resolution over this k range is 0.35 Å).
DFT Calculations on Inorganic Complexes Relevant to the Ct R2 Cofactor
The emerging approach to the structural characterization of metalloprotein intermediates that this study exemplifies involves (1) generation of a series of simplified models for the intermediate by DFT calculations, (2) prediction of spectroscopic parameters for the models, (3) selection of the model (or set of similar models) exhibiting the best agreement between the predicted and experimentally measured parameters as the most likely structure(s) for the intermediate. The success of this approach is dependent on the accuracy of the calculated structural and spectroscopic parameters.48,54,55 To evaluate the accuracy with which DFT can predict binuclear structures, we examined Mn and Fe complexes relevant to the Ct R2 cofactor.
In the absence of a structurally characterized high-valent Mn/Fe complex, we selected the high-valent Mn2(III/IV) complex 1 prepared by Plaksin et al.,49 the Fe2(III/IV)33,34 complex 2 and Fe2(IV/IV)35 complex 3 recently prepared by Que and coworkers, the Mn2(III/III) complex 4 prepared by Nishida et al.,50 and the Mn2(III/IV) complex 5 prepared by Pal et al.51 for method validation (Supporting Information Figure S4). Calculations on these complexes were performed at the B3LYP/6-311G* and BP86/(TZP or 6-311G*) levels. These calculations predicted metal–metal and metal–oxygen distances for these complexes to within 0.06 Å of the crystallographically obtained values, the average error being 0.03 Å for the metal–metal distance and 0.02 Å for metal–oxygen distances (Supporting Information). The results of these calculations confirm that accurate binuclear geometries can be obtained with the appropriate basis set and functional.
Calculation of Models for the Mn(IV)/Fe(III) Cofactor by DFT
Cofactor models were derived from the crystal structure (1SYY) of the inactive diiron form of the protein.1 The metal cluster in this structure is different from those in other structurally characterized R2 proteins and related diiron–carboxylate proteins in that it has one bridging carboxylate and two OHX bridges (assigned as X = 1 or 2). A review of the relevant literature concerning homobinuclear Mn and Fe compounds suggests that similar ligation can produce the metal–metal distance observed for the Mn(IV)/Fe(III) complex. A binuclear Mn2(III/III) system 4 with an intermetallic distance of 2.93 Å has been reported.50 It has three bridging ligands: two alkoxides and an acetate ion. A similar coordination scheme is found in a polynuclear Fe(III) compound and yields an intermetallic distance of 3.01 Å.56
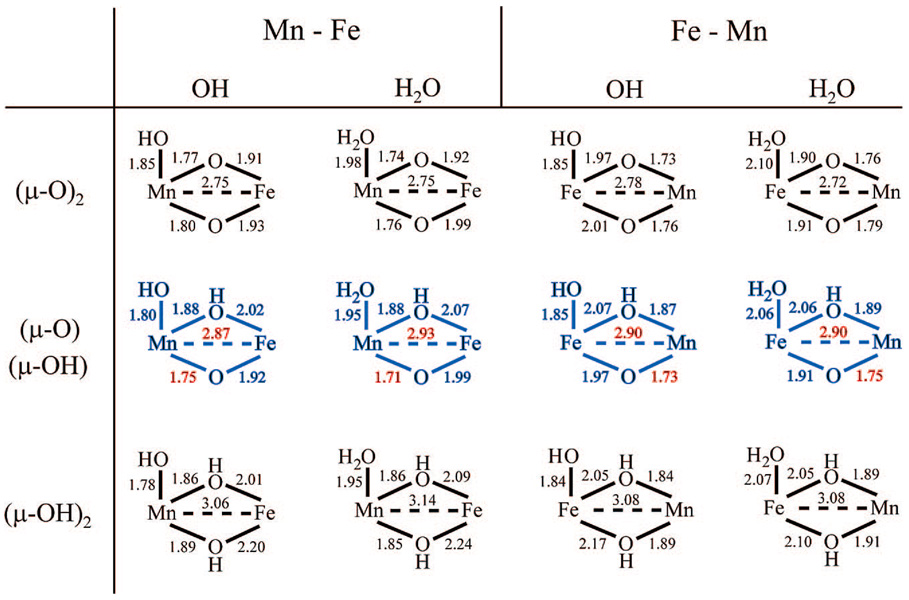
Systematic variation of the protonation states of the terminal and bridging oxygen ligands of 1SYY as well as the metal ion occupying site 1 generated a series of 12 models for the Ct R2 cofactor. Salient features of the calculated core structures are summarized in Figure 5, which shows the B3LYP/6-311G* optimized geometries (similar results were obtained at the BP86/TZP level, Supporting Information Figure S6). The most obvious insight comes from the variation of the metal–metal distance with the nature of the bridging oxygen ligands. Assumption of two µ-oxo ligands (models AM00) gave Mn–Fe distances (2.69–2.78 Å) significantly less than that measured by EXAFS. Conversely, assumption of two µ-hydroxo bridges (models AM11) gave metal–metal distances (3.03–3.14 Å) significantly greater than the experimentally determined Mn–Fe distance. Only models with a µ-oxo/µ-hydroxo/µ-1,3-carboxylato core (models AM10) gave Mn–Fe distances (2.83–2.93 Å) and a single short Mn–O interaction (1.71–1.77 Å) consistent with the EXAFS measurements. The calculated bridging iron–oxo bond distances for the AM10 complexes (1.89–1.99 Å) are also consistent with EXAFS measurements and similar to the long 1.92ÅFe-µ-O distancefoundinFe2(III/III)(µ-O)2(6-Me3-TPA)2.57,58
Figure 5.
Selected core bond lengths, in Å, for the B3LYP/6-311G*-optimized Ct R2 cofactor models (µ-1,3-carboxylate bridge is omitted for clarity). Structures containing metal–metal and Mn–O distances consistent with EXAFS measurements are shown in blue (metal–metal and Mn–O distances are in red). Similar results were obtained at the BP86/TZP level (Supporting Information).
Conclusions
In summary, EXAFS analysis of the Mn(IV)/Fe(III) complex of Ct R2 indicates a 2.92 Å metal–metal distance and a short 1.74 Å Mn–O interaction. Computational results suggest that these measurements are consistent with a µ-oxo/µ-hydroxo/µ-carboxylato core. Our working model for the Ct R2 cofactor has a µ-1,3-carboxylate bridge from E120, µ-oxo and µ-hydroxo bridges, and a terminal water/hydroxide ligand to the metal in site 1. The µ-oxo bridge is asymmetric resulting in a 1.74 Å Mn–O bond. The metal ion occupying site 1 cannot be determined from available data.
Supplementary Material
Acknowledgment
We thank Matthew Latimer, Allyson Aranda, Erik Nelson, Serena DeBeer-George, and other SSRL staff members for assistance with the XAS measurements. This work was supported by the National Institutes of Health (GM-55365 to J.M.B, C.K., and M.T.G.), the Beckman Foundation (Young Investigator Awards to C.K. and M.T.G.). J.M.Y. is a PSU AcademicComputingFellow.C.K.isaCamilleDreyfusTeacher–Scholar. M.T.G. is an Alfred P. Sloan Fellow.
Footnotes
Supporting Information Available: Mössbauer spectra of the XAS samples, EXAFS fits, Fourier-filtered data, photoreduction analysis, selected bond distances from optimized geometries, optimized geometries, calculated 57Fe Mössbauer and hyperfine parameters, and complete ref 42. This material is available free of charge via the Internet at http://pubs.acs.org.
References
- 1.Högbom M, Stenmark P, Voevodskaya N, McClarty G, Gräslund A, Nordlund P. Science. 2004;305:245–248. doi: 10.1126/science.1098419. [DOI] [PubMed] [Google Scholar]
- 2.Roshick C, Iliffe-Lee ER, McClarty G. J. Biol. Chem. 2000;275:38111–38119. doi: 10.1074/jbc.M006367200. [DOI] [PubMed] [Google Scholar]
- 3.Jiang W, Bollinger JM, Jr, Krebs C. J. Am. Chem. Soc. 2007;129:7504–7505. doi: 10.1021/ja072528a. [DOI] [PMC free article] [PubMed] [Google Scholar]
- 4.Jiang W, Yun D, Saleh L, Barr EW, Xing G, Hoffart LM, Maslak M-A, Krebs C, Bollinger JM., Jr Science. 2007;316:1188–1191. doi: 10.1126/science.1141179. [DOI] [PubMed] [Google Scholar]
- 5.Jiang W, Saleh L, Barr EW, Xie J, Gardner MM, Krebs C, Bollinger JM., Jr Biochemistry. 2008;47:8477–8484. doi: 10.1021/bi800881m. [DOI] [PMC free article] [PubMed] [Google Scholar]
- 6.Stubbe J, Nocera DG, Yee CS, Chang MCY. Chem. Rev. 2003;103:2167–2201. doi: 10.1021/cr020421u. [DOI] [PubMed] [Google Scholar]
- 7.Stubbe J. Curr. Opin. Chem. Biol. 2003;7:183–188. doi: 10.1016/s1367-5931(03)00025-5. [DOI] [PubMed] [Google Scholar]
- 8.Jiang W, Hoffart LM, Krebs C, Bollinger JM., Jr Biochemistry. 2007;46:8709–8716. doi: 10.1021/bi700906g. [DOI] [PMC free article] [PubMed] [Google Scholar]
- 9.Bollinger JM, Jr, Edmondson DE, Huynh BH, Filley J, Norton JR, Stubbe J. Science. 1991;253:292–298. doi: 10.1126/science.1650033. [DOI] [PubMed] [Google Scholar]
- 10.Bollinger JM, Jr, Stubbe J, Huynh BH, Edmondson DE. J. Am. Chem. Soc. 1991;113:6289–6291. [Google Scholar]
- 11.Ravi N, Bollinger JM, Jr, Huynh BH, Edmondson DE, Stubbe J. J. Am. Chem. Soc. 1994;116:8007–8014. [Google Scholar]
- 12.Bollinger JM, Jr, Tong WH, Ravi N, Huynh BH, Edmondson DE, Stubbe J. J. Am. Chem. Soc. 1994;116:8015–8032. [Google Scholar]
- 13.Lee S-K, Fox BG, Froland WA, Lipscomb JD, Münck E. J. Am. Chem. Soc. 1993;115:6450–6451. [Google Scholar]
- 14.Lee S-K, Nesheim JC, Lipscomb JD. J. Biol. Chem. 1993;268:21569–21577. [PubMed] [Google Scholar]
- 15.Liu KE, Valentine AM, Wang D, Huynh BH, Edmondson DE, Salifoglou A, Lippard SJ. J. Am. Chem. Soc. 1995;117:10174–10185. [Google Scholar]
- 16.Liu KE, Wang D, Huynh BH, Edmondson DE, Salifoglou A, Lippard SJ. J. Am. Chem. Soc. 1994;116:7465–7466. [Google Scholar]
- 17.Hanson RS, Hanson TE. Microbiol. Rev. 1996;60:439–471. doi: 10.1128/mr.60.2.439-471.1996. [DOI] [PMC free article] [PubMed] [Google Scholar]
- 18.Lipscomb JD. Annu. Rev. Microbiol. 1994;48:371–399. doi: 10.1146/annurev.mi.48.100194.002103. [DOI] [PubMed] [Google Scholar]
- 19.Liu KE, Lippard SJ. Adv. Inorg. Chem. 1995;42:263–289. [Google Scholar]
- 20.Nesheim JC, Lipscomb JD. Biochemistry. 1996;35:10240–10247. doi: 10.1021/bi960596w. [DOI] [PubMed] [Google Scholar]
- 21.Valentine AM, Stahl SS, Lippard SJ. J. Am. Chem. Soc. 1999;121:3876–3887. [Google Scholar]
- 22.Riggs-Gelasco PJ, Shu L, Chen S, Burdi D, Huynh BH, Que L, Jr, Stubbe J. J. Am. Chem. Soc. 1998;120:849–860. [Google Scholar]
- 23.Shu L, Nesheim JC, Kauffmann K, Münck E, Lipscomb JD, Que L., Jr Science. 1997;275:515–518. doi: 10.1126/science.275.5299.515. [DOI] [PubMed] [Google Scholar]
- 24.Han W-G, Lovell T, Lui T, Noodleman L. Inorg. Chem. 2003;42:2751–2758. doi: 10.1021/ic020465l. [DOI] [PubMed] [Google Scholar]
- 25.Gherman BF, Dunietz BD, Whittington DA, Lippard SJ, Friesner RA. J. Am. Chem. Soc. 2001;123:3836–3837. doi: 10.1021/ja0055108. [DOI] [PubMed] [Google Scholar]
- 26.Dunietz BD, Beachy MD, Cao Y, Whittington DA, Lippard SJ, Friesner RA. J. Am. Chem. Soc. 2000;122:2828–2839. [Google Scholar]
- 27.Siegbahn PEM. Inorg. Chem. 1999;38:2880–2889. doi: 10.1021/ic981332w. [DOI] [PubMed] [Google Scholar]
- 28.Han W-G, Liu T, Lovell T, Noodleman L. J. Am. Chem. Soc. 2005;127:15778–15790. doi: 10.1021/ja050904q. [DOI] [PubMed] [Google Scholar]
- 29.Han W-G, Lui T, Lovell T, Noodleman L. Inorg. Chem. 2006;45:8533–8542. doi: 10.1021/ic060566+. [DOI] [PubMed] [Google Scholar]
- 30.Lovell T, Han W-G, Liu T, Noodleman L. J. Am. Chem. Soc. 2002;124:5890–5894. doi: 10.1021/ja0121282. [DOI] [PubMed] [Google Scholar]
- 31.Han W-G, Liu T, Lovell T, Noodleman L. J. Inorg. Biochem. 2006;100:771–779. doi: 10.1016/j.jinorgbio.2006.01.032. [DOI] [PubMed] [Google Scholar]
- 32.Gherman BF, Baik M-H, Lippard SJ, Friesner RA. J. Am. Chem. Soc. 2004;126:2978–2990. doi: 10.1021/ja036506+. [DOI] [PubMed] [Google Scholar]
- 33.Dong Y, Fujii H, Hendrich MP, Leising RA, Pan G, Randall CR, Wilkinson EC, Zang Y, Que L, Jr, Fox BG, Kauffmann K, Münck E. J. Am. Chem. Soc. 1995;117:2778–2792. [Google Scholar]
- 34.Hsu H-F, Dong Y, Shu L, Young VG, Jr, Que L., Jr J. Am. Chem. Soc. 1999;121:5230–5237. [Google Scholar]
- 35.Xue G, Wang D, De Hont R, Fiedler AT, Shan X, Münck E, Que L., Jr Proc. Natl. Acad. Sci. U.S.A. 2007;104:20713–20718. doi: 10.1073/pnas.0708516105. [DOI] [PMC free article] [PubMed] [Google Scholar]
- 36.Burdi D, Willems J-P, Riggs-Gelasco P, Antholine WE, Stubbe J, Hoffman BM. J. Am. Chem. Soc. 1998;120:12910–12919. [Google Scholar]
- 37.Mitić N, Clay MD, Saleh L, Bollinger JM, Jr, Solomon EI. J. Am. Chem. Soc. 2007;129:9049–9065. doi: 10.1021/ja070909i. [DOI] [PMC free article] [PubMed] [Google Scholar]
- 38.Skulan AJ, Hanson MA, Hsu H-f, Que L, Jr, Solomon EI. J. Am. Chem. Soc. 2003;125:7344–7356. doi: 10.1021/ja021137n. [DOI] [PubMed] [Google Scholar]
- 39.Willems J-P, Lee H-I, Burdi D, Doan PE, Stubbe J, Hoffman BM. J. Am. Chem. Soc. 1997;119:9816–9824. [Google Scholar]
- 40.Ravel B, Newville M. J. Synchrotron Radiat. 2005;12:537–541. doi: 10.1107/S0909049505012719. [DOI] [PubMed] [Google Scholar]
- 41.Ankoudinov AL. Relativistic Spin-Dependent X-ray Absorption Theory. Seattle, WA: University of Washington; 1996. [Google Scholar]
- 42.Gaussian 03, revision E.01. Pittsburgh, PA: Gaussian, Inc.; 2003. [Google Scholar]
- 43.te Velde G, Bickelhaupt FM, Baerends EJ, Guerra CF, van Gisbergen SJA, Snijders JG, Ziegler T. J. Comput. Chem. 2001;22:931–967. [Google Scholar]
- 44.Noodleman L. J. Chem. Phys. 1981;74:5737–5743. [Google Scholar]
- 45.Yamaguchi K, Jensen F, Dorigo A, Houk KN. Chem. Phys. Lett. 1988;149:537–542. [Google Scholar]
- 46.Neese F. Inorg. Chim. Acta. 2002;337:181–192. [Google Scholar]
- 47.Bencini A, Gatteschi D. EPR of Exchange Coupled Systems. Berlin, Germany: Springer; 1990. [Google Scholar]
- 48.Sinnecker S, Neese F, Noodleman L, Lubitz W. J. Am. Chem. Soc. 2004;126:2613–2622. doi: 10.1021/ja0390202. [DOI] [PubMed] [Google Scholar]
- 49.Plaksin PM, Stoufer RC, Mathew M, Palenik GJ. J. Am. Chem. Soc. 1972;94:2121–2222. [Google Scholar]
- 50.Nishida Y, Oshino N, Tokii T. Z. Naturforsch. 1988;43b:472–474. [Google Scholar]
- 51.Pal S, Olmstead MM, Armstrong WH. Inorg. Chem. 1995;34:4708–4715. [Google Scholar]
- 52.Green MT. J. Am. Chem. Soc. 2006;128:1902–1906. doi: 10.1021/ja054074s. [DOI] [PubMed] [Google Scholar]
- 53.Corbett MC, Latimer MJ, Poulos TL, Sevrioukova IF, Hodgson KO, Hedman B. Acta Crystallogr., Sect. D. 2007;63:951–960. doi: 10.1107/S0907444907035160. [DOI] [PubMed] [Google Scholar]
- 54.Sproviero EM, Gascon JA, McEvoy JP, Brudvig GW, Batista VS. J. Inorg. Biochem. 2006;100:786–800. doi: 10.1016/j.jinorgbio.2006.01.017. [DOI] [PubMed] [Google Scholar]
- 55.Slep LD, Mijovilovich A, Meyer-Klaucke W, Weyhermüller T, Bill E, Bothe E, Neese F, Wieghardt K. J. Am. Chem. Soc. 2003;125:15554–15570. doi: 10.1021/ja030377f. [DOI] [PubMed] [Google Scholar]
- 56.Taft KL, Delfs CD, Papaefthymiou GC, Foner S, Gatteschi D, Lippard SJ. J. Am. Chem. Soc. 1994;116:823–832. [Google Scholar]
- 57.Zang Y, Dong Y, Que L, Jr, Kauffmann K, Münck E. J. Am. Chem. Soc. 1995;117:1169–1170. [Google Scholar]
- 58.Zheng H, Zang Y, Dong Y, Young VG, Jr, Que L., Jr J. Am. Chem. Soc. 1999;121:2226–2235. [Google Scholar]
Associated Data
This section collects any data citations, data availability statements, or supplementary materials included in this article.


