

Significance
How proteins fold is a fundamental problem in molecular biology and has been the subject of intense study. Membrane protein folding is a particularly thorny challenge because the proteins reside in a complex, nonhomogenous bilayer. As the bilayer has a powerful influence on their structure and stability, new approaches are needed to study folding in their natural environment. Here we describe an approach for driving reversible unfolding of a large membrane protein, which does not require alteration of the environmental properties. Our method therefore provides a general tool to examine the folding of membrane proteins.
Keywords: membrane protein folding, steric trap
Abstract
The thermodynamic stability of proteins is typically measured at high denaturant concentrations and then extrapolated back to zero denaturant conditions to obtain unfolding free energies under native conditions. For membrane proteins, the extrapolations are fraught with considerable uncertainty as the denaturants may have complex effects on the membrane or micellar structure. We therefore sought to measure stability under native conditions, using a method that does not perturb the properties of the membrane or membrane mimetics. We use a technique called steric trapping to measure the thermodynamic stability of bacteriorhodopsin in bicelles and micelles. We find that bacteriorhodopsin has a high thermodynamic stability, with an unfolding free energy of ∼11 kcal/mol in dimyristoyl phosphatidylcholine bicelles. Nevertheless, the stability is much lower than predicted by extrapolation of measurements made at high denaturant concentrations. We investigated the discrepancy and found that unfolding free energy is not linear with denaturant concentration. Apparently, long extrapolations of helical membrane protein unfolding free energies must be treated with caution. Steric trapping, however, provides a method for making these measurements.
Methods to measure the thermodynamic stability of membrane proteins have largely followed methods developed for soluble protein folding (1). The fraction unfolded is first measured as a function of denaturant concentration (urea, guanidine-HCl, etc.), which in turn provides the unfolding free energy (ΔGU) as a function of denaturant. The fraction unfolded, however, can be accurately measured only at high denaturant concentration, where the amount of unfolded protein is large enough—the so-called transition zone. Thus, obtaining a measure of the unfolding free energy in the absence of denaturant requires extrapolation from the transition zone. For chemical denaturation, the unfolding free energy is typically linearly dependent on the denaturant concentration in the transition zone, allowing a linear extrapolation back to zero denaturant. However, although there is now considerable experimental and theoretical validation of this approach for soluble proteins (2–4), the validity of these extrapolations is not clear for measuring stability of membrane proteins.
Since the observation of Braiman et al. that bacteriorhodopsin (bR) can be refolded from an SDS-denatured state (5), SDS has been commonly used to study the folding of helical membrane proteins. The Booth laboratory has pioneered and extensively studied the refolding kinetics of bR from an SDS-denatured state (6–8). We introduced SDS unfolding to measure the thermodynamic stability of the membrane enzyme diacylglycerol kinase (9) and a similar approach can be used to measure bR thermodynamic stability (10, 11). bR contains a covalently bound retinal chromophore that complicates unfolding analysis because it can slowly hydrolyze off in the SDS unfolded protein (12). We and others originally measured an apparent equilibrium between the folded bR (bRF) and the unfolded protein with the intact chromophore (bRU) (7, 13). We recently determined, however, that the rate of refolding in the transition zone was too slow compared with the retinal hydrolysis rate to obtain a true equilibrium (10). Instead, a reliable measure of thermodynamic stability can be obtained by measuring the equilibrium between bRF and the unfolded protein without the retinal (Ret) chromophore, bOU. The overall reaction is given by bRF
 bOU + Ret. ΔGU values obtained in the transition zone of SDS unfolding curves are linear with SDS mole fraction (XSDS), but how far the linear free energy relationship extends beyond the transition zone is unknown.
Therefore, we have developed an alternative approach for measuring protein stability, called steric trapping, which does not require the use of denaturants. The method has already been used to measure the unfolding free energy of the soluble protein dihydrofolate reductase (14) and to measure the dimerization affinity of the glycophorin A transmembrane helix in detergents and bilayers (15, 16). In this work, we sought to expand the steric trapping method to bacteriorhodopsin (bR), a large, helical membrane protein.
The steric trapping approach is outlined in Fig. 1. Two biotin tags are placed on the protein at residues that are close in space, but distant in the linear sequence. Added monovalent streptavidin (mSA) can bind to one of the biotin tags, but if the biotin labels are too close, the second mSA is prevented from binding by steric overlap. Only when the protein unfolds can the second mSA bind, trapping the protein in the unfolded state. Thus, the first binding event is high affinity, reflecting the intrinsic affinity of mSA for biotin (ΔGB), and the second binding event is lower affinity as it is coupled to the unfolding free energy (ΔGB + ΔGU). Equilibrium unfolding is thereby driven by mSA affinity and concentration. The ΔGU of the protein of interest can therefore be obtained from mSA-binding isotherms.
Fig. 1.
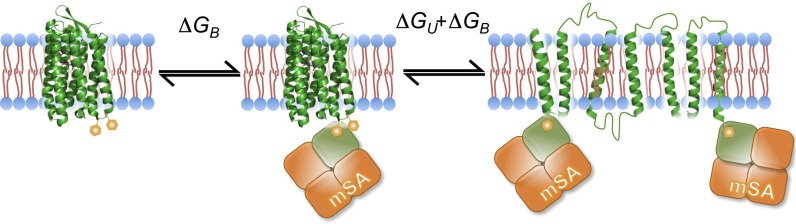
The steric trapping method. The target protein is labeled with two biotin tags (orange hexagon) at positions that are close in space. The first monovalent streptavidin (mSA) can bind freely to the target protein with its intrinsic affinity ΔGB. If the tags are appropriately placed, the second mSA can bind only when the target protein is unfolded due to steric overlap. Therefore, the apparent binding affinity includes the unfolding free energy, ΔGU. This is a simplification of the overall equilibrium. See Materials and Methods for a more complete description.
Because the steric trapping method does not require the addition of denaturants, it has now allowed us to measure unfolding free energy of bR over a range of conditions inaccessible to standard unfolding curves. We find that unfolding free energy is decidedly not linear with concentration at low SDS concentrations, making extensive extrapolations from the transition zone invalid. Our results show that steric trapping can provide thermodynamic stability measurements for large membrane proteins under native conditions.
Results and Discussion
bR Biotinylation.
A double cysteine mutation of bR, D36C/F230C, was generated so that biotin labels could be introduced using a thiol-reactive biotin tag N-(biotinoyl)-N′-(iodoacetyl)ethylenediamine (BE). The two chosen sites, shown in Fig. 2A, are located near the C terminus and in the loop between helices A and B. The labeling efficiency could be estimated by an SDS/PAGE-based gel-shift assay (Fig. 2B) because mSA remains folded and retains binding activity in SDS (17). In the presence of mSA, bands are seen for unbound, singly bound, and doubly bound forms, corresponding to unlabeled (D36C/F230C-bR), singly labeled (bR-BE1), and doubly labeled (bR-BE2) species. From the band intensities, ∼30% is doubly labeled bR-BE2 so that only 30% of the protein could be subject to unfolding by the steric trap.
Fig. 2.

Biotinylation. (A) The positions of unique cysteines (shown in red) available for labeling on bR mutant D36C/F230C. The chemical structure of the labeling reagent, BE, is also shown. (B) SDS/PAGE-based gel shift assay to assess labeling efficiency. Lane 1 (Label Rxn): bR-D36C/F23C after the labeling reaction. Lane 2 (Label Rxn + mSA): The protein in lane 1 after the addition of mSA. Lane 3 (WT-bR): Wild-type bR. Lane 4 (WT-bR + mSA): Wild-type bR after the addition of mSA. The positions of the unbound protein (D36C/F230C or bR), mSA, the singly bound protein (bR-BE1 + mSA), and the doubly bound protein (bR-BE2 + mSA) are shown.
Steric Trap Unfolding.
To test whether mSA binding could trap bR-BE2 in an unfolded state, we first completely unfolded bR-BE2 at 0.8 XSDS to ensure that mSA can readily access both biotinylation sites. We then added mSA and subsequently diluted it into folding conditions (0.21 XSDS). After overnight incubation, the extent of refolding was assessed by retinal absorbance at 560 nm, corresponding to folded bR. The peak intensity decreases with increasing mSA (Fig. S1), indicating that mSA binding can trap unfolded bR-BE2.
Even at a saturating concentration of mSA, there remains a residual retinal peak in the absorbance spectrum, indicating that not all of the protein is completely unfolded (Fig. 3A). The peak intensity decrease is ∼30% of the total intensity at 560 nm, which is consistent with the amount of bR-BE2 in the labeling reaction (as seen by the SDS/PAGE gel above). Thus, the residual absorbance is most likely due to the presence of singly labeled and unlabeled proteins (bR-BE1 and D36C/F230C-bR) that cannot be trapped by mSA binding. Nevertheless, we also considered the possibility that the doubly mSA-bound protein is only partially destabilized so that some fraction remains folded. To test this possibility, we performed an SDS titration on the residual absorbance peak. We reasoned that the unlabeled or singly labeled protein in the presence of a high concentration of mSA should have a similar SDS unfolding curve to that of the D36C/F230C-bR in the absence of mSA, whereas doubly bound bR should be dramatically destabilized, shifting the unfolding transition zone to a lower SDS concentration. As shown in Fig. S2, the unfolding curves monitoring either the loss of the residual retinal peak absorbance or the retinal absorbance of D36C/F230C-bR in the absence of mSA are the same. This result is consistent with our expectation that the residual intensity comes from the unlabeled and singly labeled bR present in the sample. Moreover, these results indicate that singly bound mSA does not affect bR stability.
Fig. 3.

Steric trapping leads to reversible loss of retinal absorbance. (A) The spectra of the BE-labeled bR-D36C/F230C alone (bR-BE2 alone, black solid line) and in the presence of saturating concentrations of E44Q/S45A-mSA (∼30–40 μM) (bR-BE2 + mSA, black dotted line) are shown. To test reversibility, excess free biotin (5 mM) was added to the bR-BE2 + mSA sample and the spectrum was recorded after a further 1-d incubation (bR-BE2 + mSA + biotin, red dashed line). (B) Representative forward and reverse binding curves at 0.3 XSDS. The solid lines in the plot are the fitting results using Eq. 6.
We further investigated whether the sterically trapped, doubly mSA-bound bR was unfolded by using the pulse proteolysis method developed by Park and coworkers (18). Folded bR is much less susceptible to proteolysis than SDS-unfolded bR. We therefore asked whether sterically trapped bR was more susceptible to proteolysis. Fig. S3 A and B shows the rates of proteolysis of folded bR and SDS-unfolded bR as analyzed by SDS/PAGE. The SDS-unfolded bR is almost completely digested in 3 min under the conditions used, whereas much of the folded bR remains intact after 15 min of digestion. These results serve as references for comparing the proteolysis rate of the sterically trapped bR.
We next examined the rate of proteolysis for (i) bR-BE2 that had been unfolded by steric trapping with mSA and (ii) bR-BE2 immediately after the addition of mSA, but given insufficient time to unfold before the addition of protease. As shown in Fig. 4A, the bR-BE2 sample given insufficient time to unfold digests at a rate similar to that of folded bR, but the sterically trapped unfolded bR-BE2 is almost completely digested in less than 5 min, much like SDS-unfolded bR (Fig. 4B and Figs. S3 and S4). The increased susceptibility to proteolysis, combined with the loss of the 560-nm absorbance peak upon the addition of mSA, indicates that the steric trapping approach can unfold a large membrane protein.
Fig. 4.

bR-BE2 unfolded structure probed by pulse proteolysis assay. (A) Time course of subtilisin digestion of folded bR-BE2 in the presence of WT-mSA. In the pathway to the unfolded state, the protein becomes doubly bound in the native state, followed by slower unfolding of this strained folded state. Thus, to observe proteolysis in the native state, digestions were started 10 min after the addition of WT-mSA, before the protein had time to unfold. The band corresponding to bR-BE2 with two bound mSAs is highlighted by the red box. The band is still present after 15 min of digestion. (B) Time course of subtilisin digestion of steric trap unfolded bR-BE2. Digestions were started 1 d after the addition of WT-mSA to allow time to unfold. The steric trapped unfolded bR-BE2 was digested completely within 3–5 min.
Steric Trapping Yields Unfolding Free Energies.
To obtain true thermodynamic stability measurements, it is essential that the system is reversible. As an initial test of the extent of reversibility, we added an excess of free biotin to competitively remove bound mSA from sterically trapped bR-BE2. A mutant of mSA (E44Q/S45A) with a reduced biotin-binding affinity (15) was used in the experiments due to its faster off rate. As shown in Fig. 3A (red dashed line), the intensity of the retinal signal can be completely restored after steric trap unfolding, which indicates that steric trap unfolding is reversible.
We next tested mSA-binding/unfolding isotherms at low SDS concentrations so that we could conveniently examine reversibility by testing whether the same ΔGU values were obtained starting from the folded state or starting from an unfolded state. Fig. 3B shows typical binding curves for E44Q/S45A-mSA binding to bR-BE2 at 0.3 XSDS, either starting from high SDS and diluting to 0.3 XSDS or simply using 0.3 XSDS as the starting condition. We used the reduced-affinity mSA variant E44Q/S45A-mSA because we found that its binding affinity was appropriately matched to the unfolding free energy. If the affinity is too high, essentially stoichiometric binding will occur and the contribution of ΔGU will be masked. If the affinity is too low, it will require impractical concentrations of the mSA variant to unfold the protein. The appropriate mSA variant must be empirically determined. Half-maximal binding occurs at a similar concentration for both binding curves. Using E44Q/S45A-mSA with a known intrinsic binding affinity (Fig. S5 and SI Text), we obtain ΔGU values of 12.1 ± 0.6 and 12.2 ± 0.6 kcal/mol, respectively. The similarity of unfolding curves and extracted ΔGU values starting from distinct initial conditions strongly suggests that the binding curves reflect thermodynamic equilibrium conditions.
As an additional test of our ability to determine consistent ΔGU values, we obtained binding curves using another mSA variant with a slightly higher affinity (approximately threefold difference in intrinsic Kd value) (15). Fig. S6 A and B shows binding curves obtained from S45A-mSA and E44Q/S45A-mSA, respectively. At 0.21 XSDS we find similar ΔGU values of 14.3 ± 0.5 kcal/mol, using S45A-mSA, and 13.9 ± 0.2 kcal/mol, using E44Q/S45A-mSA. Taken together, the results indicate that steric trapping can be used to measure true thermodynamic stability of a membrane protein.
The Stability of bR in Bicelle Conditions.
With a method to measure unfolding free energy, ΔGU, under native conditions, we attempted to measure the unfolding free energy of bR in dimyristoyl phosphatidylcholine and 3-[(3-Cholamidopropyl)dimethylammonio]-2-Hydroxy-1-Propanesulfonate (DMPC/CHAPSO) bicelles. Bicelles are bilayer-like discs that form in a mixture of lipid and certain amphiphiles. The average size of the disk can be varied by changing the ratio of lipid to amphiphile—the so-called q ratio (19). We used steric trapping to measure bR stability at q ratios of 1, 2, 2.5, and 3. The samples were prepared under two sets of conditions. We either kept the CHAPSO concentration at 16 mM and increased the DMPC concentration from 15 mM (q = 1) to 30 mM (q = 2), 37.5 mM (q = 2.5), and 45 mM (q = 3) or we kept the total detergent plus lipid concentration constant at 31 mM. The binding curves and results are shown in Fig. 5 A and B. Under conditions where the total lipid plus detergent concentration was allowed to vary, bR stability increased from 11.2 ± 0.3 kcal/mol to 12.3 ± 0.5 kcal/mol. These results are consistent with earlier work showing an increased folding rate in micelles at higher detergent concentrations (12). Under constant total lipid plus detergent conditions, however, the stability remains relatively constant at different q ratios: 11.2 ± 0.3 kcal/mol at q = 1, 11.7 ± 0.3 kcal/mol at q = 2, 11.7 ± 0.2 kcal/mol at q = 2.5, and 11.6 ± 0.4 kcal/mol at q = 3. To our knowledge, the stability measurements reported here are unique for a large α-helical membrane protein in a bilayer-like environment.
Fig. 5.

The stability of bR measured by steric trapping in bicelle conditions. (A) Steric trapping binding curves in bicelle environments. The total DMPC+CHAPSO concentration was constant in these assays at 31 mM. The black circles, red diamonds, and blue squares show the results for q = 2, q = 2.5, and q = 3, respectively. The lines are the fitting results using Eq. 6. (B) The observed free energy change as a function of q value under two sets of conditions. Red squares: The CHAPSO concentration was held constant while the DMPC concentration was increased. Black circles: The total CHAPSO and DMPC concentration was kept constant.
The Dependence of Unfolding Free Energy on SDS Denaturant Concentration.
The q =1 condition described above is equivalent to the initial conditions we and others have used for SDS unfolding curves. The unfolding free energy we measured of 11.2 kcal/mol in the absence of SDS is much lower, however, than the 26.2 kcal/mol predicted from a linear extrapolation from the transition zone of the unfolding curve, as shown in Fig. 6 (red circle and Inset). Possible reasons for this discrepancy are (i) the linear extrapolation is not valid or (ii) the steric trapped unfolded state is simply different from the SDS unfolded state so that we are effectively measuring a different equilibrium. We therefore decided to use a steric trapping method to explore the dependence of unfolding free energy on low SDS concentrations that are inaccessible to unfolding free energy measurements, using standard unfolding curves.
Fig. 6.

bR stability as a function of SDS concentration. Shown is the free energy dependence as a function of XSDS, as determined by different methods. Black circles are the results from forward steric trapping reactions. Open blue squares are results from reverse steric trapping reactions. The red circles are the results from SDS titration experiments (Inset). The plotted unfolding free energies were obtained from the transition zone, highlighted by the blue shading, where XSDS is around 0.5–0.65. The red dashed line is the linear fitting from SDS titration results. The extrapolated unfolding free energy at XSDS = 0 is 26 kcal/mol. As shown, results from forward and reverse reactions have a good agreement in the overlapped region. Distinct nonlinearity is observed between 0 and 0.4 XSDS. All of the ΔGU values were calculated using a 1-M standard state.
Steric trapping experiments were set up in both forward (starting from folded bR) and reverse (starting from SDS unfolded bR) directions where possible. The SDS concentrations accessible to both directions are limited in two ways. At the low end, the lowest practical final dilution from the reverse direction is to 0.15 XSDS. Thus, below 0.15 XSDS we can practically measure unfolding free energies starting only from the forward reaction. At the high end, we are limited to about 0.45 XSDS because the unfolding free energy becomes so low that there is essentially no measurable difference between the mSA binding to bR-BE2 and its intrinsic affinity for biotin.
The ΔGU values obtained for a range of SDS concentrations are shown in Fig. 6. We highlight the following observations: (i) Where we have both measurements, there is always a good agreement between the ΔGU values measured in both the forward and the reverse reactions as expected if we are measuring an equilibrium value as discussed above. (ii) ΔGU measured by steric trapping is decidedly nonlinear, reaching a maximum of ∼13 kcal/mol at ∼0.1 XSDS. (iii) The ΔGU value at 0.45 XSDS is not far different from the value expected for a linear extrapolation of the values obtained from the traditional unfolding curve. Thus, the ΔGU values measured from steric trapping and standard unfolding curves together appear to make an overall smooth curve, suggesting that steric trapping and SDS unfolding are similar energetically and probing a similar unfolding event. These results indicate that the assumption of a linear dependence between SDS concentration and unfolding free energy does not hold across a wide range of SDS concentrations.
Conclusion
The steric trapping method has allowed us to measure unfolding free energies of a large membrane protein under native conditions. Using the method, we were able to explore the SDS concentration dependence of unfolding free energy at low SDS concentrations. At low SDS concentrations the protein is almost completely folded, precluding measurement of unfolding free energy by traditional methods. We find a decidedly nonlinear relationship from 0 to 0.65 XSDS. We do not yet know the origin of the observed curvature. It is possible that there are changes in micelle properties that are not linear with SDS concentration (20). It is also possible that bR is an anomaly that can be assessed only by studying additional membrane proteins. bR is particularly convenient for steric trapping as currently constituted because it bears an intrinsic spectroscopic probe. Other proteins require other methods to monitor the unfolding transition, such as the pulse proteolysis method used here (18). It may also be possible introduce spectroscopic probes, using nonnatural amino acids with functional groups orthogonal to the thiol chemistry used to introduce the biotin tags (21). Work along these lines is ongoing. Nevertheless, we argue that extrapolations outside the transition zone should be treated with caution at this point. Given the uncertainty of extrapolations from transition zone measurements, we argue that bR is the only large helical membrane protein with a reliably measured thermodynamic stability under native conditions. In this study, we find that bR has a very high thermodynamic stability in bicelle conditions, with unfolding free energy greater than 11 kcal/mol. It will be interesting to examine the stability of other membrane proteins to see if high thermodynamic stability is common among helical membrane proteins, and the steric trapping method provides a tool to obtain these values.
Materials and Methods
Chemicals and Reagents.
DMPC was purchased from Avanti Polar Lipids. CHAPSO was purchased from Affymetrix.
Protein Expression and Purification.
bR was purified from Halobacterium salinarum as previously described (22) and all mSA proteins and mutants were prepared as previously described (15, 23), except that 2 mM DTT was added to all buffers when purifying Cys-containing bR and mSA mutants.
Biotin Labeling of bR and Fluorescent Labeling of mSA.
For the biotin labeling reaction, 750 μL of 40 μM D36C/F230C-bR or F203C-bR with 40 mM phosphate buffer (pH 8.0) and 2 mM of TCEP (Pierce) were mixed with 250 μL of 4–6 mM of N-(biotinoyl)-N′-(iodoacetyl)ethylenediamine (Biotium) and 1 mM of free biotin (Sigma) dissolved in DMSO. The free biotin was found to improve labeling efficiency, perhaps by blocking competing binding sites. bR is in the purple membrane condition during the reaction and no detergent was added. The reaction was incubated at 25 °C with gentle stirring for 12–15 h in the dark. To remove the labeling reagent, the purple membrane was sedimented by centrifugation in a microfuge and then resuspended in 20 mM phosphate (pH 7.0). The centrifugation and washing step was repeated three times with water. Labeling efficiency was estimated by the gel shift assay described below.
For the fluorescent labeling of mSA mutants that were used in determining the intrinsic binding constant between bR-BE2 and mSA (SI Text and Fig. S5), a final concentration of 40 μM of W79A/Y83C-mSA or E44Q/S45A/Y83C-mSA in 40 mM phosphate buffer (pH 8) and 2 mM of TCEP were mixed with a final concentration of ∼0.8 mM of Fluorescein-5-Maleimide (Invitrogen) dissolved in DMSO. The reaction was incubated at room temperature with gentle stirring overnight in the dark. Excess fluorescent probe was removed using an EconoPac 10DG desalting column (Bio-Rad) equilibrated with 20 mM phosphate buffer (pH 7). Labeling efficiency was estimated using the extinction coefficients of proteins (for W79A/Y83C, EC = 145,760 M−1⋅cm−1, and for E44Q/S45A/Y83C, EC = 167,770 M−1⋅cm−1, respectively) and Fluorescein-5-Maleimide (EC = 83,000 M−1⋅cm−1). The labeling efficiency was generally more than 90%.
SDS/PAGE Gel Analysis for Labeling Efficiency.
Biotinylation efficiency was analyzed by an SDS/PAGE gel shift assay. A total of 5–10 μM of biotin-labeled bR was mixed with 40 μM of WT-mSA. Samples were incubated at room temperature for 30 min before gel loading. The running buffer was precooled at 4 °C and the gel box was incubated in ice during electrophoresis to prevent dissociation of WT-mSA subunits.
Pulse Proteolysis Assay.
For samples under folded conditions, 5–10 μM of bR-BE2 was preequilibrated with 20 mM phosphate buffer (pH 7) containing 15 mM DMPC, 16 mM CHAPSO, and 7.7 mM SDS (0.2 mol fraction) for 12 h. After incubation, the sample was mixed with WT-mSA at a final concentration of ∼25–30 μM and incubated for 1 h before analysis by proteolysis as discussed below. The short 1-h incubation results in minimal unfolding under these conditions as judged by retinal absorbance.
For bR under the sterically trapped unfolded condition, biotinylated bR (bR-BE2) was preequilibrated with 20 mM phosphate buffer (pH 7) containing 15 mM DMPC, 16 mM CHAPSO, 63 mM SDS (0.67 mol fraction), and 175–200 μM WT-mSA for 12 h. After incubation, the sample was diluted with buffer to yield the same final concentration of SDS (0.2 XSDS) and WT-mSA (25–30 μM) as in the folded bR condition and incubated for another 1 h before the proteolysis reaction.
Protease subtilisin (Sigma) was added into each sample to a final concentration of 50 ng/mL. Twenty microliters of each sample was removed at various time points, the reactions were quenched with 10 mM of PMSF, and digestion was assessed by SDS/PAGE.
Steric Trap Binding Experiment in Micelle and Bicelle Conditions.
For the forward reaction, 2.5 μM of bR-BE2 was solubilized in 15 mM DMPC, 16 mM CHAPSO (1× condition) containing 20 mM phosphate buffer (pH 7), and the desired SDS concentration overnight. After overnight incubation in the dark, 0–40 μM of E44Q/S45A-mSA was added to the solubilized bR-BE2 to yield a final volume of 220 μL and the samples were incubated in the dark with gentle shaking for an additional 5 d. After incubation, samples were centrifuged in a microfuge and filtered using a 96-well PVDF (2 μm) filter plate (Millipore) to remove unseen dirt or particles. The absorbance of the final filtered samples was measured by a SpectraMax M5 plate reader at 560 nm (retinal peak) and 700 nm (for background correction). Each wavelength was measured 10 times and the average was taken.
For the reverse reaction, 2.5 μM of bR-BE2 was unfolded at 0.67 XSDS in 15 mM DMPC and 16 mM CHAPSO containing 20 mM phosphate buffer (pH 7). After bR-BE2 was completely unfolded as judged by loss of retinal absorbance, varying amounts of E44Q/S45A-mSA were added (the final concentration in each sample ranged from 0 μM to 40 μM) to yield a final volume of 33 μL and incubated in the dark with gentle shaking overnight. After incubation, refolding buffer containing 15 mM DMPC, 16 mM CHAPSO in 20 mM phosphate buffer (pH 7), and an appropriate SDS concentration (to yield a final XSDS ranging from 0.21 to 0.4) was added to the sample with a final volume at 220 μL. The samples were incubated for an additional 5 d in the dark with gentle shaking.
Experiments under DMPC/CHAPSO bicelle conditions were performed in the same way as described as above except that the DMPC:CHAPSO ratios were 2:1, 2:5, and 3:1 with either a constant DMPC concentration at 15 mM or a total DMPC+CHAPSO concentration held constant at 31 mM.
Fitting Equations and Data Analysis.
For fitting the steric trap binding curves, the fitting equation is derived from scheme [1] as described below.
In scheme [1], bR refers to the labeled bR-BE2, bO is the unfolded bO-BE2, Ret is retinal, mSA is monovalent streptavidin, KU is the unfolding equilibrium constant, and KD is the intrinsic dissociation constant for mSA binding to the exposed biotin on the protein. Because mSA can readily bind to any exposed biotin that is not sterically occluded and initial binding to a single biotin site will not unfold the protein, we ignore the initial binding step and start with singly bound bR⋅ mSA. As a result, the added mSA concentrations must be adjusted by the starting concentration of bR, bR0. For example, if we use 0.5 μM bR-BE2, all of the added mSA will bind and not affect the unfolding equilibrium until we have added 0.5 μM mSA. At this point, the effective mSA concentration will be zero. Thus, the concentration of added mSA used in fitting the binding isotherms, mSA0, is adjusted as follows:
Based on the mechanism, we can write
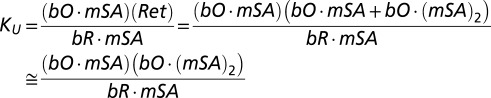 |
 |
We are able to simplify the equation for KU because the concentration of unfolded bO·mSA is negligible relative to bO·(mSA)2, because the concentrations of mSA used are way above the KD for mSA binding to unoccluded biotin in the unfolded protein. In particular, the KD between biotinylated bR and E44Q/S45A-mSA is ∼3–30 nM. The working concentrations of E44Q/S45A-mSA in the experiments are from 1 μM to 40 μM, implying that the ratios of bO⋅mSA to bO⋅(mSA)2 will be between 0.01 and 0.0001:
 |
The fraction of bound, θB, can then be written as
Substituting Eq. 2 into Eq. 3 and rearranging yields
 |
Solving for θB gives
 |
The final fitting equation is
where A(mSA0) is the observed absorbance at 560 nm as a function of total mSA concentration and AF and Au are the absorbance of folded bR and unfolded bR, respectively.
Supplementary Material
Acknowledgments
We thank members of the J.U.B. laboratory for insightful discussion and critical reading of the manuscript. This work is supported by National Institutes of Health Grant R01 GM063919 (to J.U.B.).
Footnotes
The authors declare no conflict of interest.
This article is a PNAS Direct Submission.
This article contains supporting information online at www.pnas.org/lookup/suppl/doi:10.1073/pnas.1318576111/-/DCSupplemental.
References
- 1.Fersht A. Structure and Mechanism in Protein Science: A Guide to Enzyme Catalysis and Protein Folding. New York: Freeman; 1999. [Google Scholar]
- 2.Pace CNC. Determination and analysis of urea and guanidine hydrochloride denaturation curves. Methods Enzymol. 1986;131:266–280. doi: 10.1016/0076-6879(86)31045-0. [DOI] [PubMed] [Google Scholar]
- 3.Johnson CM, Fersht AR. Protein stability as a function of denaturant concentration: The thermal stability of barnase in the presence of urea. Biochemistry. 1995;34(20):6795–6804. doi: 10.1021/bi00020a026. [DOI] [PubMed] [Google Scholar]
- 4.Jackson SE. How do small single-domain proteins fold? Fold Des. 1998;3(4):R81–R91. doi: 10.1016/S1359-0278(98)00033-9. [DOI] [PubMed] [Google Scholar]
- 5.Braiman MS, Stern LJ, Chao BH, Khorana HG. Structure-function studies on bacteriorhodopsin. IV. Purification and renaturation of bacterio-opsin polypeptide expressed in Escherichia coli. J Biol Chem. 1987;262(19):9271–9276. [PubMed] [Google Scholar]
- 6.Booth PJP, et al. Intermediates in the folding of the membrane protein bacteriorhodopsin. Nat Struct Biol. 1995;2(2):139–143. doi: 10.1038/nsb0295-139. [DOI] [PubMed] [Google Scholar]
- 7.Curnow P, Booth PJ. Combined kinetic and thermodynamic analysis of alpha-helical membrane protein unfolding. Proc Natl Acad Sci USA. 2007;104(48):18970–18975. doi: 10.1073/pnas.0705067104. [DOI] [PMC free article] [PubMed] [Google Scholar]
- 8.Booth PJ, Clarke J. Membrane protein folding makes the transition. Proc Natl Acad Sci USA. 2010;107(9):3947–3948. doi: 10.1073/pnas.0914478107. [DOI] [PMC free article] [PubMed] [Google Scholar]
- 9.Lau FW, Bowie JU. A method for assessing the stability of a membrane protein. Biochemistry. 1997;36(19):5884–5892. doi: 10.1021/bi963095j. [DOI] [PubMed] [Google Scholar]
- 10.Cao Z, Schlebach JP, Park C, Bowie JU. Thermodynamic stability of bacteriorhodopsin mutants measured relative to the bacterioopsin unfolded state. Biochim Biophys Acta. 2012;1818:1049–1054. doi: 10.1016/j.bbamem.2011.08.019. [DOI] [PMC free article] [PubMed] [Google Scholar]
- 11.Chen GQ, Gouaux E. Probing the folding and unfolding of wild-type and mutant forms of bacteriorhodopsin in micellar solutions: Evaluation of reversible unfolding conditions. Biochemistry. 1999;38(46):15380–15387. doi: 10.1021/bi9909039. [DOI] [PubMed] [Google Scholar]
- 12.Schlebach JP, Cao Z, Bowie JU, Park C. Revisiting the folding kinetics of bacteriorhodopsin. Protein Sci. 2012;21(1):97–106. doi: 10.1002/pro.766. [DOI] [PMC free article] [PubMed] [Google Scholar]
- 13.Faham S, et al. Side-chain contributions to membrane protein structure and stability. J Mol Biol. 2004;335(1):297–305. doi: 10.1016/j.jmb.2003.10.041. [DOI] [PubMed] [Google Scholar]
- 14.Blois TM, Hong H, Kim TH, Bowie JU. Protein unfolding with a steric trap. J Am Chem Soc. 2009;131(39):13914–13915. doi: 10.1021/ja905725n. [DOI] [PMC free article] [PubMed] [Google Scholar]
- 15.Hong H, Blois TM, Cao Z, Bowie JU. Method to measure strong protein-protein interactions in lipid bilayers using a steric trap. Proc Natl Acad Sci USA. 2010;107(46):19802–19807. doi: 10.1073/pnas.1010348107. [DOI] [PMC free article] [PubMed] [Google Scholar]
- 16.Hong H, Bowie JU. Dramatic destabilization of transmembrane helix interactions by features of natural membrane environments. J Am Chem Soc. 2011;133(29):11389–11398. doi: 10.1021/ja204524c. [DOI] [PMC free article] [PubMed] [Google Scholar]
- 17.Bayer EAE, Ehrlich-Rogozinski SS, Wilchek MM. Sodium dodecyl sulfate-polyacrylamide gel electrophoretic method for assessing the quaternary state and comparative thermostability of avidin and streptavidin. Electrophoresis. 1996;17(8):1319–1324. doi: 10.1002/elps.1150170808. [DOI] [PubMed] [Google Scholar]
- 18.Schlebach JP, Kim M-S, Joh NH, Bowie JU, Park C. Probing membrane protein unfolding with pulse proteolysis. J Mol Biol. 2011;406(4):545–551. doi: 10.1016/j.jmb.2010.12.018. [DOI] [PMC free article] [PubMed] [Google Scholar]
- 19.McKibbin C, et al. Opsin stability and folding: Modulation by phospholipid bicelles. J Mol Biol. 2007;374(5):1319–1332. doi: 10.1016/j.jmb.2007.10.018. [DOI] [PubMed] [Google Scholar]
- 20.Broecker J, Keller S. Impact of urea on detergent micelle properties. Langmuir. 2013;29(27):8502–8510. doi: 10.1021/la4013747. [DOI] [PubMed] [Google Scholar]
- 21. Gerrits M, et al. (2007) Cell‐Free Synthesis of Defined Protein Conjugates by Site‐Directed Cotranslational Labeling, eds Katzen F, Bennett R, Kudlicki W (Landes Bioscience, Austin, TX), pp 166–180.
- 22.Oesterhelt D, Stoeckenius W. Isolation of the cell membrane of Halobacterium halobium and its fractionation into red and purple membrane. Methods Enzymol. 1974;31:667–678. doi: 10.1016/0076-6879(74)31072-5. [DOI] [PubMed] [Google Scholar]
- 23.Howarth M, et al. A monovalent streptavidin with a single femtomolar biotin binding site. Nat Methods. 2006;3(4):267–273. doi: 10.1038/NMETHXXX. [DOI] [PMC free article] [PubMed] [Google Scholar]
Associated Data
This section collects any data citations, data availability statements, or supplementary materials included in this article.