Significance
Aquaporins are known for their capacity to increase transcellular water exchange. In plants, a highly conserved group known as plasma membrane intrinsic proteins (PIP) affects the adjustment of not only membrane water permeability but also overall plant hydraulic conductivity. An experimental design combined with a mathematical modeling approach allowed us to explore the interplay of channel gating, membrane translocation, and channel stoichiometric arrangement of a pair of PIP1 and PIP2 aquaporins. We dissect the individual contribution of each PIP, showing that (i) PIP1 has a high water transport capacity when coexpressed with PIP2, (ii) PIP2 water permeability is enhanced if it physically interacts with PIP1, and (iii) the PIP1–PIP2 interaction results in the formation of heterotetramers with random stoichiometric arrangement.
Abstract
The plant aquaporin plasma membrane intrinsic proteins (PIP) subfamily represents one of the main gateways for water exchange at the plasma membrane (PM). A fraction of this subfamily, known as PIP1, does not reach the PM unless they are coexpressed with a PIP2 aquaporin. Although ubiquitous and abundantly expressed, the role and properties of PIP1 aquaporins have therefore remained masked. Here, we unravel how FaPIP1;1, a fruit-specific PIP1 aquaporin from Fragaria x ananassa, contributes to the modulation of membrane water permeability (Pf) and pH aquaporin regulation. Our approach was to combine an experimental and mathematical model design to test its activity without affecting its trafficking dynamics. We demonstrate that FaPIP1;1 has a high water channel activity when coexpressed as well as how PIP1–PIP2 affects gating sensitivity in terms of cytosolic acidification. PIP1–PIP2 random heterotetramerization not only allows FaPIP1;1 to arrive at the PM but also produces an enhancement of FaPIP2;1 activity. In this context, we propose that FaPIP1;1 is a key participant in the regulation of water movement across the membranes of cells expressing both aquaporins.
The plasma membrane (PM) is the first barrier that limits water exchange in plant cells. The rate of its water transport capacity is mainly associated with aquaporins. Among the seven aquaporin subfamilies described in the plant kingdom, only plasma membrane intrinsic proteins (PIP) and some members of the nodulin-26–like intrinsic proteins (NIP) and X intrinsic proteins (XIP) subfamilies have been shown to be preferentially localized at the PM (1, 2). Of these, PIP aquaporins appear to have a large role in controlling membrane water permeability, whereas NIP and XIP have been mainly described as solute transporters (2–4). Plant PIP aquaporins represent a conserved subfamily that has been historically divided into two subgroups due to their differences in primary structure, PIP1 and PIP2. Interestingly, PIP aquaporins compose ∼40% of the total aquaporin set, and the PIP1 and PIP2 ratio among different species is relatively constant (5–12). Fig. S1 shows the distribution of all aquaporin genes present in plants whose genome has been completely sequenced and analyzed. Antisense inhibition experiments on Arabidopsis thaliana PIP1 and PIP2 have suggested that the two subgroups of aquaporins contribute to root or leaf hydraulic conductivity in the same way (13). In several plant species, members of the PIP1 and PIP2 subgroups were shown to be coexpressed in the same cell type (14–17).
Although PIP1 are as ubiquitous as PIP2, the functional properties of each type of channel are different. PIP2 are very well described as a homotetramer with high water transport activity (18, 19) and a gating mechanism unequivocally associated with specific and conserved amino acid motifs triggered by cytosolic acidification (20–22), phosphorylation (23, 24), or divalent cation concentration (22). In contrast, PIP1 have shown complex heterogeneity in water and solute transport and posttranslational regulation. Many reports show that some PIP1 are nonfunctional in regard to water transport (6, 25), whereas other PIP1 act as low-efficiency water channels (26–28), and a minority group shows activity comparable to that of PIP2 (20, 29) or, in contrast, serves as solute channels (25, 30).
In addition to their transport properties, many PIP1 show membrane relocalization as a regulatory mechanism, a feature that clearly distinguishes them from any PIP2. These PIP1 fail to reach the PM when expressed alone, but they can succeed if they are coexpressed with PIP2. It has been proposed that this process is a consequence of a physical interaction between PIP1 and PIP2, as reported in both homologous (31) and heterologous systems (14, 32). Although there are some PIP1 with the ability to reach the PM on their own (20, 27, 29), this PIP1–PIP2 interaction seems to be present for several pairs of PIP among different species with functional consequences (14, 21, 28, 33–35).
Although the molecular basis of this interaction is still not clear, some data support a model in which the aquaporins of the two subgroups physically interact—very likely by heterooligomerization—to facilitate PIP1 trafficking (31). Recently, it was shown that the first extracellular loop of PIP2 (loop A in BvPIP2;1) could be relevant to the formation of heterotetramers with PIP1 (32). The modification of cytosolic pH sensing, reflected by a shift in the EC50 of oocytes coexpressing BvPIP2;2 and BvPIP1;1 compared with BvPIP2;2 expressed alone, favors the heterooligomerization hypothesis (21).
The aim of this work is to contribute to the understating of the PIP1 and PIP2 interaction and to elucidate the functional properties of PIP1 and the role it plays in defining overall membrane permeability.
Results
FaPIP1;1 Cannot Reach the PM Unless It Is Coexpressed with FaPIP2;1.
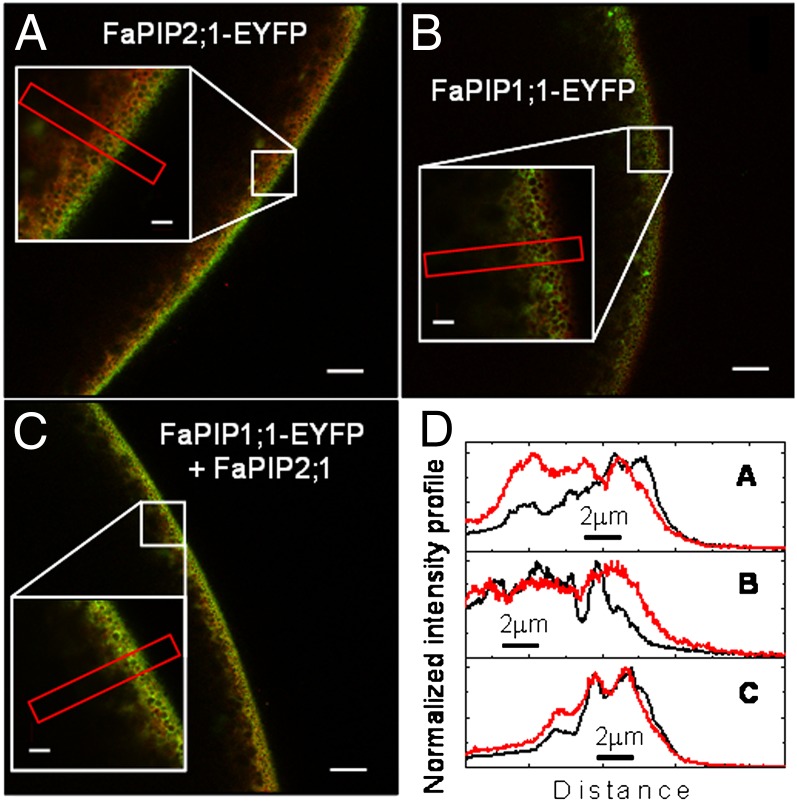
The localization of FaPIP1;1-EYFP and FaPIP2;1-EYFP was studied by means of confocal microscopy in Xenopus oocytes expressing the tagged aquaporins. Fig. 1 shows that whereas FaPIP2;1-EYFP is localized mostly at the oocyte PM, FaPIP1;1-EYFP is restricted to internal structures. However, when FaPIP1;1-EYFP is coexpressed with FaPIP2;1, the fluorescence signal is mainly visualized at the limit of the cell, indicating its relocalization to the PM.
Fig. 1.
Subcellular localization of FaPIP2;1-EYFP and FaPIP1;1-EYFP. (A–C) Radial (x–z) confocal images of Xenopus laevis oocytes expressing FaPIP2;1-EYFP (A) (green) and FaPIP1;1-EYFP (B and C) (green), previously injected with TMR-Dextran (red). The oocyte surface is near the right of each image frame, and the interior of the oocyte is to the left. Insets show an enlargement of the indicated square section. (A) FaPIP2;1-EYFP localizes mostly in the oocyte PM; (B) FaPIP1;1-EYFP expressed alone is restricted to internal structures. (C) When FaPIP1;1-EYFP is coexpressed with FaPIP2;1, the fluorescence is mainly visualized at the limit of the cell, indicating the relocalization of FaPIP1;1-EYFP to PM. (D) Normalized intensity profile of selected areas in A–C. The black line represents EYFP intensity levels, and the red line shows the TMR-Dextran intensity levels.
Water transport assays show that FaPIP1;1-EYFP displayed no significant increase in PM osmotic water permeability in accordance with FaPIP1;1-EYFP localization in the interior of the cell (Fig. S2). Oocytes expressing FaPIP2;1-EYFP showed high water transport activity (Pf = 112 ± 8 10−4 cm⋅s−1). Coexpression of FaPIP1;1-EYFP with FaPIP2;1 and coexpression of FaPIP1;1 with FaPIP2;1-EYFP present high Pf values, 250 ± 8 10−4 cm⋅s−1 and 250 ± 13 10−4 cm⋅s−1, respectively; in both cases, the values are almost 2.2-fold higher than the Pf with FaPIP2;1-EYFP expressed alone. These results are consistent with previously reported values of Pf for non–EYFP-tagged FaPIP coexpression (36).
FaPIP2;1–FaPIP1;1 Coexpression Has a Different pH Inhibition Response than FaPIP2;1 Expressed Alone.
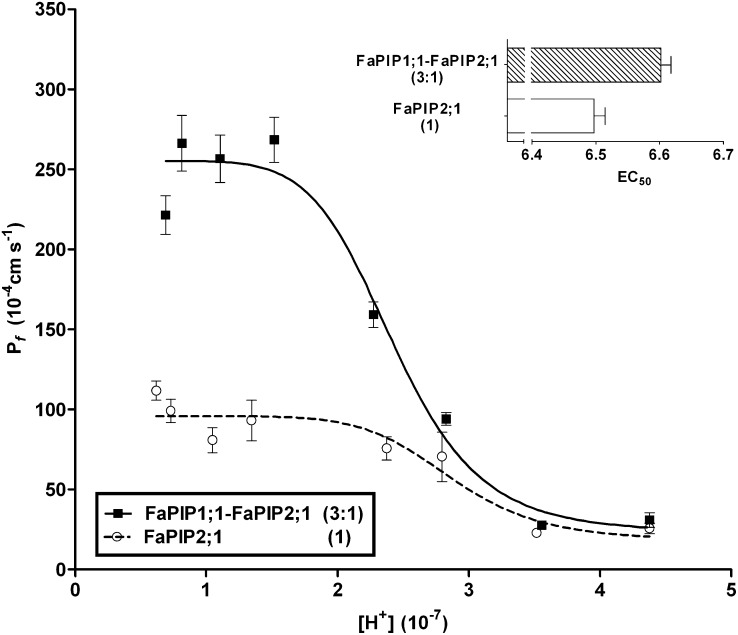
In a previous study, we showed that cytosolic acidification (pH 6.0) of oocytes expressing FaPIP2;1 or coexpressing FaPIP1;1-FaPIP2;1 triggers a reduction in Pf (36). Here, we analyze the pattern of this inhibition of Pf vs. [H+] dose–response curves (Fig. 2), which is sigmoidal for both systems, indicating allosteric behavior. Both maximal Pf and EC50 are different in each case. The EC50 value shifts to 6.60 ± 0.02 when both aquaporins are coexpressed, showing a different gating sensitivity to proton concentration (Fig. 2, Inset).
Fig. 2.
Pf inhibitory response triggered by cytosolic acidification for FaPIP1;1–FaPIP2;1 (at a 3:1 cRNA mass ratio) and for FaPIP2;1 expressed alone. Shown is Pf vs. [H+] inhibitory response profile for oocytes injected with FaPIP2;1 cRNA and oocytes injected with FaPIP1;1 and FaPIP2;1 cRNA in a 3:1 mass ratio. The amount of cRNA is represented in parentheses with an arbitrary unit of measure where 1 is equivalent to 1.25 ng of cRNA. The data points are representative values obtained from the same batch of oocytes (mean Pf ± SEM). The data were fitted to an allosteric sigmoidal dose–response curve. (Inset) For each KI ([H+] at which half of the maximum effect occurs), an EC50 value was calculated using  . The mean EC50 value (EC50 ± SEM, n = 3–5) was calculated for each treatment.
FaPIP2;1 Mutant Reveals FaPIP1;1 Water Transport Activity.
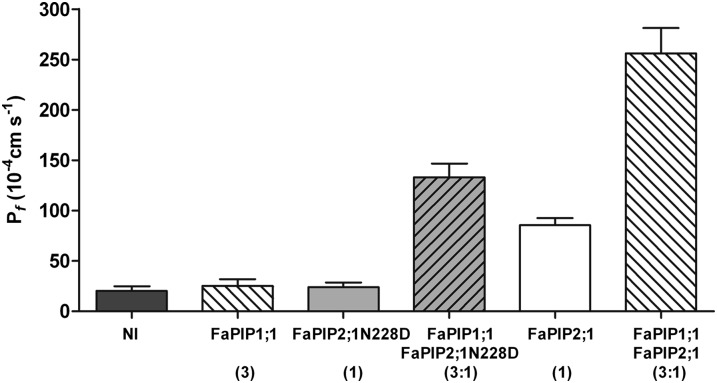
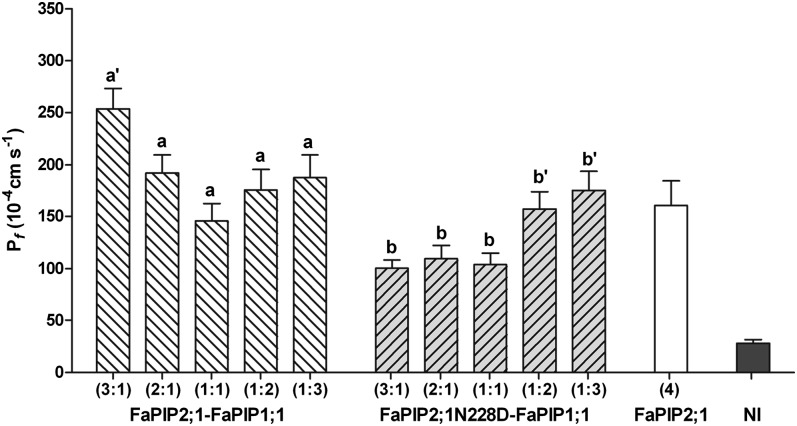
Because FaPIP1;1 is not localized at the PM unless it is coexpressed with FaPIP2;1, we constructed a FaPIP2;1 mutant to characterize the FaPIP1;1 water transport activity. Our objective was to generate a nonfunctional FaPIP2;1 mutant while preserving its capacity to interact with FaPIP1;1. To do so, we followed a strategy already applied to AQP1 (37), replacing a highly conserved residue (Asn228) with Asp. Fig. S3 shows that the mutant FaPIP2;1N228D-EYFP is unable to reach the PM when expressed alone, but when FaPIP1;1 and FaPIP2;1N228D-EYFP or FaPIP1;1-EYFP and FaPIP2;1N228D are coexpressed, both fluorescent-tagged aquaporins reach the PM. These results are consistent with the Pf measurements (Fig. 3 and Fig. S3). When both proteins are coexpressed, the Pf of the oocyte PM increases (Fig. 3). However, this Pf value cannot be a priori assigned to FaPIP1;1 because it has not yet been proved that the mutant is inactive for water transport. Testing the latter hypothesis is not straightforward because FaPIP2;1N228D requires functional interaction with FaPIP1;1 to reach the PM. Therefore, water transport assays were performed in oocytes after the injection of variable complementary RNA (cRNA) mass ratios of FaPIP1;1–FaPIP2;1 or FaPIP1;1–FaPIP2;1N228D. Fig. 4 shows that when FaPIP1;1–FaPIP2;1 are coexpressed, the Pf increase correlates well with the amount of cRNA of FaPIP2;1 injected (P < 0.05). On the other hand, when the amount of FaPIP1;1 cRNA injected was increased, there were no significant differences observed between the Pf of oocytes injected with cRNA mass ratios of 1:1, 1:2, and 1:3 (P < 0.05). When analyzing FaPIP1;1–FaPIP2;1N228D coexpression, the amount of increase in Pf correlated with the amount of cRNA of FaPIP1;1 injected (P < 0.05) but remained constant when the amount of FaPIP2;1N228D cRNA increased (P < 0.05). This result suggests that FaPIP2;1N228D is unable to transport water; moreover, the final Pf could reflect the water transport activity of FaPIP1;1.
Fig. 3.
Osmotic water permeability of FaPIP2;1, FaPIP1;1, and FaPIP2;1N228D and coexpression in Xenopus laevis oocytes. Shown are Pf measurements of oocytes injected with FaPIP1;1, FaPIP2;1, or FaPIP2;1N228D cRNA and coinjections. The amount of cRNA is represented in parentheses with an arbitrary unit of measure where 1 is equivalent to 1.25 ng of cRNA. Noninjected (NI) oocytes were used as controls. Pf values are represented as Pf ± SEM, n = 9–12.
Fig. 4.
Pf measurements of oocytes injected with different cRNA mass ratios of the coexpression pairs FaPIP2;1–FaPIP1;1 and FaPIP2;1N228D–FaPIP1;1. Shown are Pf measurements of oocytes injected with different ratios of cRNA. The amount of cRNA is represented in parentheses with an arbitrary unit of measure where 1 is equivalent to 0.25 ng of cRNA. a′ and b′ are significantly different from a and b, respectively (P < 0.05).
Mathematical Models Dissect the Intrinsic Contribution of Each Coexpressed Aquaporin to the Total Pf.
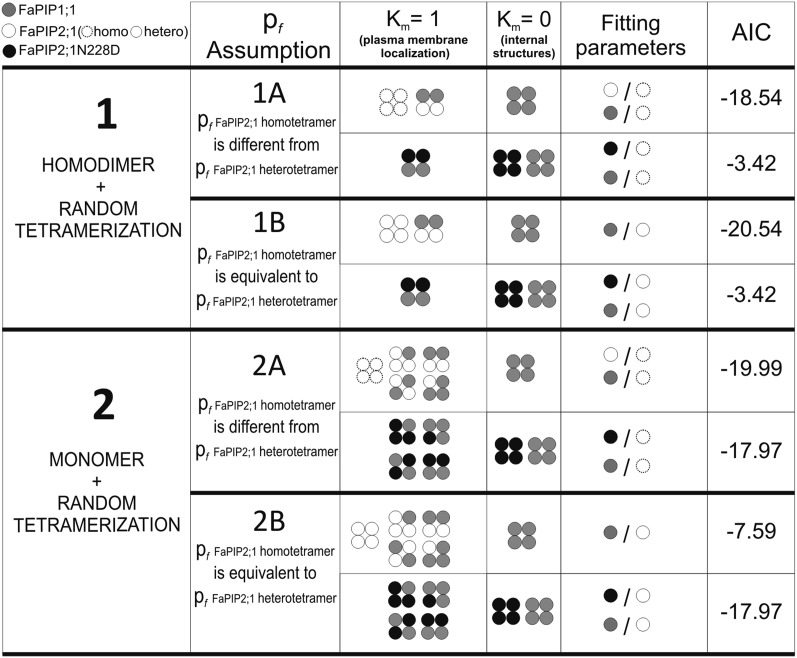
To determine the real contributions of both FaPIP1;1 and FaPIP2;1N228D in terms of water transport, a set of mathematical models was developed (Fig. 5). The difference between the models lies in the composition of tetramers and the intrinsic permeabilities of each FaPIP (pf). For instance, models 1A and 1B assumed that a random aggregation of homodimers forms the tetramer, whereas models 2A and 2B assumed that a random aggregation of monomers forms the tetramer. The classification as A or B models depends on the pf of FaPIP2;1. The A models assume that the FaPIP2;1 pf is not necessarily equal in a homotetramer and in a heterotetramer configuration, whereas the B models assume the same pf for FaPIP2;1 independent of the type of tetramer.
Fig. 5.
Schematic representation of the mathematical models including their assumptions and fitting parameters. Four different models are presented, each with distinctive assumptions regarding each parameter. The second and third columns indicate which tetramers may form within each model and their localization coefficient (km). The fitting parameters are schematized using circles to represent the intrinsic permeability (pf) of each aquaporin. In model A, a distinction was made for FaPIP2;1 intrinsic permeability; open circles represent the FaPIP2;1 intrinsic permeability when it is part of a heterotetramer, and open dotted circles represent the FaPIP2;1 intrinsic permeability when it is part of a homotetramer. The Akaike Information Criterion (AIC) value presented in the sixth column was used to analyze the goodness of fit and the complexity (number of fitting parameters) of the different models (56).
The first round of selection was between model 1 and model 2. Because model 2 fits the data better than model 1 for FaPIP1;1–FaPIP2;1N228D coexpression, the latter was discarded. Model 2 was then preselected, and we proceeded to check the Akaike information criterion (AIC) values of models 2A and 2B for FaPIP1;1–FaPIP2;1 coexpression. Model 2A presents a better fit (AIC = −19.99) in comparison with model 2B (AIC = −7.59). Because only model 2A fitted the data well, the hypothesis associated with this model (i.e., random monomer heterotetramerization and a different FaPIP2;1 pf for homo- and heterotetramer configuration) seems to be the most plausible.
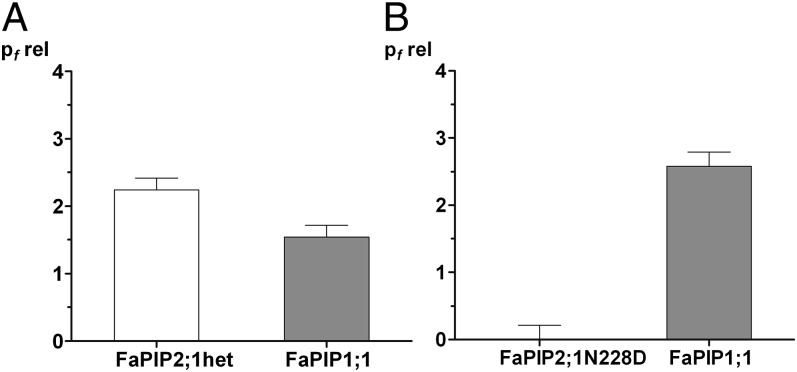
The fitting parameters using model 2A for FaPIP1;1–FaPIP2;1 coexpression and for FaPIP1;1–FaPIP2;1N228D coexpression are shown in Fig. 6. The parameter values of three independent FaPIP1;1 and FaPIP2;1 coexpression experiments and their fittings indicate that the FaPIP1;1 and FaPIP2;1 intrinsic permeabilities within the heterotetramer double the intrinsic permeability of FaPIP2;1 when a homotetramer is formed. The fitting parameter that corresponds to the FaPIP2;1N228D relative intrinsic permeability (pfrelFaPIP2;1N228D) was zero in all three independent adjustments of FaPIP1;1–FaPIP2;1N228D coexpression experiments, reinforcing the hypothesis that the FaPIP2;1N228D mutant lacks water transport capacity and therefore contributes only to the translocation of FaPIP1;1 to the PM. Additionally, the fitting parameter that corresponded to the FaPIP1;1 relative intrinsic permeability (pfrelFaPIP1;1) in all three independent adjustments was similar for both coexpression experiments.
Fig. 6.
Model 2A fitting parameters: relative intrinsic permeability values for each aquaporin. Fitting was performed with three independent experiments that yielded similar results. A representative independent experiment is shown. Because the fitting parameters are the intrinsic permeability of each aquaporin relative to FaPIP2;1 intrinsic permeability when it is part of a homotetramer, the FaPIP2;1 relative intrinsic permeability when it is part of a homotetramer would be equal to 1. (A) Fitting parameter values are reported as pfrel ± SEM for the FaPIP1;1–FaPIP2;1 coexpression results. (B) Fitting parameter values are reported as pfrel ± SEM for the FaPIP1;1–FaPIP2;1N228D coexpression results.
FaPIP1;1 Is Important in pH Sensing.
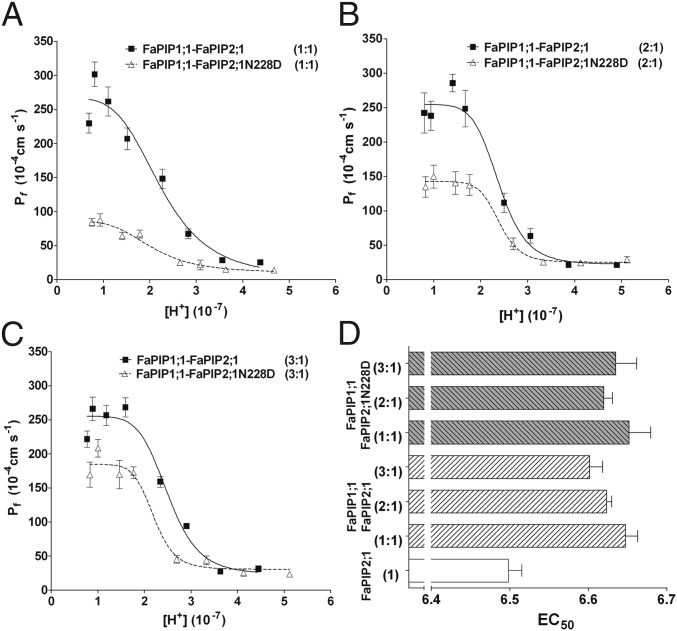
According to our model, FaPIP2;1N228D does not transport water; thus, the observed water permeability when it is coexpressed with FaPIP1;1 can be attributed entirely to FaPIP1;1. With these data, it is possible to explore FaPIP1;1 pH sensitivity and its contribution to the sensitivity of the whole heterotetramer configuration. We analyzed the pH inhibition of the oocyte plasma membrane Pf when different mass ratios of cRNA of FaPIP1;1 and FaPIP2;1N228D or FaPIP2;1 were coinjected. Fig. 7 shows that the EC50 value remains constant regardless of the cRNA coinjection performed, differing only when FaPIP2;1 is expressed alone (P < 0.05).
Fig. 7.
Pf inhibitory response triggered by cytosolic acidification with FaPIP1;1–FaPIP2;1 and FaPIP1;1–FaPIP2;1N228D coexpression. (A–C) Pf vs. [H+] inhibitory response profile for oocytes coinjected with FaPIP1;1 and FaPIP2;1 cRNA and oocytes coinjected with FaPIP1;1 and FaPIP2;1N228D cRNA at 1:1 (A), 2:1 (B), and 3:1 (C) mass ratios. The amount of cRNA is represented in parentheses with an arbitrary unit of measure where 1 is equivalent to 1.25 ng of cRNA. The data points are representative values obtained from the same batch of oocytes (mean Pf ± SEM). Data were fitted to an allosteric sigmoidal dose–response curve. (D) EC50 values reported as the average of three to five independent experiments (EC50 ± SEM, n = 3–5) for each treatment and compared with the FaPIP2;1 EC50 shown in Fig. 2. The FaPIP2;1 EC50 is significantly different from the EC50 values presented in coexpression experiments (P < 0.05).
Discussion
The functional interaction reported for certain PIP1–PIP2 pairs (31, 35) provides an additional regulatory mechanism to adjust water exchanges at the plant PM level. Determining the specific PIP1 contribution to the PM Pf and pH sensitivity when coexpressed with PIP2 was the goal of this work.
We explored FaPIP1;1 as a channel that requires coexpression with FaPIP2;1 to be translocated to PM (Fig. 1). To elucidate its functional activity, we combined coexpression experiments of FaPIP1;1 with FaPIP2;1 or FaPIP2;1N228D with a mathematical approach. The four models developed assumed that the total Pf observed would represent the water transport activity of each aquaporin at the oocyte PM plus the water directly crossing the lipid bilayer. Because it is well established that the MIP quaternary structure is tetrameric (18, 19, 38, 39), all models assumed that all expressed aquaporins form tetrameric structures. Moreover, recent discoveries indicate that PIP interaction occurs via heterotetramerization (25, 32).
To build our models, we had to consider channel arrangement within the tetramer. Studies of a variety of channels and receptors have shown that subunit arrangement in the conformation of heterooligomers varies depending on which membrane protein is being analyzed. It has been proposed that individual proteins might assemble with a random arrangement that is dependent on their abundance (40–43), with a random arrangement of preformed homomeric dimers (44), and some channels even assemble as heteromeric structures with fixed stoichiometry (45, 46). With respect to aquaporins, it was reported that the AQP4 isoforms M1 and M23 seem to assemble as heterotetramers with a random arrangement (47). In regard to PIP aquaporins, it was previously suggested that a disulfide bridge between the cysteines of two monomers could be important in determining the heterotetramer composition, which would assemble through a dimer–dimer association in Zea mays PIP1 and PIP2 (48). Here we considered that (i) random heterooligomerization of two homodimers occurs following a binomial distribution (models 1A and 1B) or (ii) random heterooligomerization of monomers occurs following a binomial distribution (models 2A and 2B).
Our results show that model 2A best explained the experimental results. Models 1A and 1B were discarded because they could not explain the Pf obtained within different coexpression ratios of FaPIP1;1 and FaPIP2;1N228D. These models assume that the interaction of FaPIP2;1N228D dimers with FaPIP1;1 dimers would form heterotetramers with a 2:2 stoichiometry capable of reaching the PM and as a consequence predict that increases in the amount of FaPIP1;1 or FaPIP2;1N228D cRNA would have the same effect as increasing the quantity of 2:2 heterotetramers formed, producing a similar Pf enhancement.
In contrast, models 2A and 2B could explain our results satisfactorily. Models 2A and 2B discriminate between FaPIP2;1 with different or the same intrinsic permeability when forming a homotetramer or a heterotetramer, respectively. A better fit was obtained for model 2A, which confirmed that FaPIP2;1N228D does not transport water (Fig. 6). This lack of activity is in accordance with in silico studies of the conserved NPA motif (49) and constitutes a unique report of a PIP that lacks the ability to transport water due to a mutation of one of the NPA sites. Finally, because FaPIP2;1N228D is a nonfunctional aquaporin, the coexpression of this mutant with FaPIP1;1 reveals the activity of FaPIP1;1 as a water channel.
According to our results, FaPIP2;1 or FaPIP2;1N228D and FaPIP1;1 are organized as heterotetramers with both types of monomers participating in the tetramer randomly, depending on their relative amount. Moreover, the most plausible interpretation of these results is that FaPIP2;1 has a different pf, depending on its tetramer configuration. If FaPIP1;1 and FaPIP2;1 form a heterotetramer, our results show a pf that is twice the pf of FaPIP2;1 when it is in the homotetramer configuration (Fig. 6). These data are important because they could be interpreted as indicating a dual role for FaPIP2;1, not only acting to assist FaPIP1;1 in translocating to the PM but also augmenting its own pf when coexpressed with PIP1. Moreover, because FaPIP1;1 and FaPIP2;1 have approximately the same pf in the heterotetramer configuration, each heterotetramer would be expected to have equal water channel activity regardless of its stoichiometry.
PIP gating by cytosolic acidification has been explored exhaustively in PIP2 (20–22, 36) but analyzed only with AtPIP1;2, a PIP1 that is able to reach the PM alone in Xenopus oocytes (20). Therefore, it was assumed that PIP2 and PIP1 share the same mechanism of triggering an on–off response under acidification. Here, we show that when FaPIP1;1 and FaPIP2;1 are coexpressed, the interaction promotes a change in pH sensing as shown by a modification of the observed EC50 value. Similar results were previously obtained for BvPIPs (21, 32). We demonstrate that coexpressing FaPIP1;1 with FaPIP2;1 or FaPIP2;1N228D produced different maximal Pf. Regardless of the proportion of the channels, the EC50 remained the same, supporting the idea of a characteristic pH sensitivity for the heterotetramers different from that corresponding to the FaPIP2;1 homotetramer (Fig. 7). When PIP2 is expressed in the absence of PIP1, a lower EC50 implies a lower probability of closed water channels in physiological conditions. Clearly, FaPIP1;1 has an important impact on pH sensing by shifting the EC50 when expressed at the PM.
As proved by recent discoveries of the subcellular dynamics of plant AQPs, cellular trafficking and its effect on AQP function are important regulatory mechanisms defining plant cell water permeability (50, 51). Here, we demonstrated that PIP1 aquaporins retained intracellularly are active water channels that are located at the PM when coexpressed with PIP2. The combination of channel relocalization and enhancement of their pf broadens not only the landscape of aquaporin plasticity in adjusting cell-to-cell pathways but also the understanding of the role of heteromerization as a regulatory mechanism.
Materials and Methods
Plasmid Construction and Site-Directed Mutagenesis.
To generate the EYFP-tagged vectors, FaPIP2;1 and FaPIP1;1 cDNAs were amplified by PCR, using the pT7Ts-FaPIP2;1 and pT7Ts-FaPIP1;1 plasmids as templates, respectively. Using specific primers, a SacII site was incorporated at the 5′ end of both constructs and a BglII site at the 3′ end. Then, the two PCR-amplified fragments were subcloned into the SacII and BglII sites of a pT7Ts-BvPIP2;2-EYFP vector, thus exchanging BvPIP2;2 for FaPIP2;1 or FaPIP1;1. The products were pT7Ts-FaPIP2;1-EYFP and pT7Ts-FaPIP1;1-EYFP vectors where the EYFP sequence is 10 codons downstream of the aquaporin sequence.
Mutated cDNA encoding FaPIP2;1N228D and FaPIP2;1N228D-EYFP was obtained by site-directed mutagenesis (QuikChange; Stratagene), following the manufacturer’s recommendations, using custom-made oligonucleotide primers (Eurofins MWG Operon).
All of the constructs were confirmed by DNA sequencing (Macrogen).
cRNA in Vitro Synthesis.
Capped cRNAs encoding FaPIP1;1, FaPIP2;1, FaPIP2;1N228D, FaPIP1;1-EYFP, FaPIP2;1-EYFP, and FaPIP2;1N228D-EYFP were synthesized in vitro, using the mMESSAGE mMACHINE T7 High Yield Capped RNA Transcription Kit (Ambion). The pT7Ts-derived vector carrying the corresponding sequence as template was linearized by XbaI. The synthesized products were suspended at a final concentration of 0.1 µg⋅µL−1 in RNase-free water supplemented with Recombinant RNAsin (Ribonuclease inhibitor; Promega). The cRNA was quantified by fluorescence, using a Quant-iT RNA Assay Kit (Invitrogen). At least two independent cRNA syntheses were assayed.
Oocyte Transport Studies.
Defolliculated Xenopus oocytes were injected with different masses of cRNA in a final volume of 50 nL, using an automatic injector (Drummond Scientific). Injected oocytes were incubated for 72 h at 18 °C in ND96 medium supplemented with 1 μg⋅ml−1 gentamycin sulfate (21). Osmotic water permeability (Pf) was determined by measuring the rate of oocyte swelling induced by a hypo-osmotic shock of 160 mOsm⋅kg−1. Changes in cell volume were video monitored, and the Pf was calculated according to previous reports (52, 53). All osmolarities were determined using a vapor pressure osmometer (5520C; Wescor). Noninjected oocytes were used as a negative control (36). The results from experiments performed with different oocyte batches were not pooled; therefore, all of the experiments shown in this report are representative of at least three different experiments.
Confocal Microscopy.
Confocal fluorescence microscopy was used to determine the localization of the respective PIP subgroups tagged with EYFP. We used tetramethylrhodamine (TMR) dextran (molecular weight 10,000; Invitrogen–Molecular Probes), i.e., an unconjugated nonspecific fluorochrome marker (54), as a marker of the interior of the oocyte. Three to 4 d after cRNA injection and 40 min before imaging, oocytes were microinjected with 50 nL of a 33 mM aqueous solution of TMR-dextran. If the tagged aquaporin fluorescence localized in the same area of the marker fluorescence, the aquaporin is retained in the interior of the cell. However, if the tagged aquaporin fluorescence appeared on the limit of the cell supports, they were localized in PM. Intensity profiles were calculated averaging 5 consecutive pixels along the direction specified in each figure. Fluorescence images of EYFP distribution, together with TMR, were obtained with a FluoView1000 spectral confocal scanning microscope (Spectral FV1000 Olympus, Japan), using a 60X UPLSAPO oil immersion objective lens with a numerical aperture of 1.35. To avoid crosstalk, images were recorded line by line in a sequential order. EYFP and TMR were excited using the 488 nm line of the argon laser and the 543 nm He-Ne, respectively, and the emitted fluorescence was detected in the 500–530 nm and 570–670 nm range. Autofluorescence (monitored in control oocytes) was negligible in comparison with cells expressing fluorescent PIP. We analyzed 3–5 oocytes from each of at least 6 donor frogs.
Aquaporin Inhibition by pH.
The oocyte cytosolic pH was modified following a previously described protocol (20). Briefly, oocytes were preincubated in different NaAc solutions with distinct final pH. For the 5.8–6.8 pH interval, the NaAc solutions were as follows: 50 mM NaAc, 20 mM Mes, supplemented with mannitol 1 M to adjust the osmolarity to ∼200 mOsmol kg−1 and supplemented with NaOH to adjust to the final desired pH. For the 6.8–7.6 pH interval, the NaAc solutions were as follows: 50 mM NaAc, 20 mM Hepes, supplemented with mannitol 1 M to adjust the osmolarity to ∼200 mOsmol kg−1 and supplemented with NaOH to adjust to the final desired pH. To calculate internal proton concentration ([H+]int), we used a calibration curve described previously (21). The Pf values for each [H+]int were fitted with the sigmoidal dose–response equation presented in SI Text (55). The results from experiments performed with different oocyte batches were not pooled; therefore, all of the dose–response curves shown in this work are representative of at least three different curves.
Mathematical Model Analysis.
To analyze the oocyte total water permeability in coexpression assays and dissect the contribution of each aquaporin to the total Pf achieved, four mathematical models were proposed.
The equations of each model are shown in SI Text. The mass of cRNA of each aquaporin injected was used as independent model variables. The dependent variable was [(PfCO−PfNI)/(PfFaPIP2;1−PfNI)], where PfCO−PfNI is the total permeability provided by the tetramers formed by coexpressed aquaporins relative to PfFaPIP2;1−PfNI, which represents the permeability provided by the injection of a fixed amount of cRNA of FaPIP2;1. The fitting parameters are the intrinsic permeability (pf) of each aquaporin forming a heterotetramer relative to the intrinsic permeability of FaPIP2;1 forming a homotetramer; i.e., pfrelFaPIP2;1, pfrelFaPIP1;1, and pfrelFaPIP2;1N228D.
The general assumptions of all models include the following:
i) The water permeability of the lipid bilayer (PfLB) is equal to the water permeability shown by noninjected oocytes (PfNI).
ii) All of the synthesized aquaporins formed tetrameric structures.
iii) The permeability of the oocyte PM is equal to the permeability of the lipid bilayer plus the permeability of the total amount of each type of tetramer expressed in PM.
iv) FaPIP1;1, FaPIP2;1, and FaPIP2;1N228D are equally expressed. A translation coefficient indicating the amount of protein expression per mass of injected RNA was defined: ke (i.e., keFaPIP1;1 = keFaPIP2;1 = keN228D = ke). This coefficient is canceled when the permeability of each coexpression is normalized to the permeability of oocytes injected with 1 ng of FaPIP2;1 cRNA.
v) A localization coefficient (km) is defined for each tetramer on the basis of confocal microscopy data. To simplify the analysis, this coefficient will be 0 or 1 depending on the tetramer localization, with 1 for the PM and 0 for other locations other than the PM.
vi) All heterotetramers (FaPIP1;1–FaPIP2;1 or FaPIP1;1–FaPIP2;1N228D) are assumed to target completely and equally to the PM (km = 1).
The particular assumptions of each model are shown in SI Text.
Each model was fitted to three independent experiments. Fig. 6 shows one representative experiment with the fitted parameters. The AIC was used to compare the different models (56). The AIC was calculated as
where n is the number of experimental data, SC is the residual squares sum, and p is the number of parameters. The model with the lowest AIC value was chosen.
Statistical Analysis.
The results are reported in the form of means ± SEM. Significant differences between treatments were calculated using Student’s t test.
Supplementary Material
Acknowledgments
The authors thank Dr. Luis Gonzalez Flecha for his critical comments and discussion about the mathematical model approach. This work was supported by Grants Préstamo Banco Interamericano de Desarrollo y Proyectos de Investigación Científica y Tecnológica (BID PICT) 2239, UBACyT11-14, and Proyecto de Investigación Plurianual Consejo Nacional de Investigaciones Científicas y Técnicas (PIP CONICET) (to G.A.) and Préstamo BID PICT10-02042, PIP CONICET 0190, and UBACyT10-12 659 (to K.A.).
Footnotes
The authors declare no conflict of interest.
*This Direct Submission article had a prearranged editor.
This article contains supporting information online at www.pnas.org/lookup/suppl/doi:10.1073/pnas.1316537111/-/DCSupplemental.
References
- 1.Maurel C, Verdoucq L, Luu D-T, Santoni V. Plant aquaporins: Membrane channels with multiple integrated functions. Annu Rev Plant Biol. 2008;59:595–624. doi: 10.1146/annurev.arplant.59.032607.092734. [DOI] [PubMed] [Google Scholar]
- 2.Bienert GP, Bienert MD, Jahn TP, Boutry M, Chaumont F. Solanaceae XIPs are plasma membrane aquaporins that facilitate the transport of many uncharged substrates. Plant J. 2011;66(2):306–317. doi: 10.1111/j.1365-313X.2011.04496.x. [DOI] [PubMed] [Google Scholar]
- 3.Ma JF, et al. A silicon transporter in rice. Nature. 2006;440(7084):688–691. doi: 10.1038/nature04590. [DOI] [PubMed] [Google Scholar]
- 4.Takano J, et al. The Arabidopsis major intrinsic protein NIP5;1 is essential for efficient boron uptake and plant development under boron limitation. Plant Cell. 2006;18(6):1498–1509. doi: 10.1105/tpc.106.041640. [DOI] [PMC free article] [PubMed] [Google Scholar]
- 5.Chaumont F, Barrieu F, Wojcik E, Chrispeels MJ, Jung R. Aquaporins constitute a large and highly divergent protein family in maize. Plant Physiol. 2001;125(3):1206–1215. doi: 10.1104/pp.125.3.1206. [DOI] [PMC free article] [PubMed] [Google Scholar]
- 6.Sakurai J, Ishikawa F, Yamaguchi T, Uemura M, Maeshima M. Identification of 33 rice aquaporin genes and analysis of their expression and function. Plant Cell Physiol. 2005;46(9):1568–1577. doi: 10.1093/pcp/pci172. [DOI] [PubMed] [Google Scholar]
- 7.Johanson U, et al. The complete set of genes encoding major intrinsic proteins in Arabidopsis provides a framework for a new nomenclature for major intrinsic proteins in plants. Plant Physiol. 2001;126(4):1358–1369. doi: 10.1104/pp.126.4.1358. [DOI] [PMC free article] [PubMed] [Google Scholar]
- 8.Shelden M, Howitt S, Kaiser B, Tyerman S. Identification and functional characterisation of aquaporins in the grapevine, Vitis vinifera. Funct Plant Biol. 2009;36(12):1065–1078. doi: 10.1071/FP09117. [DOI] [PubMed] [Google Scholar]
- 9.Sade N, et al. Improving plant stress tolerance and yield production: Is the tonoplast aquaporin SlTIP2;2 a key to isohydric to anisohydric conversion? New Phytol. 2009;181(3):651–661. doi: 10.1111/j.1469-8137.2008.02689.x. [DOI] [PubMed] [Google Scholar]
- 10.Gupta AB, Sankararamakrishnan R. Genome-wide analysis of major intrinsic proteins in the tree plant Populus trichocarpa: Characterization of XIP subfamily of aquaporins from evolutionary perspective. BMC Plant Biol. 2009;9:134. doi: 10.1186/1471-2229-9-134. [DOI] [PMC free article] [PubMed] [Google Scholar]
- 11.Park W, Scheffler BE, Bauer PJ, Campbell BT. Identification of the family of aquaporin genes and their expression in upland cotton (Gossypium hirsutum L.) BMC Plant Biol. 2010;10:142. doi: 10.1186/1471-2229-10-142. [DOI] [PMC free article] [PubMed] [Google Scholar]
- 12.Zhang Y, et al. Genome-wide sequence characterization and expression analysis of major intrinsic proteins in soybean (Glycine max L.) PLoS ONE. 2013;8(2):e56312. doi: 10.1371/journal.pone.0056312. [DOI] [PMC free article] [PubMed] [Google Scholar]
- 13.Martre P, et al. Plasma membrane aquaporins play a significant role during recovery from water deficit. Plant Physiol. 2002;130(4):2101–2110. doi: 10.1104/pp.009019. [DOI] [PMC free article] [PubMed] [Google Scholar]
- 14.Fetter K, Van Wilder V, Moshelion M, Chaumont F. Interactions between plasma membrane aquaporins modulate their water channel activity. Plant Cell. 2004;16(1):215–228. doi: 10.1105/tpc.017194. [DOI] [PMC free article] [PubMed] [Google Scholar]
- 15.Fraysse LC, Wells B, McCann MC, Kjellbom P. Specific plasma membrane aquaporins of the PIP1 subfamily are expressed in sieve elements and guard cells. Biol Cell. 2005;97(7):519–534. doi: 10.1042/BC20040122. [DOI] [PubMed] [Google Scholar]
- 16.Hachez C, Heinen RB, Draye X, Chaumont F. The expression pattern of plasma membrane aquaporins in maize leaf highlights their role in hydraulic regulation. Plant Mol Biol. 2008;68(4–5):337–353. doi: 10.1007/s11103-008-9373-x. [DOI] [PubMed] [Google Scholar]
- 17.Horie T, et al. Mechanisms of water transport mediated by PIP aquaporins and their regulation via phosphorylation events under salinity stress in barley roots. Plant Cell Physiol. 2011;52(4):663–675. doi: 10.1093/pcp/pcr027. [DOI] [PubMed] [Google Scholar]
- 18.Törnroth-Horsefield S, et al. Structural mechanism of plant aquaporin gating. Nature. 2006;439(7077):688–694. doi: 10.1038/nature04316. [DOI] [PubMed] [Google Scholar]
- 19.Li X, et al. Single-molecule analysis of PIP2;1 dynamics and partitioning reveals multiple modes of Arabidopsis plasma membrane aquaporin regulation. Plant Cell. 2011;23(10):3780–3797. doi: 10.1105/tpc.111.091454. [DOI] [PMC free article] [PubMed] [Google Scholar]
- 20.Tournaire-Roux C, et al. Cytosolic pH regulates root water transport during anoxic stress through gating of aquaporins. Nature. 2003;425(6956):393–397. doi: 10.1038/nature01853. [DOI] [PubMed] [Google Scholar]
- 21.Bellati J, et al. Intracellular pH sensing is altered by plasma membrane PIP aquaporin co-expression. Plant Mol Biol. 2010;74(1–2):105–118. doi: 10.1007/s11103-010-9658-8. [DOI] [PubMed] [Google Scholar]
- 22.Verdoucq L, Grondin A, Maurel C. Structure-function analysis of plant aquaporin AtPIP2;1 gating by divalent cations and protons. Biochem J. 2008;415(3):409–416. doi: 10.1042/BJ20080275. [DOI] [PubMed] [Google Scholar]
- 23.Johansson I, et al. Water transport activity of the plasma membrane aquaporin PM28A is regulated by phosphorylation. Plant Cell. 1998;10(3):451–459. doi: 10.1105/tpc.10.3.451. [DOI] [PMC free article] [PubMed] [Google Scholar]
- 24.Azad AK, Sawa Y, Ishikawa T, Shibata H. Phosphorylation of plasma membrane aquaporin regulates temperature-dependent opening of tulip petals. Plant Cell Physiol. 2004;45(5):608–617. doi: 10.1093/pcp/pch069. [DOI] [PubMed] [Google Scholar]
- 25.Otto B, et al. Aquaporin tetramer composition modifies the function of tobacco aquaporins. J Biol Chem. 2010;285(41):31253–31260. doi: 10.1074/jbc.M110.115881. [DOI] [PMC free article] [PubMed] [Google Scholar]
- 26.Ding X, Iwasaki I, Kitagawa Y. Overexpression of a lily PIP1 gene in tobacco increased the osmotic water permeability of leaf cells. Plant Cell Environ. 2004;27(2):177–186. [Google Scholar]
- 27.Suga S, Maeshima M. Water channel activity of radish plasma membrane aquaporins heterologously expressed in yeast and their modification by site-directed mutagenesis. Plant Cell Physiol. 2004;45(7):823–830. doi: 10.1093/pcp/pch120. [DOI] [PubMed] [Google Scholar]
- 28.Liu C, et al. Aquaporin OsPIP1;1 promotes rice salt resistance and seed germination. Plant Physiol Biochem. 2013;63:151–158. doi: 10.1016/j.plaphy.2012.11.018. [DOI] [PubMed] [Google Scholar]
- 29.Wei W, et al. HvPIP1;6, a barley (Hordeum vulgare L.) plasma membrane water channel particularly expressed in growing compared with non-growing leaf tissues. Plant Cell Physiol. 2007;48(8):1132–1147. doi: 10.1093/pcp/pcm083. [DOI] [PubMed] [Google Scholar]
- 30.Gaspar M. Cloning and characterization of ZmPIP1-5b, an aquaporin transporting water and urea. Plant Sci. 2003;165(1):21–31. [Google Scholar]
- 31.Zelazny E, et al. FRET imaging in living maize cells reveals that plasma membrane aquaporins interact to regulate their subcellular localization. Proc Natl Acad Sci USA. 2007;104(30):12359–12364. doi: 10.1073/pnas.0701180104. [DOI] [PMC free article] [PubMed] [Google Scholar]
- 32.Jozefkowicz C, et al. Loop A is critical for the functional interaction of two Beta vulgaris PIP aquaporins. PLoS ONE. 2013;8(3):e57993. doi: 10.1371/journal.pone.0057993. [DOI] [PMC free article] [PubMed] [Google Scholar]
- 33.Matsumoto T, et al. Role of the aquaporin PIP1 subfamily in the chilling tolerance of rice. Plant Cell Physiol. 2009;50(2):216–229. doi: 10.1093/pcp/pcn190. [DOI] [PubMed] [Google Scholar]
- 34.Vandeleur RK, et al. The role of plasma membrane intrinsic protein aquaporins in water transport through roots: Diurnal and drought stress responses reveal different strategies between isohydric and anisohydric cultivars of grapevine. Plant Physiol. 2009;149(1):445–460. doi: 10.1104/pp.108.128645. [DOI] [PMC free article] [PubMed] [Google Scholar]
- 35.Mahdieh M, Mostajeran A, Horie T, Katsuhara M. Drought stress alters water relations and expression of PIP-type aquaporin genes in Nicotiana tabacum plants. Plant Cell Physiol. 2008;49(5):801–813. doi: 10.1093/pcp/pcn054. [DOI] [PubMed] [Google Scholar]
- 36.Alleva K, et al. Cloning, functional characterization, and co-expression studies of a novel aquaporin (FaPIP2;1) of strawberry fruit. J Exp Bot. 2010;61(14):3935–3945. doi: 10.1093/jxb/erq210. [DOI] [PMC free article] [PubMed] [Google Scholar]
- 37.Jung JS, Preston GM, Smith BL, Guggino WB, Agre P. Molecular structure of the water channel through aquaporin CHIP. The hourglass model. J Biol Chem. 1994;269(20):14648–14654. [PubMed] [Google Scholar]
- 38.Murata K, et al. Structural determinants of water permeation through aquaporin-1. Nature. 2000;407(6804):599–605. doi: 10.1038/35036519. [DOI] [PubMed] [Google Scholar]
- 39.Sui H, Han BG, Lee JK, Walian P, Jap BK. Structural basis of water-specific transport through the AQP1 water channel. Nature. 2001;414(6866):872–878. doi: 10.1038/414872a. [DOI] [PubMed] [Google Scholar]
- 40.Wang W, Xia J, Kass RS. MinK-KvLQT1 fusion proteins, evidence for multiple stoichiometries of the assembled IsK channel. J Biol Chem. 1998;273(51):34069–34074. doi: 10.1074/jbc.273.51.34069. [DOI] [PubMed] [Google Scholar]
- 41.Berg AP, Talley EM, Manger JP, Bayliss DA. Motoneurons express heteromeric TWIK-related acid-sensitive K+ (TASK) channels containing TASK-1 (KCNK3) and TASK-3 (KCNK9) subunits. J Neurosci. 2004;24(30):6693–6702. doi: 10.1523/JNEUROSCI.1408-04.2004. [DOI] [PMC free article] [PubMed] [Google Scholar]
- 42.Barrera NP, Henderson RM, Murrell-Lagnado RD, Edwardson JM. The stoichiometry of P2X2/6 receptor heteromers depends on relative subunit expression levels. Biophys J. 2007;93(2):505–512. doi: 10.1529/biophysj.106.101048. [DOI] [PMC free article] [PubMed] [Google Scholar]
- 43.Stewart AP, et al. The Kv7.2/Kv7.3 heterotetramer assembles with a random subunit arrangement. J Biol Chem. 2012;287(15):11870–11877. doi: 10.1074/jbc.M111.336511. [DOI] [PMC free article] [PubMed] [Google Scholar]
- 44.Waschk DEJ, Fabian A, Budde T, Schwab A. Dual-color quantum dot detection of a heterotetrameric potassium channel (hKCa3.1) Am J Physiol Cell Physiol. 2011;300(4):C843–C849. doi: 10.1152/ajpcell.00053.2010. [DOI] [PubMed] [Google Scholar]
- 45.Barrera NP, et al. Atomic force microscopy reveals the stoichiometry and subunit arrangement of the α4β3δ GABA(A) receptor. Mol Pharmacol. 2008;73(3):960–967. doi: 10.1124/mol.107.042481. [DOI] [PubMed] [Google Scholar]
- 46.Kobori T, Smith GD, Sandford R, Edwardson JM. The transient receptor potential channels TRPP2 and TRPC1 form a heterotetramer with a 2:2 stoichiometry and an alternating subunit arrangement. J Biol Chem. 2009;284(51):35507–35513. doi: 10.1074/jbc.M109.060228. [DOI] [PMC free article] [PubMed] [Google Scholar]
- 47.Neely JD, Christensen BM, Nielsen S, Agre P. Heterotetrameric composition of aquaporin-4 water channels. Biochemistry. 1999;38(34):11156–11163. doi: 10.1021/bi990941s. [DOI] [PubMed] [Google Scholar]
- 48.Bienert GP, et al. A conserved cysteine residue is involved in disulfide bond formation between plant plasma membrane aquaporin monomers. Biochem J. 2012;445(1):101–111. doi: 10.1042/BJ20111704. [DOI] [PubMed] [Google Scholar]
- 49.Ludewig U, Dynowski M. Plant aquaporin selectivity: Where transport assays, computer simulations and physiology meet. Cell Mol Life Sci. 2009;66(19):3161–3175. doi: 10.1007/s00018-009-0075-6. [DOI] [PMC free article] [PubMed] [Google Scholar]
- 50.Hachez C, Besserer A, Chevalier AS, Chaumont F. Insights into plant plasma membrane aquaporin trafficking. Trends Plant Sci. 2013;18(6):344–352. doi: 10.1016/j.tplants.2012.12.003. [DOI] [PubMed] [Google Scholar]
- 51.Luu DT, Maurel C. Aquaporin trafficking in plant cells: An emerging membrane-protein model. Traffic. 2013;14(6):629–635. doi: 10.1111/tra.12062. [DOI] [PubMed] [Google Scholar]
- 52.Zhang RB, Verkman AS. Water and urea permeability properties of Xenopus oocytes: Expression of mRNA from toad urinary bladder. Am J Physiol. 1991;260(1 Pt 1):C26–C34. doi: 10.1152/ajpcell.1991.260.1.C26. [DOI] [PubMed] [Google Scholar]
- 53.Agre P, Mathai JC, Smith BL, Preston GM. Functional analyses of aquaporin water channel proteins. Methods Enzymol. 1999;294:550–572. doi: 10.1016/s0076-6879(99)94032-6. [DOI] [PubMed] [Google Scholar]
- 54.Brooks JM, Wessel GM. Selective transport and packaging of the major yolk protein in the sea urchin. Dev Biol. 2003;261(2):353–370. doi: 10.1016/s0012-1606(03)00301-4. [DOI] [PubMed] [Google Scholar]
- 55.Németh-Cahalan KL, Kalman K, Froger A, Hall JE. Zinc modulation of water permeability reveals that aquaporin 0 functions as a cooperative tetramer. J Gen Physiol. 2007;130(5):457–464. doi: 10.1085/jgp.200709826. [DOI] [PMC free article] [PubMed] [Google Scholar]
- 56.Akaike H. A new look at the statistical model identification. IEEE Trans Automat Contr. 1974;19(6):716–723. [Google Scholar]
Associated Data
This section collects any data citations, data availability statements, or supplementary materials included in this article.


