

Significance
Motor cortex contains a map of the body that is used to control muscles or movements. However, whether movements are controlled by a spatially distributed neuronal circuit or by segregated clusters of neurons is unknown. We combined optic-fiber–based calcium recordings with cortical microstimulation at two well-separated sites of motor cortex in a behaving monkey. We demonstrate that local cortical activity was tightly associated with distinct and stereotypical movements. Increasing stimulation intensity increased both the amplitude of the movements and the level of neuronal activity. Importantly, the activity remained local, without invading the recording domain of the second optical fiber. These results suggest that motor cortex is functionally organized in segregated clusters of neurons that preferentially code specific movements.
Keywords: monkey, local circuits, neurophysiology, microendoscopy
Abstract
Brain mapping experiments involving electrical microstimulation indicate that the primary motor cortex (M1) directly regulates muscle contraction and thereby controls specific movements. Possibly, M1 contains a small circuit “map” of the body that is formed by discrete local networks that code for specific movements. Alternatively, movements may be controlled by distributed, larger-scale overlapping circuits. Because of technical limitations, it remained unclear how movement-determining circuits are organized in M1. Here we introduce a method that allows the functional mapping of small local neuronal circuits in awake behaving nonhuman primates. For this purpose, we combined optic-fiber–based calcium recordings of neuronal activity and cortical microstimulation. The method requires targeted bulk loading of synthetic calcium indicators (e.g., OGB-1 AM) for the staining of neuronal microdomains. The tip of a thin (200 µm) optical fiber can detect the coherent activity of a small cluster of neurons, but is insensitive to the asynchronous activity of individual cells. By combining such optical recordings with microstimulation at two well-separated sites of M1, we demonstrate that local cortical activity was tightly associated with distinct and stereotypical simple movements. Increasing stimulation intensity increased both the amplitude of the movements and the level of neuronal activity. Importantly, the activity remained local, without invading the recording domain of the second optical fiber. Furthermore, there was clear response specificity at the two recording sites in a trained behavioral task. Thus, the results provide support for movement control in M1 by local neuronal clusters that are organized in discrete cortical domains.
There is a long-standing debate of whether primary motor cortex (M1) contains a map of the body that is used to control muscles or movements (1). Mapping studies of the M1 with intracortical microstimulation (ICM) have searched the lowest electrical current pulses that evoked muscle contractions or movements (2), whereas neuronal recordings have searched the response properties associated with muscle force or abstract parameters like hand path (1, 3). However, another study has suggested that what is represented in M1 is not a map in terms of muscles and movements, but a map of the workspace around the body to which movements are directed after ICM at a time scale of 500 ms (4, 5). As the smallest “unit,” minicolumns with a diameter of about 30 µm are reported to decode simple movements into different directions (6). These minicolumns tend to be arranged in doublets or triplets and repeat about every 240 µm. Much of this debate could be due to the interpretation of results obtained with different techniques. Although these two techniques have provided important insights into the functional organization of M1, none of them can reveal how M1 circuits actually work during motor behavior. In fact, similar motor outputs can be evoked from multiple M1 sites and extrinsic and intrinsic connections may coordinate these separate representations of the same movement (7).
Whereas the above-mentioned studies provided useful information concerning the cortical distribution of neurons controlling finger/hand movements in M1, it has remained unclear whether the cortical territories for defined movements overlap to a considerable extent or not. Thus, the question has remained open as to whether simple hand movements are controlled by a spatially distributed neuronal circuit or by a segregated cluster of neurons. This question cannot be easily addressed with the presently available techniques. Microelectrode recordings as well as two-photon imaging at the level of identified cells (8) report accurate information on the firing pattern of individual neurons, but do not allow a direct and comprehensive mapping of larger circuits. On the other hand, functional magnetic resonance imaging (fMRI) studies are strong in producing functional maps, but the spatial and temporal resolutions are still very limited.
A more recently implemented experimental strategy may be helpful for the mapping of small functional networks in the primate brain. This method consists of the combination of optical-fiber–based Ca2+ recordings with bulk loading of fluorescent Ca2+ indicators (9) that can be used to record Ca2+ signals reflecting the correlated activity of a cluster of neurons within a local domain with a diameter of a few hundred micrometers (e.g., ref. 10). Investigations in many animal species have demonstrated that action potential activity is closely reflected by such neuronal Ca2+ signals (e.g., refs. 8, 11–13). Thus, the use of optical-fiber–based recordings could shed light on the intrinsic functional organization of M1 circuits during the motor components of the somatosensory detection task (14, 15) and other tasks requiring motor responses (1, 3, 16–18).
Results
In Vivo Staining of the Brain Tissue and Fixation of the Optical Fiber.
One monkey (Macaca mulatta), trained to perform a somatosensory detection task (Materials and Methods), was used to assess neuronal Ca2+ signaling in the forelimb area of M1. In the detection task, the monkey used the free hand/arm to indicate whether the tip of a mechanical stimulator vibrated or not (14). A small recording chamber was implanted above the representation of the forelimb area of M1, previously identified with the use of electrophysiological recordings and ICM techniques. Extracellular recordings in the forelimb area of M1 indicated that most of the recorded neurons modulated their firing rates during the motor components of the task. For example, the recorded neurons of the forelimb contralateral to the responding hand/arm modulated their firing rates when the monkey initiated a movement to indicate detection of the probe tip in the skin of the stimulated hand and when the animal initiated a movement to one of the two push buttons to report whether the probe tip vibrated or not (15). In agreement with previous studies (2), ICM experiments elicited forelimb movements of variable amplitudes depending on the stimulus current injected in the forelimb area. These experiments paved the way for recording the neuronal Ca2+ signaling in the forelimb area while the monkey performed the detection task.
Fig. 1A shows schematically the diagram of the optic-fiber–based recording setup that was used for the present experiments. The setup includes two changes compared with the apparatus that was used originally (9). First, instead of one optical fiber, the new setup consisted of two optical fibers, each capable of independently delivering the light for locally exciting the fluorometric Ca2+ indicator Oregon green 488 BAPTA 1-AM esther (OGB1-AM) and also for recording the emitted light from the respective site. Second, each fiber was equipped with an attached fine tungsten electrode that was used for ICM. A further modification was the use of avalanche photodiodes for emitted light detection instead of photomultipliers (9), a change that improved the signal-to-noise ratio of the detected Ca2+ transients. The scheme in Fig. 1B illustrates the experimental arrangement used for controlled delivery of the fluorometric Ca2+ indicator (typically OGB-1 AM) (Materials and Methods). A sharpened stainless steel canula (Materials and Methods) was carefully glued to one optical fiber and attached to a micromanipulator. This device was lowered ∼1 mm below the cortical surface of the head-fixed, but awake monkey. Then, 0.5 mL of the Ca2+ indicator mix (Materials and Methods) was applied by a brief pressure pulse. This method of dye application into the cortex of primates represents an adapted variant of the previously described targeted bolus-loading method of Ca2+ indicator dyes (11, 19).
Fig. 1.

Experimental arrangement and calcium dye loading in monkey brain in vivo. (A) Scheme of the recording setup with two optical fibers combined with two microelectrodes for stimulation of the neurons and detection of spike activity. APD, avalanche photo diode; ND, neutral density. (B) Arrangement for multicell bolus loading of the tissue consisting of the staining pipette for application of the Ca2+-sensitive dye solution and an optical fiber. The green area indicates the region stained with the dye and the blue area, the volume of the tissue illuminated by the excitation light delivered from the optical fiber. (C) Fluorescence emission (Em) of the tissue after application of the dye containing solution monitored with the optical fiber. The excitation energy (Ex) given in arbitrary units (a.u.) was identical at all time points. (D) Plot of the increase of the fluorescence versus time after dye application. (E) Background fluorescence signal of the stained tissue before and after fixation of the optical fiber with agarose and acrylic glue.
As previously described for the mouse brain (19, 20), the Ca2+ indicator dye of OGB-1 AM will accumulate in neurons immediately after the ejection pulse, as indicated by the steep increase in fluorescence (Fig. 1 C and D). We found that in the monkey brain, the loading of OGB-1 AM is as efficient as, for example, in mice (19), being completed within 30–35 min after ejection (Fig. 1D). Such an efficient loading was observed in four of six experiments. In two instances, we observed after dye ejection only a very modest increase in fluorescence. In these cases, no Ca2+ responses were detected, and signs of intracortical bleeding were encountered. We concluded that in these experiments microvessels were locally damaged by the tip of our application/detection tool. A frequent problem in these experiments is that heart-beat–associated brain pulsations produce movement artifacts of the fluorescence signal (Fig. 1E, Upper). A simple solution for this problem consisted in the fixation of the optical fiber within the small recording chamber by first applying a layer of melted agarose. After the solidification of the agarose, a second layer of acrylic glue was applied. This procedure resulted in a very effective reduction of the pulsation noise (Fig. 1E, Lower).
Inducing Calcium Signals and Arm Movements by Microstimulation.
Previous work by other laboratories (4, 5, 21, 22) has used ICM in M1 for the establishment of stimulation maps. However, the assessment of the degree of local neuronal activation within the circuitry surrounding the electrode remained difficult. By using combined optic fiber/ICM devices (Figs. 1A and 2A), we determined the relation between neuronal Ca2+ signaling in the M1 and the behavioral consequences. For this purpose, the optic fiber/ICM device was placed in M1 of the right hemisphere, in the region corresponding to the left hand/arm, a region that was determined a day before this experiment by electrical unit recordings (18).
Fig. 2.

Relation between distance of arm movement and magnitude of local cortical activity. (A) Experimental arrangement for electrical microstimulation (Stim) and the simultaneous recording of Ca2+ signals with an optical fiber (OF). (B) Consecutive trials of microstimulation-evoked neuronal Ca2+ signals in M1. Ca2+ signals represent local network activity and were evoked by burst stimulation (eight pulses at 100 Hz, 30 µA). Site of recording/stimulation was in M1 at 3 mm below the cortical surface. (C) Relation between arm movements and Ca2+ signals. The image indicates the resting position of the arm. The stimulation strength of 17 µA evoked a small Ca2+ signal (Upper Right) but no arm movement (Upper Left). At higher stimulation strengths, there is a proportional increase of the movement vector (of constant direction) with the amplitude of the Ca2+ signals. Each stimulus consisted of a burst of four pulses at 100 Hz. (D and E) Plots indicating the linear relations between the stimulation strengths and the amplitudes of the Ca2+ signal (D) and the relations between the Ca2+ signal and the distance of the arm movements (E), respectively. (F) The rise times and decay times of Ca2+ signals were constant for each stimulation pulse. Each data point represents the average of five experimental sessions. The red arrows indicate the stimulus threshold for movements. Note that for some points the error bars are smaller than the symbols.
First, we established the lowest number of ICM stimuli (Fig. S1) that evoke movements of the contralateral arm. We applied 1–16 stimuli and found that a train of 4 stimuli (25 µA each) with 100 Hz was necessary to induce upward movements. Trains of 16 stimuli evoked movements with a distance of 13.1 ± 0.3 cm (n = 5). All ICMs produced Ca2+ transients with a rapid rise and a slower decay phase (Fig. S1). These Ca2+ transients are similar to the spontaneous Ca2+ transients detected in the mouse cortex and reflect a compound Ca2+ signal from the locally activated neurons and the surrounding neuropil (9, 10) and can be distinguished from astrocytic signals (23). Fig. 2B shows that repeated stimulation produced transients that were highly reproducible in amplitude and in time course. One reason for this high degree of reproducibility was the virtual absence of spontaneous Ca2+ transients, and thus of “noise,” in awake, but not moving monkeys (see below). The absence of Ca2+ transients indicates the absence of correlated local network activity in the region from which the optical fiber detects fluorescence changes. It is important to emphasize that uncorrelated action potential firing will not produce Ca2+ transients that are detected by the optic fiber system (9). Varying the current applied with the microelectrodes resulted in Ca2+ signals with amplitudes depending on the stimulation strength. Increasing the current amplitude elicited larger transients (Fig. 2 C–E) due to the activation of an increasing number of neurons, whereas the rise times of 62.4 ± 0.72 ms (n = 46 transients) and decay time constants of 461.6 ± 14 ms (n = 32 transients) were not affected by the stimulation strengths (Fig. 2F). A stimulus amplitude of 25 µA was necessary to induce detectable arm twitches and on stimulation with 50 µA, movements with a distance of 5.17 ± 2.6 cm (n = 9) were observed.
Activation of Neurons by Microstimulation Is Local.
Based on previous targeted bulk loading of Ca2+ indicators in combination with two-photon imaging (19) or optic fiber experiments (9), we expected the stained cortical region to not exceed a diameter of 0.5 mm. Thus, the signals recorded in Fig. 2 are generated within a small local neuronal network. However, the results do not exclude a much more extended activation of M1. To test whether the activity underlying the movement was generated in a local cluster of neurons or, alternatively, in a more widely distributed network, we performed an experiment in which two optical fiber/electrical stimulation devices were inserted 4 mm away into M1 of the right hemisphere. As the optical fibers collect light from stained neurons within a diameter of at least 300–400 µm (19), the effective interval between the two recording sites was about 3.5 mm. After loading the Ca2+ indicator dye OG-1 or OG-2 AM at each site, we inserted the optical fiber/stimulation electrode devices (Fig. 3A). We verified the specificity of the two recording sites by showing that local excitation of the fluorescent Ca2+ indicator produced a response only at the site of excitation and not at the opposite recording site (Fig. 3B). Next, we stimulated alternatively one site (Stim 1, blue) and then the other site (Stim 2, red). We found that the stimulation at site one produced a large local Ca2+ signal that was nearly completely restricted to the site of stimulation (Fig. 3D) and a movement as indicated in Fig. 3C. Conversely, stimulation at site two produced a local Ca2+ signal at that site (Fig. 3D) and a distinctly different movement (Fig. 3C). The Ca2+ signals as well as the direction of the movements were highly reliable (Fig. 3 E and F). Similar observations were systematically observed during different experimental trials (n = 4). These results provide clear evidence that local clusters of neurons and not distributed circuits initiate specific movements in the awake monkey.
Fig. 3.

Ca2+ signals restricted to local cortical domains determine specific movements. (A) Scheme of the experimental arrangement for applying current pulses and recording Ca2+ signals simultaneously from two distinct locations of the primary motor cortex. (B, Upper) Delivery of stimulation light through optical fiber 1 (OF1, 488 nm, black trace), produced Ca2+ dye-dependent fluorescence signal (blue), but no response was detected by optical fiber 2 (OF2, red). (Lower) Opposite result when stimulation through OF2. (C) Distinct arm movements produced by microstimulation at two sites (Stim1 and Stim2) in M1. Stim1: burst of eight pulses at 100 Hz, 25 µA; Stim 2: burst of eight pulses at 100 Hz, 30 µA. The image indicates the resting position of the arm. (D) The local Ca2+ signals corresponding to the movements shown in C. (E and F) The average movement vectors (n = 4) and the corresponding superposition of four consecutive local domain Ca2+ signals, as in C and D, respectively.
Calcium Signals During Simple Voluntary and Task-Related Complex Movements of the Monkey.
To monitor Ca2+ signals corresponding to voluntary movements, the monkey was placed in its chair and prepared to perform the vibrotactile detection task (Fig. 4A and Materials and Methods). Two optical fibers were implanted at a distance of 4 mm into the same region of the right M1 as before. Recording of the fluorescence signal in periods without apparent movements of the monkey revealed no Ca2+ signals (Fig. 4B). While waiting for the detection task to start, the monkey from time to time performed voluntary movements of the left arm toward the push buttons and back to the starting position (Fig. 4C). These movements were part of the trained trajectories the monkey had to perform during the behavioral task. In Fig. 4D, the Ca2+ signals detected during such movements are shown. They had slower rise times and lower amplitudes compared with the ones elicited by ICM. In contrast to the unique appearance of the stimulus-evoked Ca2+signals at both detection positions the pairs of signals that correlated with the voluntary movements had different shapes.
Fig. 4.
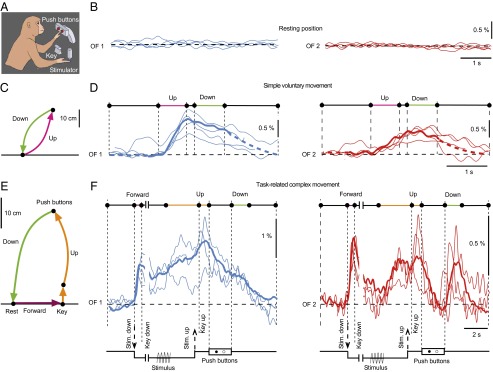
Local domain-specific Ca2+ signals recorded during trained complex movements. (A) Schematic of the setup for the vibrotactile detection task (Materials and Methods). (B) Absence of Ca2+ signals, both in OF1 and OF2, in the absence of arm movements. (C) Trajectory of a simple voluntary movement of the left arm to push buttons (up) and back to the resting position (down). (D) Ca2+ signals corresponding to the movement indicated in C. Superimposed individual traces (four each) and the average traces (n = 7, thick lines) recorded simultaneously at two distinct sites in M1 with the optical fibers OF1 (blue) and OF2 (red). (E) Trajectory of a task-related complex movement of the left arm from rest to the key, then to the push buttons and then back to rest. (F) Ca2+ signals corresponding to the movement indicated in E. Superimposed individual traces (three each) and the average traces (n = 10, thick lines). The schemes at the bottom of the traces indicate the sequential steps of the behavioral task.
Finally, we recorded Ca2+signals during the trained movement sequence the monkey performed in the detection task (Fig. 4E). These signals had shapes with peaks overlapping with the initiation of movements of the arm into certain directions (Fig. 4F). For example, the forward movement of the arm to the key was correlated with Ca2+signals detected at both fiber implantation positions. On the other hand, the down movement of the arm after pushing one of the buttons was correlated with a Ca2+ signal in the position only where optical fiber 2 was implanted. For the analysis, only trials in which a vibrating stimulus was applied to the fingertip were included.
Discussion
In the present study, we introduce optic fiber calcium recordings as a versatile tool for the analysis of brain activity in behaving primates. As in other mammalian species (12, 13, 19), neuronal activity in the primate brain is associated with large Ca2+ signals (8). The method used here is an improved and adapted technique that was initially used for recordings in the mouse brain (9). It involves an optic-fiber–based system with two or more fine optical fibers. Each fiber is operated independently and used for both fluorescence excitation and the recording of the emitted, Ca2+-dependent fluorescence. Importantly, the method bridges the gap between (electrical or optical) single-cell recordings and the larger-scale recordings, like EEG. Specific features of the method are that it records strictly from the local clusters of cells that were labeled with the Ca2+ indicator dye and that the recorded neuronal signals result exclusively from action potential activity, but not from subthreshold depolarization. The Ca2+ signal detected by each fiber is collected from a local domain with a diameter of about 300–400 µm (9, 10, 24). The specific size of the domain depends on the dimensions of the cortical region that was stained with the Ca2+ indicator, but also on the intensity of the excitation light and the collection efficiency of emitted fluorescence by the optical fiber. The activity-dependent Ca2+ signal is produced by the axons located in the neuropile (12) and the neurons within the illuminated local domain (10). It has been estimated that, in the mouse brain, at least 20–30 neurons need to be synchronously active to produce a Ca2+ signal that can be detected by the optical fiber (10). Because the primate cortex, the size of neuronal somata, is not dramatically different (e.g., ref. 25), a similar sensitivity of the optical fiber is expected.
The main finding of this study is that simple, stereotypical movements initiated by ICM are associated with neuronal activity that is largely restricted to the stimulated domain (Figs. 2 and 3). Increasing the stimulation intensity resulted both in an increased amplitude of the movement and an increase of the amplitude of the Ca2+ transients. This indicates that the larger movement is directly related to an increased number of active neurons within the local domain and/or, alternatively, with an increased activity level of the relevant neurons within the domain. Importantly, in no instance was activity detected by the second fiber that collected the fluorescence signal about 2–4 mm away in a domain that initiated a distinctly different type of movement (Fig. 3). The local cortical specificity of neuronal activity for distinct movements was also preserved for trained, voluntary movements. Whereas the Ca2+ signaling pattern at each recording site became more complex in line with the increased complexity of the movement patterns, the local activity remained highly site specific and largely reproducible from trial to trial (Fig. 4). Together, the recordings provide direct support that M1 is functionally organized in domains of neurons that will preferentially fire during distinct movements.
In conclusion, our study introduces a simple method for the detection of neuronal activity in local cortical (and subcortical) domains that can be readily used in awake, behaving nonhuman primates. The method can also be easily combined with optogenetics (24) and used for the selective activation or silencing of neurons in the respective domains (26). Moreover, the optic-fiber–based Ca2+ recordings with a high temporal resolution (and not involving any devices that are sensitive to magnetic fields) may be combined with fMRI recordings (23). An important and very promising variant of the method will involve the use of genetically encoded Ca2+ sensors. The use of these sensors will make the recordings easier and, importantly, facilitate recordings in specific cell types. For example, they can allow a direct comparison of the activity of excitatory and inhibitory neurons within the same cortical region (27, 28).
Materials and Methods
Animal and Detection Task.
The monkey was handled according to institutional standards of the National Institutes of Health and the Society for Neuroscience. Protocols were approved by the Institutional Animal Care and Use Committee of the Instituto de Fisiología Celular. In the vibrotactile task, the stimuli were delivered to the skin of the distal segment of one digit of the restrained hand, via a computer-controlled stimulator (BME Systems; 2-mm round tip). Initial probe indentation was 500 µm. Vibrotactile stimuli consisted of trains of 20-Hz mechanical sinusoids with amplitudes of 2.3–34.6 µm (14). These were interleaved with an equal number of trials where no mechanical vibrations were delivered to the skin (amplitude = 0). The animal pressed one of two push buttons to indicate stimulus present (left button) or stimulus absent (right button). It was rewarded with a drop of liquid for correct responses. Performance was quantified through psychometric techniques (14).
Staining Procedure.
After opening the skull with dental drills, a stainless steel chamber with an inner diameter of 7.2 mm and a height of 4 mm was implanted above the forelimb area of the primary motor cortex on the right hemisphere and fixed with acrylic glue (E.I. du Pont de Nemours). Care was taken not to damage the dura. A few drops of saline were applied to prevent the dura from drying. A day before the calcium recordings, the right position of the chamber was verified by recording of spike activity during arm movements as described in ref. 29. The dye-containing solution was prepared as described in ref. 19. Briefly, the cell permeant acetoxymethyl (AM) ester of either Oregon green 488 BAPTA-1 or BAPTA-2 (Molecular Probes) AM was dissolved in a mixture of DMSO and pluronic acid F-127 80/20 (% vol/vol) to a dye concentration of 10 mM. The stock solution was diluted in a buffer containing (in mM): 150 NaCl, 2.5 KCl, 10 Hepes, resulting in a final dye concentration of 0.5 mM.
A hand-held drill (1.5 mm diameter) was used to gently perforate the dura. A staining pipette (150 µm diameter, connected with fine tubing to a 10-µL Hamilton syringe) was attached to a micromanipulator and lowered into the cortex through the perforation to a depth of about 3 mm. The staining pipette was inserted either alone or in combination with a optical fiber that was tightly glued to it (Fig. 1B). After positioning of the staining pipette, 0.5–1 µL calcium indicator dye containing solution was released into the brain tissue.
Calcium Recordings.
The device for recording of population calcium signals with one optical fiber described in ref. 9 was developed into a system with two optical fibers (Fig. 1A). This modification allowed us to detect neuronal activity from two positions in the brain simultaneously. The excitation light beam delivered from the 10 mW Sapphire laser (Coherent, Inc.) was focused into the ends of two multimode fibers of 200-µm diameter and a numerical aperture of 0.48 (Thorlabs). The emitted fluorescence light was collected with the same optical fibers and detected with avalanche photo-diodes S5343 (Hamamatsu Photonics) with an aperture of 1 mm. Signals were low-pass filtered at 300 Hz and digitized with a sampling frequency of 2,000 or 5,000 Hz using a multifunction input/output device USB-6221 (National Instruments) and custom-written LabView-based software. In the experiments in which the optical fiber was not attached to the staining pipette, it was lowered some 20 min after staining into the same canal with a micromanipulator to the depth of the maximal fluorescence intensity. Fixation of the optical fibers was performed by first covering the dura with a 2-mm layer of about 1% agarose (Sigma-Aldrich). After hardening, the chamber was filled with acrylic glue and the fiber was released from the micromanipulator. During recordings, the fiber was held loosely above the head of the animal. At the end of the experiments, the chamber was cleaned, filled with saline containing antibiotics, and sealed with a stainless steel cap.
Unit Recording and Microstimulation.
To identify the forelimb representation of the primary motor cortex, we used electrophysiological recordings and ICM criteria. Neuronal recordings were made with an array of seven independent, movable microelectrodes (impedance 0.5–0.6 MΩ) inserted transdurally (29) into the forelimb movement representation of the primary motor cortex. ICM was performed by using a computer-controlled pulse generator (Coulbourn Instruments) arranged in series with an optical stimulus isolation unit. We used biphasic current pulses, with the cathodal phase leading each pulse. Each phase lasted 0.2 ms, with 0.05 ms between phases (29) at a frequency of 100 Hz.
Behavioral and Data Analysis.
During the experiments, arm movements were filmed using a HI-8 video camera. Video movies and the calcium recordings were aligned by turning the illumination on and off in the experimental room, resulting in dark periods on the videos and corresponding deflections in the optical fiber recordings. Distance of movements was measured offline on the screen and converted into the real length in centimeters.
Digitized data were low-pass filtered offline either with 20 Hz (in the ICM recordings) or with 3 Hz (in the detection task experiments), base-line corrected, and evaluated using IgorPro software. Values are given as mean ± SEM.
Supplementary Material
Acknowledgments
A.K.’s research was supported by the Schiedel Foundation and R.R.’s research was partially supported by grants from the Dirección de Personal Académico de la Universidad Nacional Autónoma de México and the Consejo Nacional de Ciencia y Tecnología.
Footnotes
The authors declare no conflict of interest.
This article contains supporting information online at www.pnas.org/lookup/suppl/doi:10.1073/pnas.1321612111/-/DCSupplemental.
References
- 1.Kakei S, Hoffman DS, Strick PL. Muscle and movement representations in the primary motor cortex. Science. 1999;285(5436):2136–2139. doi: 10.1126/science.285.5436.2136. [DOI] [PubMed] [Google Scholar]
- 2.Asanuma H, Rosén I. Topographical organization of cortical efferent zones projecting to distal forelimb muscles in the monkey. Exp Brain Res. 1972;14(3):243–256. doi: 10.1007/BF00816161. [DOI] [PubMed] [Google Scholar]
- 3.Georgopoulos AP, Kalaska JF, Caminiti R, Massey JT, Massey JT. On the relations between the direction of two-dimensional arm movements and cell discharge in primate motor cortex. J Neurosci. 1982;2(11):1527–1537. doi: 10.1523/JNEUROSCI.02-11-01527.1982. [DOI] [PMC free article] [PubMed] [Google Scholar]
- 4.Graziano MSA, Taylor CS, Moore T. Complex movements evoked by microstimulation of precentral cortex. Neuron. 2002;34(5):841–851. doi: 10.1016/s0896-6273(02)00698-0. [DOI] [PubMed] [Google Scholar]
- 5.Graziano MSA, Aflalo TNS, Cooke DF. Arm movements evoked by electrical stimulation in the motor cortex of monkeys. J Neurophysiol. 2005;94(6):4209–4223. doi: 10.1152/jn.01303.2004. [DOI] [PubMed] [Google Scholar]
- 6.Georgopoulos AP, Merchant H, Naselaris T, Amirikian B. Mapping of the preferred direction in the motor cortex. Proc Natl Acad Sci USA. 2007;104(26):11068–11072. doi: 10.1073/pnas.0611597104. [DOI] [PMC free article] [PubMed] [Google Scholar]
- 7.Huntley GW, Jones EG. Relationship of intrinsic connections to forelimb movement representations in monkey motor cortex: A correlative anatomic and physiological study. J Neurophysiol. 1991;66(2):390–413. doi: 10.1152/jn.1991.66.2.390. [DOI] [PubMed] [Google Scholar]
- 8.Nauhaus I, Nielsen KJ, Disney AA, Callaway EM. Orthogonal micro-organization of orientation and spatial frequency in primate primary visual cortex. Nat Neurosci. 2012;15(12):1683–1690. doi: 10.1038/nn.3255. [DOI] [PMC free article] [PubMed] [Google Scholar]
- 9.Adelsberger H, Garaschuk O, Konnerth A. Cortical calcium waves in resting newborn mice. Nat Neurosci. 2005;8(8):988–990. doi: 10.1038/nn1502. [DOI] [PubMed] [Google Scholar]
- 10.Grienberger C, et al. Sound-evoked network calcium transients in mouse auditory cortex in vivo. J Physiol. 2012;590(Pt 4):899–918. doi: 10.1113/jphysiol.2011.222513. [DOI] [PMC free article] [PubMed] [Google Scholar]
- 11.Brustein E, Marandi N, Kovalchuk Y, Drapeau P, Konnerth A. “In vivo” monitoring of neuronal network activity in zebrafish by two-photon Ca(2+) imaging. Pflugers Arch. 2003;446(6):766–773. doi: 10.1007/s00424-003-1138-4. [DOI] [PubMed] [Google Scholar]
- 12.Kerr JN, Greenberg D, Helmchen F. Imaging input and output of neocortical networks in vivo. Proc Natl Acad Sci USA. 2005;102(39):14063–14068. doi: 10.1073/pnas.0506029102. [DOI] [PMC free article] [PubMed] [Google Scholar]
- 13.Ohki K, Chung S, Ch’ng YH, Kara P, Reid RC. Functional imaging with cellular resolution reveals precise micro-architecture in visual cortex. Nature. 2005;433(7026):597–603. doi: 10.1038/nature03274. [DOI] [PubMed] [Google Scholar]
- 14.de Lafuente V, Romo R. Neuronal correlates of subjective sensory experience. Nat Neurosci. 2005;8(12):1698–1703. doi: 10.1038/nn1587. [DOI] [PubMed] [Google Scholar]
- 15.de Lafuente V, Romo R. Neural correlate of subjective sensory experience gradually builds up across cortical areas. Proc Natl Acad Sci USA. 2006;103(39):14266–14271. doi: 10.1073/pnas.0605826103. [DOI] [PMC free article] [PubMed] [Google Scholar]
- 16.Aflalo TN, Graziano MS. Relationship between unconstrained arm movements and single-neuron firing in the macaque motor cortex. J Neurosci. 2007;27(11):2760–2780. doi: 10.1523/JNEUROSCI.3147-06.2007. [DOI] [PMC free article] [PubMed] [Google Scholar]
- 17.Hernández A, et al. Decoding a perceptual decision process across cortex. Neuron. 2010;66(2):300–314. doi: 10.1016/j.neuron.2010.03.031. [DOI] [PubMed] [Google Scholar]
- 18.Salinas E, Romo R. Conversion of sensory signals into motor commands in primary motor cortex. J Neurosci. 1998;18(1):499–511. doi: 10.1523/JNEUROSCI.18-01-00499.1998. [DOI] [PMC free article] [PubMed] [Google Scholar]
- 19.Stosiek C, Garaschuk O, Holthoff K, Konnerth A. In vivo two-photon calcium imaging of neuronal networks. Proc Natl Acad Sci USA. 2003;100(12):7319–7324. doi: 10.1073/pnas.1232232100. [DOI] [PMC free article] [PubMed] [Google Scholar]
- 20.Garaschuk O, et al. Optical monitoring of brain function in vivo: From neurons to networks. Pflugers Arch. 2006;453(3):385–396. doi: 10.1007/s00424-006-0150-x. [DOI] [PubMed] [Google Scholar]
- 21.Graziano MSA, Patel KT, Taylor CSR. Mapping from motor cortex to biceps and triceps altered by elbow angle. J Neurophysiol. 2004;92(1):395–407. doi: 10.1152/jn.01241.2003. [DOI] [PubMed] [Google Scholar]
- 22.Schieber MH, Hibbard LS. How somatotopic is the motor cortex hand area? Science. 1993;261(5120):489–492. doi: 10.1126/science.8332915. [DOI] [PubMed] [Google Scholar]
- 23.Schulz K, et al. Simultaneous BOLD fMRI and fiber-optic calcium recording in rat neocortex. Nat Methods. 2012;9(6):597–602. doi: 10.1038/nmeth.2013. [DOI] [PubMed] [Google Scholar]
- 24.Stroh A, et al. Making waves: Initiation and propagation of corticothalamic Ca2+ waves in vivo. Neuron. 2013;77(6):1136–1150. doi: 10.1016/j.neuron.2013.01.031. [DOI] [PubMed] [Google Scholar]
- 25.Altemus KL, Lavenex P, Ishizuka N, Amaral DG. Morphological characteristics and electrophysiological properties of CA1 pyramidal neurons in macaque monkeys. Neuroscience. 2005;136(3):741–756. doi: 10.1016/j.neuroscience.2005.07.001. [DOI] [PubMed] [Google Scholar]
- 26.Diester I, et al. An optogenetic toolbox designed for primates. Nat Neurosci. 2011;14(3):387–397. doi: 10.1038/nn.2749. [DOI] [PMC free article] [PubMed] [Google Scholar]
- 27.Akerboom J, et al. Optimization of a GCaMP calcium indicator for neural activity imaging. J Neurosci. 2012;32(40):13819–13840. doi: 10.1523/JNEUROSCI.2601-12.2012. [DOI] [PMC free article] [PubMed] [Google Scholar]
- 28.Tian L, Hires SA, Looger LL. Imaging neuronal activity with genetically encoded calcium indicators. Cold Spring Harb Protoc. 2012;2012(6):647–656. doi: 10.1101/pdb.top069609. [DOI] [PubMed] [Google Scholar]
- 29.Romo R, Hernández A, Zainos A, Salinas E. Somatosensory discrimination based on cortical microstimulation. Nature. 1998;392(6674):387–390. doi: 10.1038/32891. [DOI] [PubMed] [Google Scholar]
Associated Data
This section collects any data citations, data availability statements, or supplementary materials included in this article.