

Abstract
Time-dependent increases in cue-induced sucrose seeking after forced abstinence have been described in rats with a history of sucrose self-administration, suggesting sucrose craving “incubates”. In the present study, we examined whether the incubation of craving generalizes to the artificial sweetener, saccharin.
Thirty-one male Long-Evans rats lever pressed for 0.3% saccharin solution 1 h/day for 10 days. On either Day 1 or 30 of forced abstinence, rats responded for 1 h for presentation of a tone + light cue previously presented with every saccharin delivery during self-administration training.
Rats responded more during this cue-reactivity test session following 30 vs. 1 day of forced abstinence (“incubation of craving”). This result is the first demonstration of the “incubation of saccharin craving” and suggests that a post-ingestive caloric consequence of self-administration is not a necessary condition for the development of incubation of sucrose craving.
We also examined the time course (within-session decreases) of active-lever responding during the 1-h cue-reactivity test session. Rats in the Day 30 group responded more than rats in the Day 1 group from the beginning of the test session. In addition, within-session decreases in responding were shallower in slope in the Day 30 than the Day 1 group. These results indicate that “incubation of saccharin craving” enhances the persistence of seeking behavior.
Keywords: addiction, craving, incubation, regression, saccharin, sucrose
Introduction
Incubation of drug craving has been identified in rodents, in which time-dependent increases in cue-induced drug seeking are observed after abstinence from drug self-administration (see Pickens et al., 2011, for review). Craving has been operationally defined as rats responding for (seeking) a cue associated with reinforcement (Grimm, Kruzich, & See, 2000; Markou et al., 1993). Recently, incubation of craving has also been observed in rats with a history of oral sucrose self-administration (e.g., Grimm et al., 2013; see Grimm, 2011, 2012 for reviews). In these studies, rats self-administer sucrose during 10 daily sessions in which each sucrose delivery into a liquid drop receptacle is paired with a discrete tone + light cue. Responding for a cue previously associated with sucrose increases from 1 to 30 days following self-administration training. Examining the incubation of sucrose craving is informative to the question of how craving changes over time, and could reveal treatment strategies for chronic relapsing disorders such as eating disorders.
Non-caloric, high-intensity sweeteners are substituted for added sugars in a variety of foods. However, to the best of our knowledge, no study has investigated whether artificial sweetener seeking increases over time away from the sweetener. The first question of this study was, then, whether the incubation of craving generalizes to the artificial sweetener, saccharin. If incubation of craving generalizes to saccharin, this would mean that the post-ingestive caloric consequences of sucrose self-administration are not a necessary condition for the development of incubation of sucrose craving. In addition, it has been repeatedly demonstrated that consuming non-caloric high-intensity sweeteners results in an increase, rather than a decrease, in body weight (Davidson, Martin, Clark, & Swithers, 2011; de Matos Feijo et al., 2013; Swithers, Baker, & Davidson, 2009; Swithers & Davidson, 2008; Swithers, Martin, Clark, Laboy, & Davidson, 2010; see Swithers, Martin, & Davidson, 2010 for review). Therefore, understanding of seeking behaviors for a non-caloric sweetener could also be important to improve weight control.
The second purpose of this study was to analyze the within-session pattern of responding for a cue previously associated with the primary reinforcer (i.e., saccharin). Such a cue is considered a secondary reinforcer. It has been well documented that responding for primary reinforcers does not remain constant within experimental sessions, even when no obvious independent variable is manipulated (e.g., McSweeney & Murphy, 2009). Rate of responding (number of responses per unit time) may increase, decrease, or increase and then decrease during sessions of operant conditioning (McSweeney, Hinson, & Cannon, 1996). It is not known if there are similar within-session changes in responding for a secondary reinforcer. Analysis of within-session patterns is important because it provides us with information about the persistence of behavior. For example, if within-session decreases in responding are steeper in a 1-day abstinence condition than in a 30-days abstinence condition, the data may mean that “incubation of craving” enhances the persistence of seeking behavior. Craving is one of the definitional characteristics of substance use disorders (American Psychiatric Association, 2013), and thus examining persistence of seeking behavior, an animal model of craving, is important in gaining an understanding of the nature of saccharin craving and food craving in general.
Several attempts have been made to describe within-session response curves by best-fit equations (e.g., Bousfield, 1935; Killeen, 1995; McCleery, 1977; McSweeney et al., 1996; Skinner, 1932). In all cases, behavior was treated as a function of time elapsed within a session. As an alternative, Aoyama (1998) treated within-session decreases in responding as a function of the cumulative number of reinforcer deliveries within a session. It was shown that a linear equation adequately described within-session decreases in responding during a continuous reinforcement (CRF) schedule. That is, rates of responding decreased proportionally to the increase in cumulative number of reinforcer deliveries.
This relationship can be described as Equation 1.
| (1) |
where Ic is cumulative amount of intake (i.e., cumulative number of reinforcer deliveries), a and b are free parameters, and Rr is response rate. Response rate stands for number of responses per unit time. Parameter a is the y-axis intercept of the regression line. This parameter indicates response rate at the beginning of the session. Parameter b is the slope of the regression line. This parameter represents the rate of response decrease produced by a single presentation of a reinforcer. There is another parameter that can be calculated using Equation 1: the x-axis intercept of the regression line. This parameter represents the cumulative number of reinforcer deliveries that will reduce the response rate to zero. Although it has been repeatedly demonstrated that Equation 1 can describe responding for primary reinforcers (e.g., Aoyama, 2007; 2012; Aoyama & McSweeney, 2001), Equation 1 has never been applied to responding for secondary reinforcers. Thus, in this study, Equation 1 was applied to the within-session responding for the cue previously associated with saccharin. In addition, effects of incubation of craving on the parameters of Equation 1 were examined. This was the third purpose of this study.
Methods
Subject
Thirty one male Long-Evans rats (3 months old at the start of study; Simonsen-derived) bred in the Western Washington University vivarium were housed individually on a reverse day/night cycle (lights off at 7 AM) with nutritionally balanced Purina Mills Inc. Mazuri Rodent Pellets (Gray Summit, MO, USA) and water available ad libitum except as noted below. Mazuri Rodent Pellets is a complete diet that is specially formulated for rodents. The ingredients of the diet include de-hulled soybean meal, ground corn, wheat middlings, and ground wheat. The concentrations of carbohydrates in the chow are 0.21% for fructose, 0.19% for glucose, 3.13% for sucrose and 26.08% for starch. During the forced-abstinence period (described in the procedure section), saccharin solution was not given but the chow was provided ad libitum. Thus, rats could obtain some sweet substance from the chow during the forced-abstinence period. Rats were weighed each Monday, Wednesday, and Friday for the duration of the experiment. Sixty-five hours (about 2.5 days) before the first day of training, 48 hours of a saccharin habituation period started. During this period, rats were deprived of plain water and provided saccharin solution. The concentration of saccharin solution was 0.1% for the first 24 hours and 0.3% for the last 24 hours of saccharin habituation. This procedure was conducted to acclimate rats to the saccharin solution to facilitate subsequent saccharin self-administration (SA). Immediately prior to the SA training phase, the animals were deprived of water, as well as saccharin solution, for 17 hours to encourage SA on the first day of training. Rats were then returned to ad libitum water access. All procedures followed the guidelines outlined in the “Principles of Laboratory Animal Care” (National Institutes of Health publication no. 86–23) and were approved by the Western Washington University Institutional Animal Care and Use Committee.
Apparatus
Operant training and testing took place in operant conditioning chambers (30 × 20 × 24 cm; Med Associates) containing two levers (one stationary and one retractable), a tone generator (2 kHz, 15 dB over ambient noise), a white stimulus light above the retractable lever and a red house light on the opposite wall. An infusion pump delivered saccharin into a reward receptacle to the right of the active lever for oral consumption. Four photobeams crisscrossed the chamber. Operant conditioning chambers were enclosed in sound-attenuating cabinets with ventilation fans.
Procedure
Training phase
Rats spent 1 hour/day for 10 consecutive days in the operant conditioning chambers where they were allowed to press the retractable (active) lever for a 0.2 ml delivery of 0.3% saccharin into the receptacle to the right of the lever. This concentration was chosen as a separate group of rats from this vivarium were found to prefer 0.3% over 0.1 or 0.2% in a 2 bottle preference test pilot study (data not shown). An active lever response also activated a compound stimulus consisting of the tone and the white light. The compound stimulus lasted for 5 seconds and was followed by a 40-second time out, during which presses on the active lever were recorded but had no programmed consequence. A response on the inactive (stationary) lever did not have a programmed consequence, but responses were recorded. The total number of photobeam breaks was recorded during all phases of the study. At the end of each session, rats were returned to home cages.
Forced-abstinence phase
There were 2 groups of rats in the study created by the independent variable of forced-abstinence period (1 or 30 days). The 1- or 30-day forced-abstinence phase began as the first day (“Day 1”) following the 10th day of the training phase. Rats were housed in home cages for the duration of forced abstinence. At the end of the training phase, rats (n = 14 rats/group) were assigned to one of the forced-abstinence periods (1 or 30 days). Active lever responses were matched between the groups to ensure groups did not significantly differ from one another during training.
Testing phase
On Day 1 or Day 30, rats were tested in the operant conditioning chambers for saccharin cue-reactivity (saccharin seeking). This session was identical to the 1-h training procedure, but saccharin was not delivered following a lever response.
Statistical Analyses
Training Phase
Active lever responses, number of reward deliveries, inactive lever responses and photobeam breaks during operant training were analyzed separately using two-way repeated measure (RM) analysis of variance (ANOVA) using TRAINING-DAYS (days 1–10 of training) and the between-group factor ABSTINENCE-DAYS (Day 1 or Day 30).
Testing Phase
The effects of forced-abstinence period on active lever responses, inactive lever responses, cue-presentations, and photobeam breaks were evaluated separately using t-tests.
Within-Session Changes in Active Lever Responses
In order to investigate within-session changes in active lever responses, the 60-minute cue-reactivity test sessions were divided into 6, 10-minute blocks. Active lever responses on the last day of the training phase and the testing phase were separately analyzed. First, group response rates (number of active lever responses per minute) were described as a function of time blocks. Within-session changes in responses were analyzed by a two-way RM ANOVA using TIME-BLOCKS (blocks 1 to 6) and the between-group factor ABSTINENCE-DAYS (Day 1 or Day 30). Second, response rates were described as a function of cumulative number of cue presentations. Linear regression lines (Equation 1) were calculated separately for the Day 1 and Day 30 groups. Linear regression line was also calculated for each subject. The parameters y-axis intercept, x-axis intercept, slope, and r2 were compared between the Day 1 and Day 30 groups using t-tests.
Comparison with Sucrose Craving
We compared the magnitude of “incubation of saccharin craving” shown in this study to “incubation of sucrose craving” shown in a previous experiment (Grimm, Ratliff, North, Barnes, & Collins, 2012). The effects of reinforcers (saccharin vs. sucrose) and forced abstinence period on active lever responses, inactive lever responses, cue-presentations, and photobeam breaks in the testing phase were evaluated by two-way ANOVAs using REINFORCERS (saccharin or sucrose) and ABSTINENCE-DAYS (Day 1 or Day 30) as between-group factors. Within-session changes in active lever responses in the previous (sucrose) experiment were also analyzed. Equation 1 was applied and the parameters were calculated. To compare the parameters from the present (saccharin) experiment with those form the previous (sucrose) experiment, we applied separate two-way ANOVAs using REINFORCERS (saccharin or sucrose) and ABSTINENCE-DAYS (Day 1 or Day 30) as between-group factors, to the y-axis intercepts, to the slopes, and to the x-axis intercepts.
ANOVAs and t-tests were calculated using SPSS Statistics version 20.0. Descriptive statistics were calculated in Excel 2008. Group data are presented as means ± standard errors of the means (SEMs) in the text and figures. For statistical comparisons, P < 0.05 was the criterion for statistical significance. In general, only the statistics for significant effects and interactions are indicated in the text.
Results
Of 31 rats that were trained for saccharin self-administration, 3 were removed from the study because they did not meet a minimum response criterion of acquisition of an average of 20 saccharin deliveries/day over the last 4 days of training. Final group sizes were 14 for each group.
Training Phase
Figure 1 represents the average number of active lever responses, saccharin infusions, inactive lever responses and photobeam breaks during the training phase. Active lever responses and number of saccharin infusions increased over the training phase with TRAINING-DAYS F (9, 234) values of 4.1 and 18.7, respectively, P’s < 0.001. For these measures, there were no significant effects of ABSTINENCE-DAYS with F (1, 26) values of < 1.0, and no significant interaction of TRAINING-DAYS and ABSTINENCE-DAYS with F (9, 234) values of < 1.0. Inactive lever responses decreased over the training phase with TRAINING-DAYS, F (9, 234) =7.1, P < 0.001. For this measure, there was no significant effect of ABSTINENCE -DAYS, F (1, 26) < 1.0, and no significant interaction of TRAINING-DAYS and ABSTINENCE-DAYS, F (9, 234) < 1.0. Photobeam breaks did not change significantly over the training phase with TRAINING-DAYS, F (9, 234) =1.9, P = 0.059. For this measure, there was no significant effect of ABSTINENCE -DAYS, F (1, 26) < 1.0, and no significant interaction of TRAINING-DAYS and ABSTINENCE-DAYS, F (9, 234) < 1.0.
Figure 1.

Mean daily active and inactive lever responses, saccharin infusions, and photobeam breaks during the training phase. Data points indicate means ± SEMs in the self-administration sessions totaling 1 h per day (n = 14 for each group).
Testing Phase
Figure 2 shows the average number of active lever responses, cue presentations, inactive lever responses and photobeam breaks during the testing phase. For active lever responses, there was a statistically significant difference between the Day 1 and Day 30 groups, t (26) = 4.8, P < .001. The Day 30 group responded more on the active lever than the Day 1 group, indicating an “incubation of craving”. In addition, the Day 30 group obtained more cue-presentations than the Day 1 group, t (26) = 5.1, P < .001. For inactive lever responses and photobeam breaks, the Day 30 group also showed more responses than the Day 1 group with t (26) values of 2.4 and 2.4, respectively, P’s < 0.05.
Figure 2.

Mean active and inactive lever responses, cue presentations, and photobeam breaks during the testing phase. Each bar represents a separate group of animals (n = 14 for each group). Means ± SEMs are indicated on the figure. Asterisk indicates a significant difference from the Day 1 group.
Within-session Changes in Responding During the Training Phase
Figure 3 presents the mean response rate (number of active lever responses per min) during successive 10-min blocks on the last day of the training phase. The 60-min session was divided into 6 blocks of 10 min. Active lever responses decreased during the 60-min training session with TIME-BLOCK, F (5, 130) = 7.7, P < 0.001. The main effect of ABSTINENCE-DAYS and the interaction between TIME-BLOCK and ABSTINENCE -DAYS were not significant. These results were not surprising because active lever responses were matched between the groups to ensure groups did not differ from one another during training.
Figure 3.
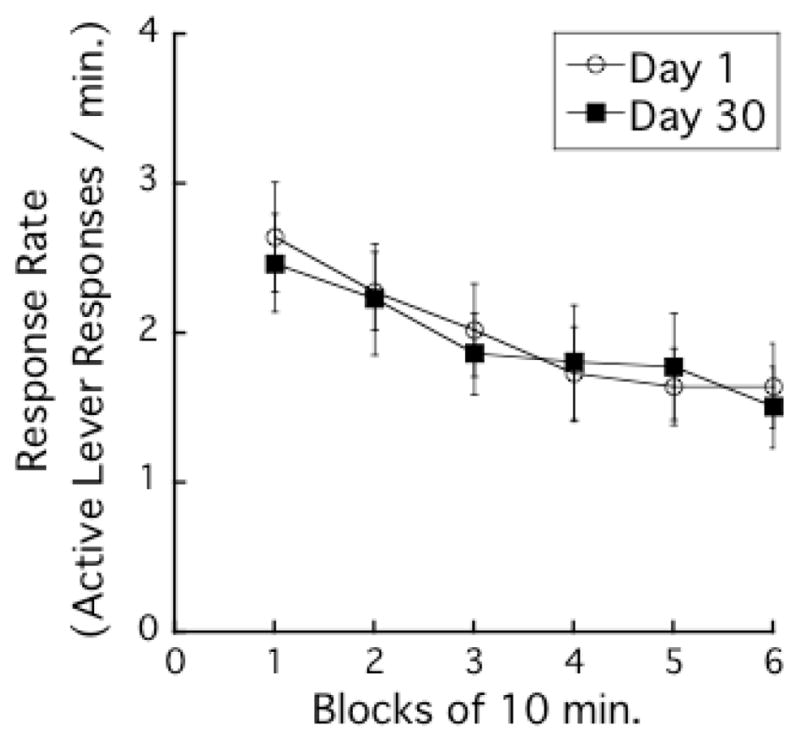
Active lever responding time courses in the last day of the training phase. The 60-min session was divided into 6 blocks of 10 min. Each data point indicates mean response rates (number of active lever responses per min) ± SEMs.
Figure 4 presents the mean response rates (number of active lever responses per min) as a function of cumulative number of saccharin (and cue) presentations. Because within-session pattern did not differ between the DAY 1 and the DAY 30 groups, data from the both groups were combined for the analysis. There was a strong linear relationship between mean response rates and cumulative numbers of saccharin (and cue) presentations, r2s > .95.
Figure 4.

Mean response rates (number of active lever responses per min) as a functions of cumulative number of cue presentations in the last day of the training phase. Each data point represents the average of the cumulative number of cue presentations at the beginning of a 10-min block, and the average of the response rate of that 10-min block.
Within-session Changes in Responding During the Testing Phase
Figure 5 presents the mean response rate (number of active lever responses per min) during successive 10-min blocks in the testing phase. The 60-min session was divided into 6 blocks of 10 min. Active lever responses decreased during the 60-min cue-reactivity test session with TIME-BLOCK, F (5, 130) = 83.0, P < 0.001. In addition, the DAY 30 group responded more than the DAY 1 group with ABSTINENCE -DAYS, F (1, 26) = 20.1, P < 0.001. The interaction between TIME-BLOCK and ABSTINENCE -DAYS was also significant, F (5, 130) = 2.8, P < 0.05.
Figure 5.
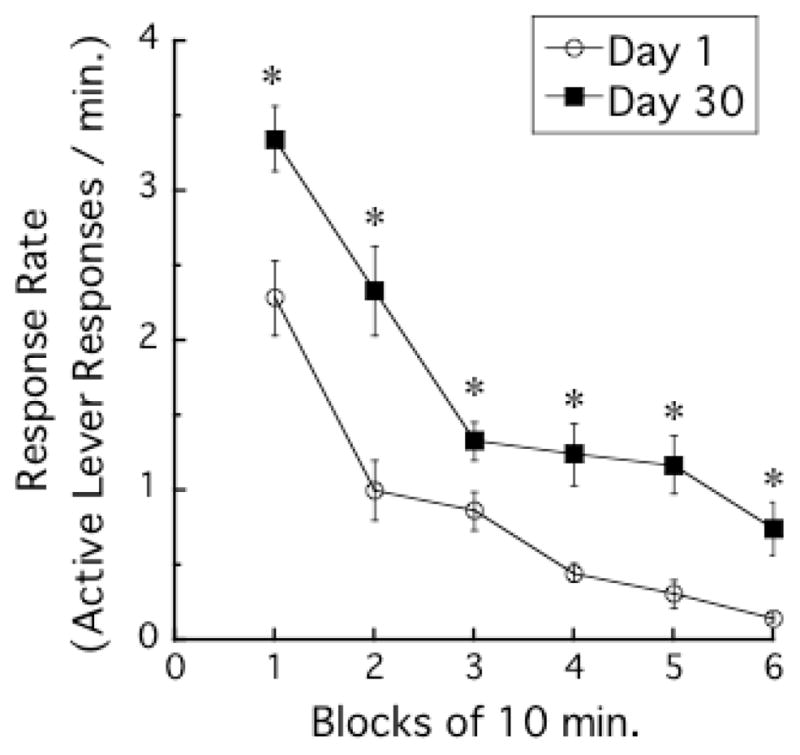
Active lever responding time courses in the testing phase. The 60-min session was divided into 6 blocks of 10 min. Each data point indicates mean response rates (number of active lever responses per min) ± SEMs. Each asterisk indicates a significant difference between Day 1 and Day 30 groups.
Figure 6 presents the mean response rates (number of active lever responses per min) as functions of cumulative number of cue presentations. There was a strong linear relationship between mean response rates and cumulative numbers of cue presentations, r2s > .91. The regression line for the Day 30 group had larger y- and x-axis intercepts than that for the Day 1 group. In addition, the slope of the regression line for the Day 30 group was slightly shallower than that for the Day 1 group.
Figure 6.
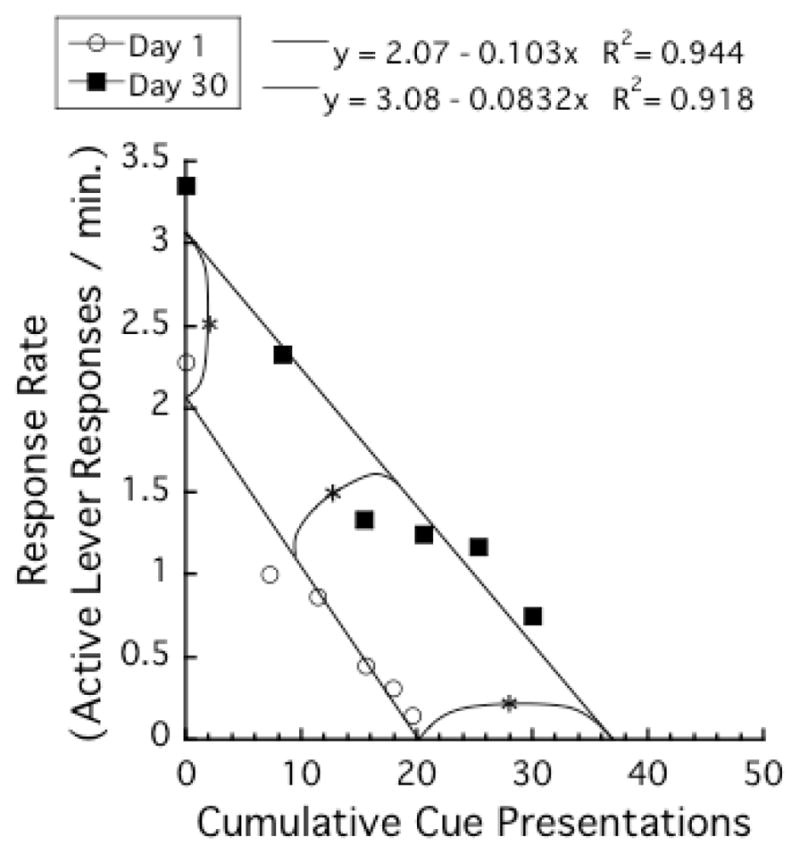
Mean response rates (number of active lever responses per min) as functions of cumulative number of cue presentations in the testing phase. Each data point represents the average of the cumulative number of cue presentations at the beginning of a 10-min block, and the average of the response rate of that 10-min block. Each asterisk indicates a significant difference between the Day 1 and the Day 30 groups in the average of y-axis intercepts, slopes, and x-axis intercepts of Equation 1.
To confirm these visual inspections about the parameters of Equation 1, we first applied Equation 1 to data from individual subjects and calculated parameters y-axis intercept, slopes, x-axis intercepts, and r2. Next, t-tests were applied to these parameters. Supporting the visual inspections, the differences were significant for y-axis intercepts, t (26) = 3.1, P < .01, for x-axis intercepts, t (26) = 4.7, P < .001, and for slopes, t (26) = 2.3, P < .05. For r2, the difference was not significant, t (26) < 1.0. Table 1 indicates the parameters of the regression lines (Equation 1) when the equation was applied to individual subjects. Note that the means of the parameters in Table 1 are slightly different from the parameters seen in Figure 6. In Figure 6, Equation 1 was applied to the average data of the Day 1 and the Day 30 groups. On the other hand, in Table 1, Equation 1 was applied to each subject and then the means of the parameters were calculated.
Table 1.
Parameters of Equation 1 and the percentage of the variance accounted for (r2) when Equation 1 was fitted to each subject
| Day 1 | Day 30 | |||||||||
|---|---|---|---|---|---|---|---|---|---|---|
|
| ||||||||||
| Subjects | y- axis | x-axis | Slope | r2 | Subjects | y- axis | x-axis | Slope | r2 | |
| A4 | 2.14 | 13.95 | 0.154 | 0.89 | A1 | 3.02 | 26.80 | 0.113 | 0.94 | |
| A5 | 1.05 | 9.75 | 0.108 | 0.66 | A2 | 2.11 | 25.05 | 0.084 | 0.89 | |
| A8 | 1.66 | 13.08 | 0.127 | 0.99 | A6 | 1.85 | 25.35 | 0.073 | 0.73 | |
| A9 | 1.04 | 14.40 | 0.072 | 0.44 | A7 | 3.12 | 41.38 | 0.075 | 0.81 | |
| A12 | 1.43 | 16.27 | 0.088 | 0.93 | A11 | 2.36 | 23.37 | 0.101 | 0.84 | |
| A14 | 2.97 | 26.40 | 0.112 | 0.98 | A13 | 4.30 | 47.13 | 0.091 | 0.69 | |
| A16 | 3.33 | 25.29 | 0.132 | 0.88 | A15 | 3.96 | 38.66 | 0.103 | 0.86 | |
| A19 | 1.44 | 30.00 | 0.048 | 0.58 | A17 | 2.84 | 52.14 | 0.054 | 0.51 | |
| A20 | 1.36 | 18.61 | 0.073 | 0.85 | A18 | 4.09 | 44.86 | 0.091 | 0.80 | |
| B1 | 3.35 | 20.34 | 0.165 | 0.78 | B2 | 3.86 | 89.38 | 0.043 | 0.54 | |
| B6 | 2.25 | 32.03 | 0.070 | 0.83 | B3 | 2.40 | 27.81 | 0.086 | 0.77 | |
| B8 | 2.86 | 33.38 | 0.086 | 0.92 | B4 | 2.40 | 33.32 | 0.072 | 0.75 | |
| B9 | 2.77 | 18.51 | 0.150 | 0.84 | B5 | 3.40 | 38.10 | 0.089 | 0.95 | |
| B11 | 2.04 | 18.14 | 0.113 | 0.82 | B7 | 3.57 | 34.60 | 0.103 | 0.92 | |
| Mean | 2.12 | 20.73 | 0.107 | 0.81 | Mean | 3.09 | 39.14 | 0.084 | 0.79 | |
Comparison with Sucrose Craving
We compared the magnitude of “incubation of saccharin craving” shown in this study to “incubation of sucrose craving” shown in a previous experiment (Grimm, Ratliff, North, Barnes, & Collins, 2012). The procedure used in the previous experiment was identical to the present experiment except for the following four differences. First, the primary reinforcer used in the SA training session was 10% sucrose solution. Second, the habituation period to the primary reinforcer before the SA training session was not applied. Third, rats were injected with saline every day of training both 5 minutes prior and 3 hours following each training session. Finally, saline injection preceded the cue-reactivity test session by 5 minutes. The final two procedures were applied because the rats were used as a control group to other drug injection conditions. We analyzed the data from this control group using the same criterion of acquisition (an average of 20 reinforcer deliveries/day over the last 4 days of training). Six of 25 control rats were removed from the analyses because they did not meet the criterion. Active lever responses in the cue-reactivity test were greater on Day 30 (96.6 ± 9.4) compared to on Day 1 (62.0 ± 7.5). We applied a two-way ANOVA using REINFORCERS (saccharin or sucrose) and ABSTINENCE-DAYS (Day 1 or Day 30) as between-group factors. The effect of ABSTINENCE-DAYS was significant with F (1, 43) = 27.7, P < 0.001. There was no significant effect of REINFORCERS and no significant interaction of REINFORCERS and ABSTINENCE-DAYS with F (1, 43) < 1.0. These results suggest that the magnitude of the incubation effect was not different between saccharin and sucrose.
For inactive lever responses and photobeam breaks, the difference between the Day 1 and Day 30 groups was comparable to the differences shown in the control group of the above-mentioned study (Grimm et al., 2012). Those control (sucrose) rats made 7.1 ± 2.2 inactive lever responses in the Day 1 group and 14.4 ± 3.5 in the Day 30 group. For photobeam breaks, the control rats made 1314.7±120.7 beam breaks in the Day 1 group and 1611.1 ± 112.9 in the Day 30 group. Two-way ANOVAs were separately applied to the two measures to compare responding between saccharin-trained and sucrose-trained rats. For inactive lever responses, the effect of ABSTINENCE-DAYS was significant with F (1, 43) = 8.2, P < 0.01. In addition, the effect of REINFORCERS was also significant with F (1, 43) = 5.3, P < 0.05, indicating that sucrose-trained rats made more inactive lever responses than saccharin-trained rats. There was no significant interaction of REINFORCERS and ABSTINENCE-DAYS with an F (1, 43) value of < 1.0. For photobeam breaks, the effect of ABSTINENCE-DAYS was significant with F (1, 43) = 8.0, P < 0.01. There was no significant effect of REINFORCERS and no significant interaction of REINFORCERS and ABSTINENCE-DAYS with F (1, 43) values < 1.0. The interaction between REINFORCERS and ABSTINENCE-DAYS was not significant for either of these measures. The non-significant interaction indicates that the magnitude of the effect of forced abstinence on inactive lever responses and photobeam breaks was similar between saccharin and sucrose-trained rats.
We were curious as to how the effects of incubation of saccharin craving on the parameters of Equation 1 would compare to the effects of incubation of sucrose craving. We applied Equation 1 to the data of the control rats in the above-mentioned previous study in which sucrose was used during the SA training sessions (Grimm et al., 2012). Figure 7 presents the mean response rates (number of active lever responses per min) as a function of cumulative number of sucrose-paired cue presentations. There was a strong linear relationship between mean response rates and cumulative number of cue presentations, r2s > .94. As seen in the present study with saccharin, the regression line for the Day 30 group had larger y- and x-axis intercepts than that for the Day 1 group. In addition, the slope of regression line for the Day 30 group was shallower than that for the Day 1 group.
Figure 7.
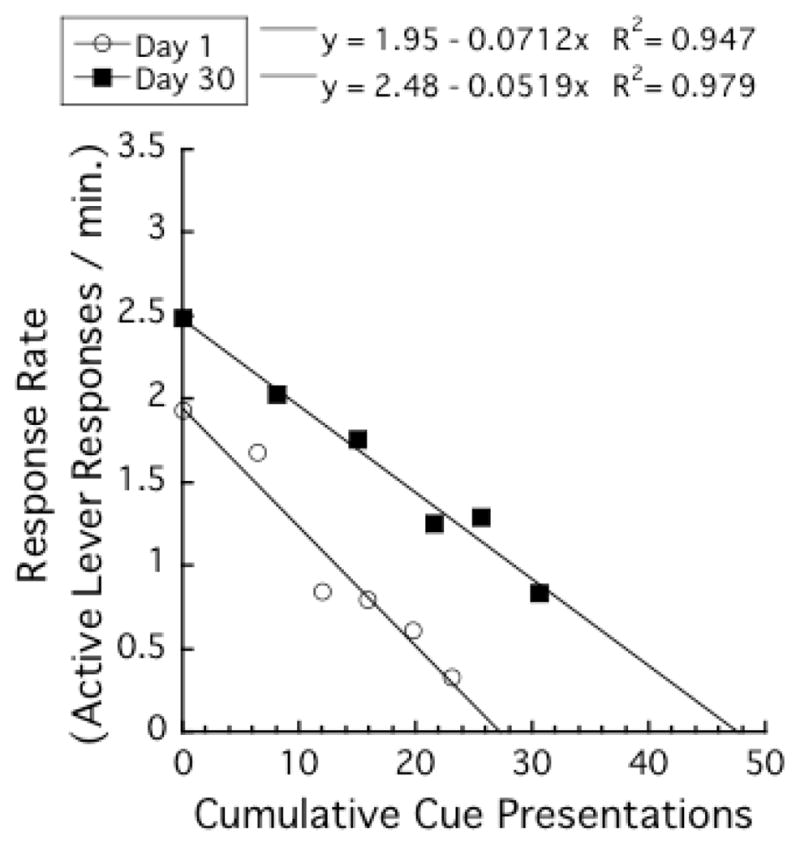
Mean response rates (number of active lever responses per min) as functions of cumulative number of cue presentations during the cue test (data are from Grimm et al., 2012). Rats were trained for 10 days in sucrose self-administration before the cue-reactivity test. Each data point represents the average of the cumulative number of cue presentations at the beginning of a 10-min block, and the average of the response rates during that 10-min block.
To compare these patterns of response characteristics with those described above for saccharin, we applied separate two-way ANOVAs using REINFORCERS (saccharin or sucrose) and ABSTINENCE-DAYS (Day 1 or Day 30) as between-group factors, to the y-axis intercepts, to the slopes, and to the x-axis intercepts.
For y-axis intercepts, slopes, and x-axis intercepts, effects of ABSTINENCE-DAYS were significant with F (1, 43) values of 9.7, 4.4, and 22.7, respectively, Ps < .05. In addition, effects of REINFORCERS were significant for slopes and x-axis intercepts with F (1, 43) values of 4.4 and 6.5, respectively, Ps < .05, but the effect of REINFORCERS was not significant for y-axis intercepts with F (1, 43) < 1.0. These results indicate that slopes were shallower and x-axis intercepts were larger when rats were trained with sucrose rather than saccharin. Finally, the interaction between REINFORCERS and ABSTINENCE-DAYS was not significant for all of the three parameters with F (1, 43) values of < 1.0, indicating that the magnitude of incubation effects was similar between saccharin and sucrose. Thus, the analyses of within-session patterns using Equation 1 complement the active lever response analysis (above) regarding the similarity in the magnitude of incubation of craving between saccharin and sucrose.
Discussion
The first purpose of this study was to investigate whether the incubation of craving generalizes to the artificial sweetener saccharin. The number of active-lever responses in the Day 30 group was higher than the Day 1 group, indicating an “incubation of saccharin craving”. The second purpose of this study was to apply Equation 1 to within-session changes in responding for the cue previously associated with saccharin. In both of the Day 1 and Day 30 groups, response rates were well-described as linear functions of cumulative number of cue presentations. The third purpose of this study was to examine the effects of incubation of craving on the parameters of Equation 1. Length of forced-abstinence period affected all 3 parameters of Equation 1: The regression line for the Day 30 group had larger y- and x-axis intercepts and a shallower slope than the Day 1 group (see Figure 6).
Active lever responses in the cue-reactivity test were greater in the Day 30 group (99.1 ± 9.5) compared to the Day 1 group (50.6 ± 4.8). To the best of our knowledge, this is the first demonstration of the “incubation of saccharin craving”. This result means that a post-ingestive caloric consequence of self-administration is not a necessary condition for the development of incubation of sucrose craving. We compared the magnitude of “incubation of saccharin craving” shown in this study to “incubation of sucrose craving” shown in the previous experiment (Grimm et al., 2012). The magnitude of the incubation effect on active lever responses was not different between saccharin and sucrose. For inactive lever responses and photobeam breaks, although sucrose-trained rats made more inactive lever responses than saccharin-trained rats, the interaction between REINFORCERS and ABSTINENCE-DAYS was not significant for either of these measures. The non-significant interaction indicates that the magnitude of the effect of forced abstinence on inactive lever responses and photobeam breaks was similar between saccharin and sucrose-trained rats. These results show that the effects of forced-abstinence of saccharin were very similar to the effects of forced-abstinence of sucrose. The contributing factor to the difference in inactive lever responses is unknown, because there were several procedural differences between the present and the previous experiments. Further study is needed to understand the similarity and the difference between saccharin and sucrose craving.
In the present experiment, we assessed saccharin seeking in an extinction test in which rats were exposed to contextual cues that had previously indicated saccharin availability during training (e.g. house light, lever insertion), and lever presses resulted in contingent presentations of a discrete tone + light cue that was previously temporally paired with each saccharin delivery during training. In previous cocaine-seeking studies, cocaine seeking was first measured in an extinction test in the presence of the contextual cues, but in the absence of the discrete tone + light cue. In a subsequent test, cue-induced reinstatement of cocaine seeking was measured in a session wherein responding led to presentations of the discrete tone + light cue. We found that cocaine seeking in the extinction and the cue-induced reinstatement tests followed a similar time course and that the measures were highly correlated (Grimm, Hope, Wise, & Shaham, 2001; Grimm et al., 2003). These results may indicate that the different sets of cocaine cues that control behavior in these two tests induce a similar motivational state that underlies cocaine seeking after withdrawal. The similarity between the extinction and the cue-induced reinstatement tests were also observed in sucrose-seeking studies (Grimm, Fyall, & Osincup, 2005; Grimm, Manaois, Osincup, Wells, & Buse, 2007). Therefore, in recent studies we assessed sucrose seeking in an extinction test in which rats were exposed to contextual cues previously associated with sucrose availability and lever presses resulted in contingent presentations of a discrete tone + light cue that was previously temporally paired with sucrose delivery (Grimm et al., 2011; 2012; 2013; Harkness, Webb, & Grimm, 2010). The procedure of the present study follows from these recent sucrose studies.
The second purpose of the present study was to analyze the within-session pattern of responding for a cue previously associated with the primary reinforcer (i.e., saccharin). There was a strong linear relationship between mean response rates and cumulative number of saccharin cue presentations. This result indicates that Equation 1 can describe within-session changes in active-lever responses for a secondary reinforcer. Until the present study, Equation 1 had only been applied to responses for primary reinforcers (e.g., Aoyama, 2007; 2012; Aoyama & McSweeney, 2001). The present study expanded the application of Equation 1 to responses for secondary reinforcers. McSweeney and colleagues investigated within-session patterns under extinction conditions. Visual inspection of their data suggests similar within-session patterns during the extinction sessions (McSweeney, Murphy, & Kowal, 2004; McSweeney, Swindell, & Weatherly, 1999). These findings, along with the present findings, indicate that further study is needed to reveal in more detail within-session patterns of responding for secondary reinforcers.
The effects of “incubation of saccharin craving” influenced all three parameters of Equation 1. The Day 30 group had larger y- and x-axis intercepts and shallower slopes than the Day 1 group. Previous research has shown two general changes in these parameters following various experimental manipulations when the equation was applied to responses for primary reinforcers. In some experiments the effects appeared in the slopes and x-axis intercepts, but not in the y-axis intercepts, of the regression lines. This pattern was shown when the length of food deprivation was manipulated (Aoyama, 2000, Experiments 1 and 2) and when rats were given food pellets immediately before the experimental sessions in which their responses were reinforced by the same food pellets (Aoyama, 2000, Experiment 3). In other experiments, the effects appeared in the y- and x-axis intercepts, but not in the slopes of the regression lines. This pattern was observed when the primary reinforcer was devalued by taste aversion learning (Aoyama, 2004; 2007). The effects of incubation of craving were different from these two patterns and may be unique.
We compared the effects of incubation of saccharin craving on the parameters of Equation 1 to the effects of incubation of sucrose craving. The interaction between REINFORCERS and ABSTINENCE-DAYS was not significant for all of the three parameters, indicating that the magnitude of incubation effects was similar between saccharin and sucrose. The analyses of within-session patterns using Equation 1 complement the active lever response analysis (above) regarding the similarity in the magnitude of incubation of craving between saccharin and sucrose. Thirty days of forced abstinence increased the y-axis intercept (initial response rate) and reduced the slope (rate of decline in responding). As a result, the x-axis intercept (number of secondary reinforcer presentations to eliminate responding) was increased. In the cue-reactivity test sessions in which lever-press responses were accompanied only by secondary reinforcers, we hypothesize that the y-axis intercept may represent vigor of seeking behavior and that the slope may indicate persistence of seeking behavior. Likewise, it has been hypothesized that incubation of craving reflects an increase in motivation to respond for the conditioned rewarding properties of the cue (Grimm, 2012). Further analysis of the parameters of Equation 1 may provide insight into the nature of the enhanced motivational response to the reward-paired stimulus observed with an incubation of craving.
Although the non-significant interaction between REINFORCERS and ABSTINENCE-DAYS indicates that the magnitude of the incubation effects on the three parameters of Equation 1 was similar, there were some main effects of REINFORCERS on the parameters; slopes were shallower and x-axis intercepts were larger when rats were trained with sucrose. Because there were several procedural differences between the saccharin and the sucrose experiments, the contributing factor to these differences is unclear. Among the procedural differences, reinforcement history might be most important. We therefore compared the average number of active lever responses during the last four days of training between the saccharin and the sucrose experiments (108.1 ± 9.5 and 100.3 ± 6.0 for the saccharin and the sucrose experiments, respectively). A t-test revealed that the difference between the two experiments was not significant. Other procedural differences were the habituation to the reinforcer before the training sessions in the saccharin experiment and the saline injections in the sucrose experiment. Further studies are needed to identify the factors that produced the differences in slopes and x-axis intercepts between the saccharin and sucrose experiments.
The results of the present experiment are compatible with the idea that the incubation of craving for saccharin is due to sensitization to any incentives (including saccharin). According to incentive-sensitization theory, sensitization to incentives should enhance not only responding for the cue associated with the incentives but also general motor activities (Robinson & Berridge, 2001). The enhancement of locomotion and inactive-lever responses observed in the Day 30 group supports the idea. However, length of forced-abstinence does not necessarily exert the same effects on active-lever responses and general motor activities. For example, Grimm et al. (2006) investigated the effects of intraperitoneal cocaine injection on locomotor activity and responding for a cue associated with sucrose. Dose-response effects of cocaine differed between active-lever responding and locomotor activity. Cocaine increased responding for the cue on day 1 of forced abstinence at the 5mg/kg dose only, but responding on day 30 was increased at the 10 and 20mg/kg doses. In contrast, dose-response effects of cocaine on locomotor activity were not different between the day 1 and the day 30 groups. Future studies are required to identify whether the behavioral manifestation of incubation of craving involves incentive sensitization.
In summary, the present experiment provides the first evidence of “incubation of saccharin craving”. This result indicates that the post-ingestive caloric consequence of self-administration is not a necessary condition for the development of incubation of sucrose craving. For the treatment of chronic relapsing disorders where craving may be a potential factor in relapse, such as eating disorders and obesity, the present results indicate that simple replacement of sugar by non-caloric artificial sweeteners may not reduce the risk of relapse. Finally, the present experiment demonstrated that Equation 1 can describe within-session changes in responding for either saccharin or sucrose-associated secondary reinforcers. Incubation results in a shift in parameters that differs from either satiety or conditioned aversion. As described above, the incubation pattern consists of an increase in x and y intercepts and a shallower regression line. From the limited data available (published and present data) we speculate that this pattern reflects the enhanced vigor and persistence of incubated seeking behavior. Validation of the significance of each parameter in future studies may provide important insight into the complex nature of reward seeking behaviors such as drug or food relapse.
Highlights.
Responding for drug or sucrose cues “incubates” over weeks of forced abstinence
The present study describes a similar finding with saccharin
Within-session responding for saccharin or sucrose cues was also examined
Within-session response patterns varied with length of forced abstinence
These findings reveal factors that may influence food and drug craving
Acknowledgments
The authors wish to thank Rachel Weber, Jon Koerber, Edwin Glueck, Kylan Dorsey, and Laura Eaton for help with data collection. This work was supported by NIH/NIDA Grant R15 DA016285-3 (JWG), Doshisha University, and Western Washington University.
Footnotes
Publisher's Disclaimer: This is a PDF file of an unedited manuscript that has been accepted for publication. As a service to our customers we are providing this early version of the manuscript. The manuscript will undergo copyediting, typesetting, and review of the resulting proof before it is published in its final citable form. Please note that during the production process errors may be discovered which could affect the content, and all legal disclaimers that apply to the journal pertain.
References
- American Psychiatric Association. Diagnostic and Statistical Manual of Mental Disorders. 5. Arlington, VA: American Psychiatric Association; 2013. [Google Scholar]
- Aoyama K. Within-session response rate in rats decreases as a function of amount eaten. Physiol Behav. 1998;64:765–769. doi: 10.1016/s0031-9384(98)00118-8. [DOI] [PubMed] [Google Scholar]
- Aoyama K. Effects of hunger state on within-session response decreases under CRF schedule. Learn Motiv. 2000;31:1–20. [Google Scholar]
- Aoyama K. The effect of taste-aversion learning on within-session response decrease during a continuous reinforcement (CRF) schedule. Jpn J Psychon Sci. 2004;22:168–173. [Google Scholar]
- Aoyama K. Effects of post-session wheel running on within-session changes in operant responding. Learn Motiv. 2007;38:284–293. [Google Scholar]
- Aoyama K. Effects of an activity-based anorexia procedure on within-session changes in nose-poke responding. Learn Motiv. 2012;43:48–54. [Google Scholar]
- Aoyama K, McSweeney FK. Habituation may contribute to within-session decreases in responding under high-rate schedules of reinforcement. Anim Learn Behav. 2001;29:79–91. [Google Scholar]
- Bousfield WA. Quantitative indices of the effects of fasting on eating-behavior. J Genet Psychol. 1935;46:476–479. [Google Scholar]
- Davidson TL, Martin AA, Clark K, Swithers SE. Intake of high-intensity sweeteners alters the ability of sweet taste to signal caloric consequences: Implications for the learned control of energy and body weight regulation. Q J Exp Psychol. 2011;64:1430–1441. doi: 10.1080/17470218.2011.552729. [DOI] [PMC free article] [PubMed] [Google Scholar]
- de Matos Feijo F, Ballard CR, Foletto KC, Melo Batista BA, Neves AM, Marques Ribeiro MF, Bertoluci MC. Saccharin and aspartame, compared with sucrose, induce greater weight gain in adult Wistar rats at similar total caloric intake levels. Appetite. 2013;60:203–207. doi: 10.1016/j.appet.2012.10.009. [DOI] [PubMed] [Google Scholar]
- Grimm JW. Craving. In: Olmstead MC, editor. Animal Models of Drug Addiction. New York: Springer-Verlag; 2011. pp. 311–336. [Google Scholar]
- Grimm JW. Incubation of sucrose craving in animal models. In: Brownell KD, Gold MS, editors. Food and Addiction. New York: Oxford University Press; 2012. pp. 214–219. [Google Scholar]
- Grimm JW, Buse C, Manaois M, Osincup D, Fyall A, Wells B. Time-dependent dissociation of cocaine dose–response effects on sucrose craving and locomotion. Behav Pharmacol. 2006;17:143–149. doi: 10.1097/01.fbp.0000190686.23103.f8. [DOI] [PMC free article] [PubMed] [Google Scholar]
- Grimm JW, Fyall AM, Osincup DP. Incubation of sucrose craving: effects of reduced training and sucrose pre-loading. Physiol Behav. 2005;84:73–79. doi: 10.1016/j.physbeh.2004.10.011. [DOI] [PMC free article] [PubMed] [Google Scholar]
- Grimm JW, Harkness JH, Ratliff C, Barnes J, North K, Collins S. Effects of systemic or nucleus accumbens-directed dopamine D1 receptor antagonism on sucrose seeking in rats. Psychopharmacology. 2011;216:219–233. doi: 10.1007/s00213-011-2210-y. [DOI] [PMC free article] [PubMed] [Google Scholar]
- Grimm JW, Hope BT, Wise RA, Shaham Y. Incubation of cocaine craving after withdrawal. Nature. 2001;412:141–142. doi: 10.1038/35084134. [DOI] [PMC free article] [PubMed] [Google Scholar]
- Grimm JW, Kruzich PJ, See RE. Contingent access to stimuli associated with cocaine self-administration is required for reinstatement of drug-seeking behavior. Psychobiology. 2000;28:383–386. [Google Scholar]
- Grimm JW, Lu L, Hayashi T, Hope BT, Su TP, Shaham Y. Time- dependent increases in brain-derived neurotrophic factor protein levels within the mesolimbic dopamine system after withdrawal from cocaine: implications for incubation of cocaine craving. J Neurosci. 2003;23:742–747. doi: 10.1523/JNEUROSCI.23-03-00742.2003. [DOI] [PMC free article] [PubMed] [Google Scholar]
- Grimm JW, Manaois M, Osincup D, Wells B, Buse C. Naloxone attenuates incubated sucrose craving in rats. Psychopharmacology. 2007;194:537–544. doi: 10.1007/s00213-007-0868-y. [DOI] [PMC free article] [PubMed] [Google Scholar]
- Grimm JW, Ratliff C, North K, Barnes J, Collins S. Nicotine increases sucrose self-administration and seeking in rats. Addict Biol. 2012;17:623–633. doi: 10.1111/j.1369-1600.2012.00436.x. [DOI] [PMC free article] [PubMed] [Google Scholar]
- Grimm JW, Weber R, Barnes J, Koerber J, Dorsey K, Glueck E. Brief exposure to novel or enriched environments reduces sucrose cue-reactivity and consumption in rats after 1 or 30 days of forced abstinence from self-administration. PLoS One. 2013;8:e54164. doi: 10.1371/journal.pone.0054164. [DOI] [PMC free article] [PubMed] [Google Scholar]
- Harkness JH, Webb S, Grimm JW. Abstinence-dependent transfer of lithium chloride-induced sucrose aversion to a sucrose-paired cue in rats. Psychopharmacology. 2010;208:521–530. doi: 10.1007/s00213-009-1755-5. [DOI] [PMC free article] [PubMed] [Google Scholar]
- Killeen PR. Economics, ecologics, and mechanics: The dynamics of responding under conditions of varying motivation. J Exp Anal Behav. 1995;64:405–431. doi: 10.1901/jeab.1995.64-405. [DOI] [PMC free article] [PubMed] [Google Scholar]
- Markou A, Weiss F, Gold LH, Caine SB, Schulteis G, Koob GF. Animal models of drug craving. Psychopharmacology. 1993;112:163–182. doi: 10.1007/BF02244907. [DOI] [PubMed] [Google Scholar]
- McCleery RH. On satiation curves. Anim Behav. 1977;25:1005–1015. [Google Scholar]
- McSweeney FK, Hinson JM, Cannon CB. Sensitization-habituation may occur during operant conditioning. Psychol Bull. 1996;120:256–271. [Google Scholar]
- McSweeney FK, Murphy ES. Sensitization and habituation regulate reinforcer effectiveness. Neurobiol Learn Mem. 2009;92:189–198. doi: 10.1016/j.nlm.2008.07.002. [DOI] [PubMed] [Google Scholar]
- McSweeney FK, Murphy ES, Kowal BP. Extinguished operant responding shows stimulus specificity. Behav Processes. 2004;65:211–220. doi: 10.1016/j.beproc.2003.10.001. [DOI] [PubMed] [Google Scholar]
- McSweeney FK, Swindell S, Weatherly JN. Within-session response patterns during variable interval, random reinforcement and extinction procedures. Learn Motiv. 1999;30:221–240. [Google Scholar]
- Pickens CL, Airavaara M, Theberge F, Fanous S, Hope BT, Shaham Y. Neurobiology of the incubation of drug craving. Trends Neurosci. 2011;34:411–420. doi: 10.1016/j.tins.2011.06.001. [DOI] [PMC free article] [PubMed] [Google Scholar]
- Robinson TE, Berridge KC. Incentive-sensitization and addiction. Addiction. 2001;96:103–114. doi: 10.1046/j.1360-0443.2001.9611038.x. [DOI] [PubMed] [Google Scholar]
- Skinner BF. Drive and reflex strength. II. J Gen Psychol. 1932;6:38–48. [Google Scholar]
- Swithers SE, Baker CR, Davidson TL. General and persistent effects of high-intensity sweeteners on body weight gain and caloric compensation in rats. Behav Neurosci. 2009;123:772–780. doi: 10.1037/a0016139. [DOI] [PMC free article] [PubMed] [Google Scholar]
- Swithers SE, Davidson TL. A role for sweet taste: Calorie predictive relations in energy regulation by rats. Behav Neurosci. 2008;122:161–173. doi: 10.1037/0735-7044.122.1.161. [DOI] [PubMed] [Google Scholar]
- Swithers SE, Martin AA, Clark KM, Laboy AF, Davidson TL. Body weight gain in rats consuming sweetened liquids: Effects of caffeine and diet composition. Appetite. 2010;55:528–533. doi: 10.1016/j.appet.2010.08.021. [DOI] [PMC free article] [PubMed] [Google Scholar]
- Swithers SE, Martin AA, Davidson TL. High-intensity sweeteners and energy balance. Physiol Behav. 2010;100:55–62. doi: 10.1016/j.physbeh.2009.12.021. [DOI] [PMC free article] [PubMed] [Google Scholar]