Abstract
Objective
To assess the use of Helios in combination with FoxP3 as a superior method for identifying non–cytokine-producing human Treg cells in patients with systemic lupus erythematosus (SLE) and to determine if FoxP3+Helios+ Treg cells are maintained at normal levels in patients with clinically active disease.
Methods
Peripheral blood mononuclear cells (PBMCs) were purified from the blood of healthy volunteer donors and from 52 consecutive patients with SLE of varying clinical activity (Systemic Lupus Erythematosus Disease Activity Index scores of 0, 2–4, and ≥5). PBMCs (either fresh or after 4 hours of stimulation for cytokine production) were then analyzed by flow cytometry for the expression of cell surface markers (CD4, CD25, CD127, and CD45RA) and transcription factors (FoxP3 and Helios), as well as for the production of cytokines (interleukin-2 and interferon- γ).
Results
FoxP3+Helios+ Treg cells were found to be non–cytokine producing in both SLE patients and healthy controls. Patients with clinically active SLE had higher percentages of FoxP3+Helios+ Treg cells than did patients with inactive SLE or healthy controls. When corrected for the total CD4 cell count, the absolute numbers of FoxP3+Helios+ Treg cells in patients with moderately-to-highly active SLE were normal.
Conclusion
Previous reports of a deficiency in Treg cell number or function in SLE are limited by their use of CD25, either alone or in combination with other markers, to identify human Treg cells. Helios in combination with FoxP3 is a superior method for detecting all non–cytokine-producing Treg cells, irrespective of CD25 or CD45RA expression. Using this method, we showed that FoxP3+Helios+ Treg cell numbers are not reduced in patients with clinically active SLE.
FoxP3+ Treg cells are a subset of CD4+ T cells that are essential for maintaining homeostasis of the immune system and preventing systemic autoimmune disease (1). Naturally occurring, albeit rare, genetic deficiency of FoxP3 leads to the development of autoreactive B cells (2) and the immune dysregulation, polyendocrinopathy, enteropathy, X-linked syndrome (IPEX) (3). Despite these observations, it has been difficult for researchers to establish a clear connection between human autoimmune disease and abnormalities of Treg cell numbers and function (4).
In systemic lupus erythematosus (SLE), there is much interest in the role of Treg cells (5). Multiple lines of evidence suggest that Treg cells might be reduced in number or function in SLE because of a relative reduction in T cell interleukin-2 (IL-2) production and signaling and a high level of interferon (IFN)–induced gene expression (6,7). However, the lack of a single marker or combination of markers that would reliably identify human Treg cells has made it difficult to correlate these cells with disease activity in SLE and other autoimmune diseases (8). In humans, CD25 (IL-2 receptor α-chain) and FoxP3 expression is not limited to Treg cells; they may also be expressed in activated conventional T cells (9), and not necessarily conferring a stable regulatory phenotype (10). Furthermore, CD25low/− cells may also contain functional FoxP3+ Treg cells (11).
Helios, a member of the Ikaros gene family of transcription factors, has recently been shown to be selectively expressed by 70–80% of human FoxP3+ T cells (12). Studies in mice have suggested that FoxP3+Helios+ Treg cells are thymus-derived, while FoxP3+Helios− T cells are likely induced at peripheral sites. A similar situation may exist in humans, as FoxP3+ T cells induced in culture with transforming growth factor β are Helios−. Furthermore, the composition of the FoxP3+Helios- population is complex, as it contains a large number of cytokine-producing cells that may represent activated conventional T cells (12). More recent studies of the methylation status of the Treg-specific demethylation region (TSDR) of the FoxP3 locus have also suggested that up to 50% of FoxP3+Helios- cells may be activated conventional T cells (13).
For these reasons, we used the expression of Helios in combination with FoxP3 to more accurately quantify human peripheral blood Treg cells in patients with SLE with various levels of disease activity. We compared the number of FoxP3+Helios+ Treg cells in healthy controls to that in patients with SLE of differing clinical severities (determined by the Systemic Lupus Erythematosus Disease Activity Index [SLEDAI] score) (14) and tested whether FoxP3+Helios+ Treg cells in SLE are preferentially low producers of cytokines as compared to FoxP3+Helios− T cells. We also determined the absolute number and relative abundance of FoxP3+Helios+ Treg cells in SLE patients with inactive disease (SLEDAI score of 0) as compared to patients with mildly active (SLEDAI score of 2–4) or moderately-to-highly active (SLEDAI score of ≥5) disease.
PATIENTS AND METHODS
Buffy coat products containing ∼5 × 10⁸ cells were obtained from 40 healthy adult donors (60% female; age range 20–60 years) at the Department of Transfusion Medicine, National Institutes of Health (NIH). A total of 52 SLE patients were enrolled in this cross-sectional study between December 1, 2009 and May 31, 2012. All patients were ≥18 years of age and fulfilled the 1997 update of the American College of Rheumatology revised criteria for SLE (15,16). Patients were recruited from the Rheumatology Clinic at the National Institute of Arthritis and Musculoskeletal and Skin Diseases (NIAMS), NIH. Peripheral blood mononuclear cells (PBMCs) were derived from 5–10 ml of blood obtained from patients with SLE who participated in an Institutional Review Board–approved protocol at NIAMS (NIH no. 94-AR-0066, Studies of the Pathogenesis and Natural History of Systemic Lupus Erythematosus; ClinicalTrials.gov identifier: NCT00001372). All patients provided written informed consent before participating in the protocol.
PBMCs were washed once with phosphate buffered saline and once with 1 × NC flow cytometry staining buffer (eBioscience). PBMCs were then stained on ice for 30–60 minutes with fluorescence-labeled CD4 (Invitrogen), CD25 (BioLegend), CD45RA (BD Biosciences), and/or CD127 (BD Biosciences), washed, and spun. Cells were then fixed/permeabilized (FoxP3 fixation/permeabilization buffer kit; eBioscience) for 1 hour on ice or overnight at 4°C Cells were then washed in 1 × Perm buffer (eBioscience) and stained for intracellular FoxP3 (clone 236A/E7; eBioscience) and Helios (BioLegend). All samples were analyzed on a BD LSRII fluorescence-activated cell sorter (FACS) and analyzed using FlowJo software. To ensure that sufficient events were recorded during sample collection, a minimum of 5,000 events were collected within a gate set on FoxP3+Helios+ cells. For total CD4+ T cells, this required staining of ≥5 × 10⁵ cells/sample. The raw data were then converted to numerical data, which is presented as the percentage of total CD4+ T cells or the absolute Treg cell numbers.
For measurement of intracellular cytokine production, PBMCs were stimulated for 4 hours at 37°C with 12-O-tetradecanoylphorbol-13-acetate (PMA; 50 ng/ml) and ionomycin (1 µg/ml) in the presence of GolgiStop (0.75 µl/ml). The cells were fixed, permeabilized, and stained for FoxP3 and Helios expression, as well as for IL-2 and IFNγ (eBioscience). DNA methylation analysis of the TSDR in freshly isolated and fixed Treg cells was performed as previously described (13).
Statistical comparison of various lymphocyte subsets was performed by Student’s unpaired t-test in Microsoft Excel. Correlation analyses were done by Spearman’s rank correlation test using GraphPad Prism software version 4 for Mac.
RESULTS
Patients with a diagnosis of SLE were recruited from the NIH Lupus Cohort. The mean ± SD age of the 52 study patients was 42 ± 15 years, and the mean ± SD disease duration was 14 ± 10 years. The patients were predominantly female (92%) and either had no clinical activity or had mild-to-moderate clinical activity (81% with a SLEDAI score of ≤4) at the time the blood sample was taken. The most common end organ involvement included the skin (94%), joints (77%), and kidneys (63%). The majority of patients were being treated with hydroxychloroquine (77%), with a minority (34%) receiving DMARDs. A continuum of prednisone dosages was in use, ranging from none to 60 mg/day, with a median daily prednisone dose of 5 mg. (Further demographic and medication data are available upon request from the corresponding author.) Blood samples were obtained on the day of clinic visit and were immediately processed as described in Patients and Methods for enrichment of PBMCs, followed by FACS analysis after antibody staining, with or without prior cytokine activation.
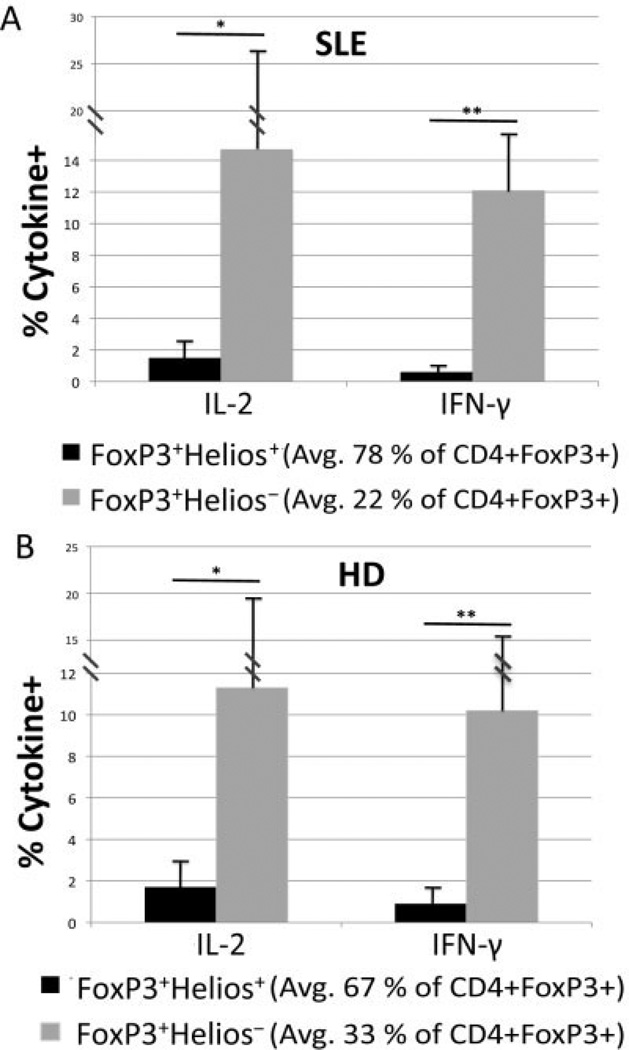
It has previously been shown that FoxP3+ Helios+ cells do not produce significant amounts of cytokine upon PMA/ionomycin stimulation, whereas significant percentages of cytokine-producing cells can be detected in the FoxP3+Helios− population (12). Similarly, a significant percentage of FoxP3+Helios− T cells from SLE patients produced IL-2 or IFNγ, but the percentage of cytokine-producing cells in the FoxP3+Helios− subset from the SLE patients did not differ considerably from the percentage in the FoxP3+Helios− subset from the healthy donors (Figure 1). These results confirm our previous observations that the FoxP3+Helios− population may be contaminated with a significant percentage of cytokine-producing conventional T cells. For this reason, we focused our study in SLE on an analysis of the FoxP3+Helios+ subpopulation.
Figure 1.
The non−cytokine-producing FoxP3+Helios+ Treg cell subset of CD4+FoxP3+ cells from patients with systemic lupus erythematosus (SLE). A, Peripheral blood mononuclear cells (PBMCs) from 18 patients with SLE (9 with a Systemic Lupus Erythematosus Disease Activity Index score of 0, 4 with a score of 2, and 5 with a score of ≥4) were stimulated with 12-O-tetradecanoylphorbol-13-acetate (PMA)/ionomycin/GolgiStop to induce cytokine production and then stained for CD4, intracellular Helios, intercellular FoxP3, and either interleukin-2 (IL-2) or interferon-γ (IFNγ). * = P = 0.015; ** = P = 0.00001 by Student’s unpaired t-test. B, PBMCs from 6 healthy donors (HD) were also stimulated and stained for intracellular cytokines as for those from the SLE patients. * = P = 0.05; ** = P = 0.001 by Student’s unpaired t-test. Values are the mean ± SD.
As an alternative approach to the analysis of Treg cells from SLE patients, we used the well-established phenotype CD25highCD127− (17). In the healthy donors, the majority of the CD25highCD127− subset was FoxP3+Helios+ (≥80%) (data not shown). However, in the SLE patients, the CD25highCD127− population contained a lower percentage of FoxP3+Helios+ Treg cells (≤60%) (data not shown). In contrast, ≥95% of the FoxP3+Helios+ Treg cells were CD127− in both healthy donors and SLE patients (data not shown).
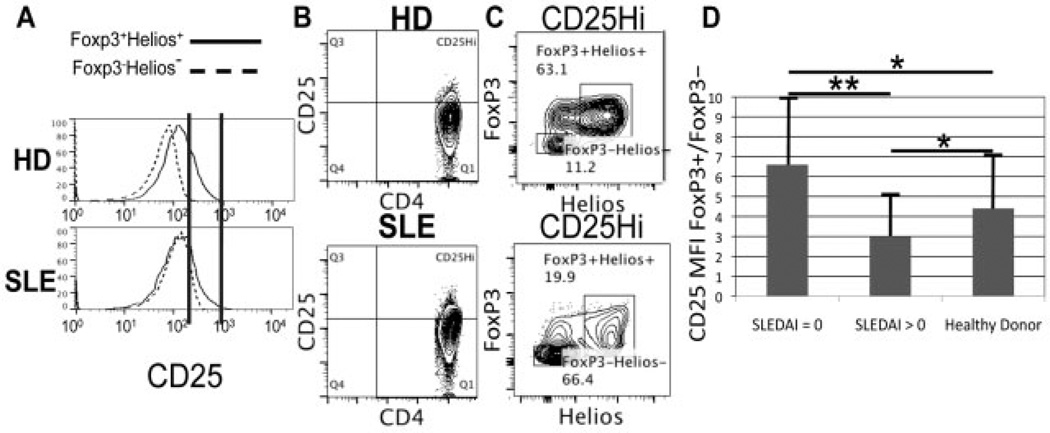
Compared to the healthy donors, there was often a higher degree of overlap in CD25 expression between FoxP3+Helios+ Treg cells and FoxP3−Helios− cells in the SLE patients (Figure 2). Furthermore, there was quite a high variability in the mean fluorescence intensity (MFI) for CD25 staining of FoxP3 + CD4+ T cells in SLE patients as compared to normal donors (Figure 2D). The relationship between the MFI for CD25 staining of FoxP3+ versus FoxP3− cells was significantly different between patients with inactive SLE (n = 8) and those with active SLE (n = 11). The lower ratio among the patients with more active disease makes it more difficult to use CD25 expression as a means to distinguish between FoxP3+ and FoxP3− cells. Whereas a distinct CD25high population could be found within the FoxP3+Helios + subset as opposed to the FoxP3−Helios− cells in healthy individuals (Figure 2A), there was greater overlap of CD25 expression between FoxP3+Helios+ Treg cells and FoxP3−Helios− conventional T cells in SLE patients. Gating on CD25high cells revealed >60% conventional T cells (FoxP3−Helios−) in SLE patients as compared to only ∼10% FoxP3−Helios− cells in healthy donors (Figures 2B and C). This high number of conventional T cells in the CD25high population makes CD25 a poor marker for Treg cells in SLE patients.
Figure 2.
CD25, a poor marker of Treg cells in systemic lupus erythematosus (SLE). Representative histograms and fluorescence-activated cell sorter (FACS) plots for cells from 12 healthy donors (HD) and 19 SLE patients are shown. A, CD4+ T cells gated on FoxP3+Helios+ (Treg cells) or Helios−FoxP3− (conventional T cells), showing relative CD25 expression. Vertical lines indicate CD25 expression levels that overlap between FoxP3+Helios+ and FoxP3−Helios− cells in SLE patients but not healthy donors. B, FACS analysis of total peripheral blood mononuclear cells, showing gating strategy for the CD4+CD25high subset based on the CD25 histograms shown in A. C, Helios and FoxP3 expression in the gated CD4+CD25high subset shown in B. D, Ratio of the CD25 mean fluorescence intensity (MFI) in FoxP3+ versus FoxP3− CD4+ T cells in 8 patients with inactive SLE (Systemic Lupus Erythematosus Disease Activity Index [SLEDAI] score of 0), 11 patients with active SLE (SLEDAI score of >0), and 12 healthy donors. Values are the mean ± SD. * = P > 0.05; ** = P < 0.05 by Student’s unpaired t-test.
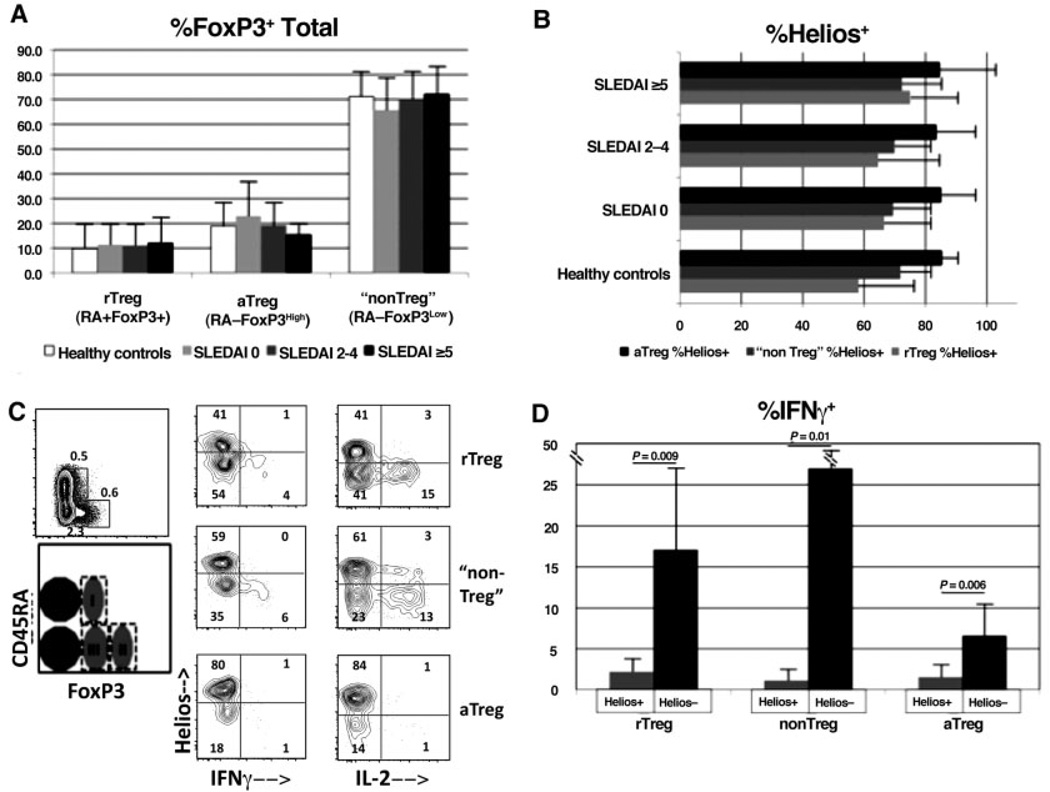
It has recently been proposed that FoxP3+ T cells can be subdivided into 3 fractions based on the isoform of CD45 that is expressed as well as the level of FoxP3 expression (18). Fraction I, called “resting” Treg cells, consists of the CD45RA+FoxP3low subset, fraction II, called “activated” Treg cells, consists of the CD45RA−FoxP3high subset, and fraction III, regarded as being composed primarily of activated conventional T cells and called “non–Treg” cells, consists of the CD45RA−FoxP3low subset. It was previously observed that patients with active SLE have a relatively low number of activated Treg cells and an increased number of resting Treg cells as compared to healthy controls (18). However, in our cohort of patients and healthy controls, the largest subset/group as a percentage of total FoxP3+CD4+ T cells was the non–Treg cell group (Figure 3A). Furthermore, we did not find any significant differences in the 3 subsets between the healthy donors and the patients at any level of SLE clinical activity.
Figure 3.
Presence of non-cytokine-producing FoxP3+Helios+ cells irrespective of the expression of CD45RA or the level of FoxP3 in healthy donors and patients with systemic lupus erythematosus (SLE). All panels are gated on CD4+ cells, and subtypes of FoxP3+ cells are based on the previously published system (18). A, Cell samples from 20 SLE patients and 17 healthy donors were stained for CD45RA in addition to CD4, Helios, and FoxP3, and the Treg cell subsets were determined as a percentage of the total CD4+FoxP3+ cells. rTreg = resting Treg cells; aTreg = activated Treg cells. B, Percentage of Helios expression in Treg cell subsets was determined in the samples shown in A. Patients in A and B were categorized according to Systemic Lupus Erythematosus Disease Activity Index [SLEDAI] scores. Values in A and B are the mean ± SD. C, Peripheral blood mononuclear cells from an SLE patient were directly stimulated ex vivo with 12-O-tetradecanoylphorbol-13-acetate (PMA)/ionomycin/GolgiStop, as described in Patients and Methods, prior to surface and intracellular staining. Costaining for the cytokines interferon-γ (IFNγ) and interleukin-2 (IL-2) was performed. Results are representative of cells from 6 different patients. Numbers in each compartment are the percentages of positive cells. Cell fractions I, II, and III are indicated. D, IFNγ production in 6 SLE samples was determined as described in C. Values are the mean ± SD. P values were determined by Student’s unpaired t-test.
As we regard the expression of Helios to be a marker of thymus-derived, non–cytokine-producing Treg cells, it was of interest to determine the percentage of Helios+ cells within each of these groups. As shown in Figure 3B, all 3 subsets, including the so-called non–Treg cells, contained a high percentage of Helios+ cells in healthy controls and in SLE patients of all clinical activity levels. Of note, the FoxP3+Helios+ subset always failed to produce either IL-2 or IFNγ, even within the non–Treg cell group (Figures 3C and D). Thus, in terms of Helios expression, the so-called non– Treg cell group (fraction III) contains both FoxP3+Helios + and FoxP3+Helios− subpopulations at levels very similar to the those of the “resting” or “naive” Treg cell group, while the “activated” Treg cell population is composed almost exclusively of FoxP3+Helios+ cells.
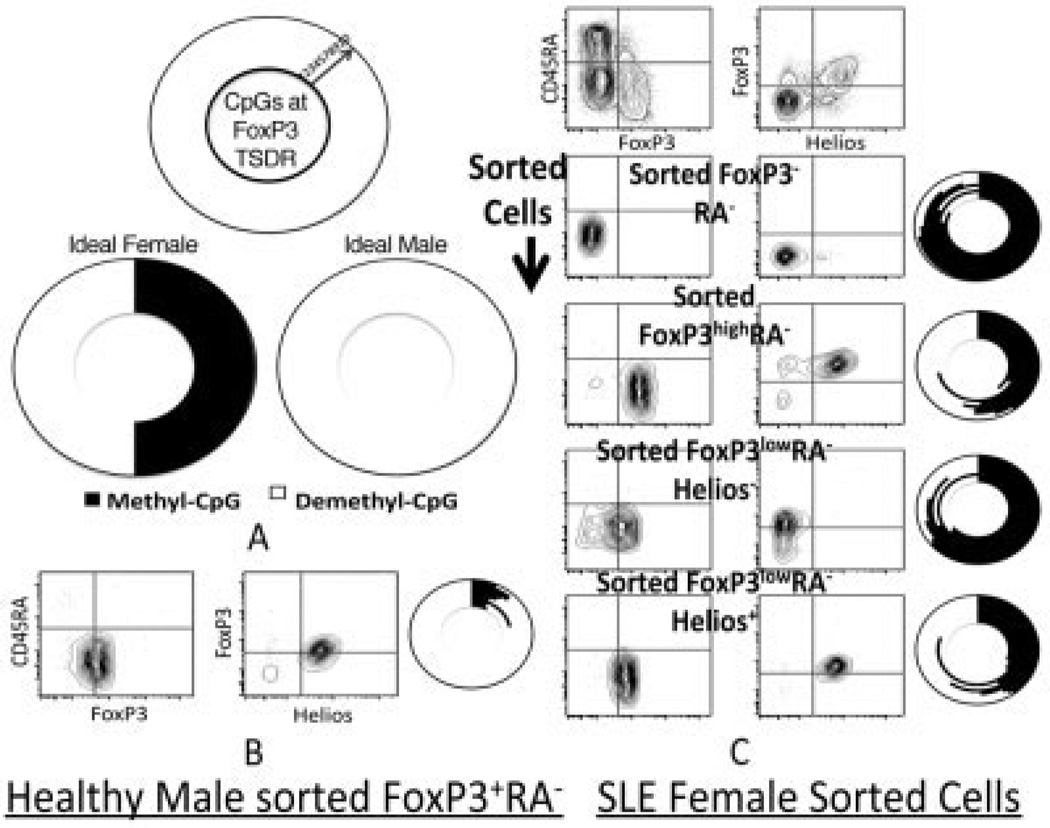
A gold standard for identifying bona fide Treg cells is the methylation status of the FoxP3 gene locus TSDR (19). We have previously shown that male-derived FoxP3+Helios+ cells are >95% demethylated at the TSDR, as compared to >90% methylation in FoxP3− cells (13). Because of X-inactivation, Treg cells from females are at most 50% demethylated at the FoxP3 TSDR, as compared to Treg cells sorted from males (one X chromosome copy of the FoxP3 locus per cell). Due to the need for a large number of starting CD4+ T cells prior to sorting and the relative infrequency of SLE in males as compared to females, we were thus far limited to assessing the FoxP3 locus TSDR demethylation in female SLE patients.
We sorted the following subsets from the PBMCs of a female SLE patient (Figure 4): CD45RA−FoxP3− (conventional T cells), FoxP3highCD45RA− (activated Treg cells), FoxP3lowHelios−CD45RA−, and FoxP3low Helios+CD45RA−. Interestingly, the FoxP3high and FoxP3lowHelios+ cells exhibited maximal TSDR demethylation (50% for the female patient) (Figure 4C), as opposed to <20% TSDR demethylation for FoxP3− cells (conventional T cells) and <30% for FoxP3lowHelios– cells (Figure 4C). The Helios+ fraction therefore identifies TSDR locus–demethylated Treg cells among all subsets of mature (CD45RA−) CD4+ T cells, including those with low-to-moderate FoxP3+ expression.
Figure 4.
Hypomethylation of the FoxP3 locus Treg-specific demeth-ylation region (TSDR) in Helios+ versus Helios− cells, even within the previously described (18) “non–Treg cell” FoxP3lowCD45RA− cell subtype. A, Nine sequentially CpG methylated or unmethylated sites within the FoxP3 locus TSDR, as described by Floess et al (19) (ideal results of methylation sequencing), are shown. Site 6 was unreliable in our experiments and was therefore excluded. Due to X-inactivation in females, at most only 50% of the potential TSDR CpG sites in sorted Treg cells are demethylated, as compared with 100% demethylation of TSDR CpG sites in sorted Treg cells from males, where both X chromosome FoxP3 genes are expressed. B, Sorted CD4+CD45RA− FoxP3+ mature Treg cells from a healthy male donor show almost complete demethylation of CpG sites. C, Sorted CD45RA− subsets from a female patient with systemic lupus erythematosus (SLE) show FoxP3 locus TSDR methylation. Maximum (50%) TSDR demethylation is observed in sorted FoxP3highCD45RA− cells as well as sorted FoxP3lowCD45RA–Helios+ cells as compared to sorted FoxP3– CD45RA– cells and FoxP3lowCD45RA−Helios− cells.
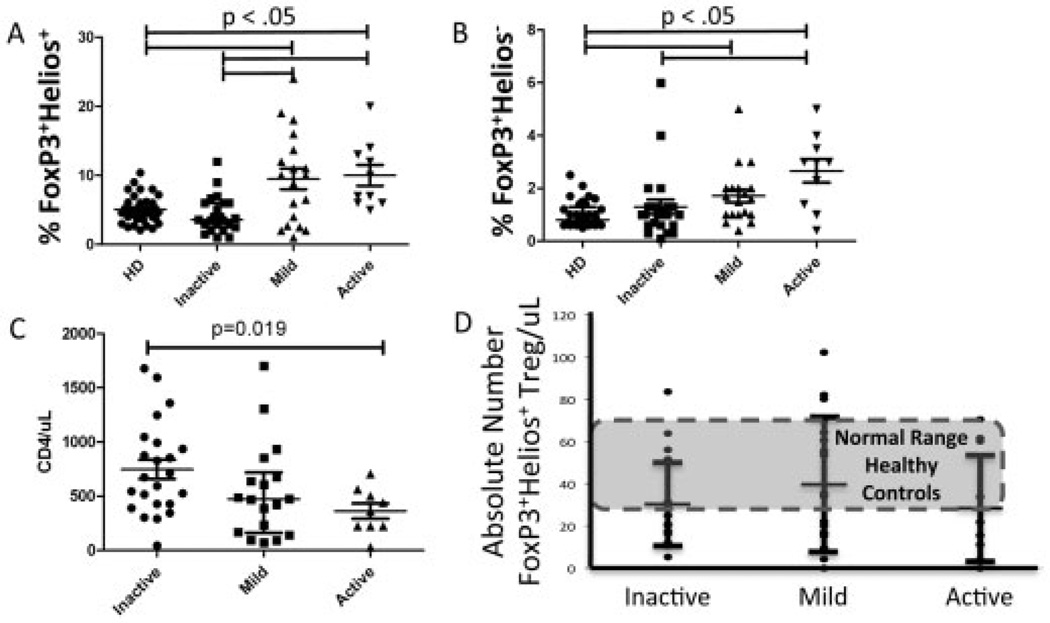
Numerous studies have attempted to correlate the clinical activity of SLE with a numerical or functional deficiency in Treg cells (5). Using the combination of Helios and FoxP3 to identify non–cytokine-producing Treg cells, we found that, as a percentage of total CD4+ T cells, FoxP3+Helios + Treg cells were significantly increased in the presence of higher clinical disease activity (P < 0.05) (Figure 5A). Spearman’s rank correlation for the percentage of FoxP3+Helios + Treg cells and increasing clinical activity of SLE was r = 0.4165 (P < 0.002). The percentage of FoxP3+Helios− cells also increased with higher clinical activity (P < 0.05) (Figure 5B); however, the ratio between Helios+ and Helios− cells among CD4+FoxP3+ cells did not change considerably (data not shown). The absolute numbers of FoxP3+Helios+ Treg cells did not change significantly with increasing SLE clinical activity, as determined by the SLEDAI score (Figure 5D), and was within the normal range seen in healthy donors. The relative invariability of the absolute numbers of FoxP3+Helios+ Treg cells among the SLE clinical activity groups as compared to the percentage of FoxP3+Helios+ Treg cells was due to the significant decrease in the average CD4 count in the SLE groups with higher clinical activity (Figure 5C).
Figure 5.
Lack of association between increasing clinical activity of systemic lupus erythematosus (SLE) and a drop in the absolute numbers of FoxP3+Helios+ Treg cells, but positive correlation with an increasing percentage of FoxP3+Helios+ Treg cells among total CD4+ T cells. A and B, Percentages of FoxP3+Helios+ cells (A) and FoxP3+Helios− cells (B) in healthy donors (HD) and in SLE patients with different levels of clinical disease activity. C, Numbers of CD4+ T cells in SLE patients with different levels of clinical disease activity. D, Absolute numbers of FoxP3+Helios+ Treg cells in SLE patients with different levels of clinical disease activity. Each data point represents a single subject; bars show the mean ± SD. P values were determined by Student’s unpaired t-test.
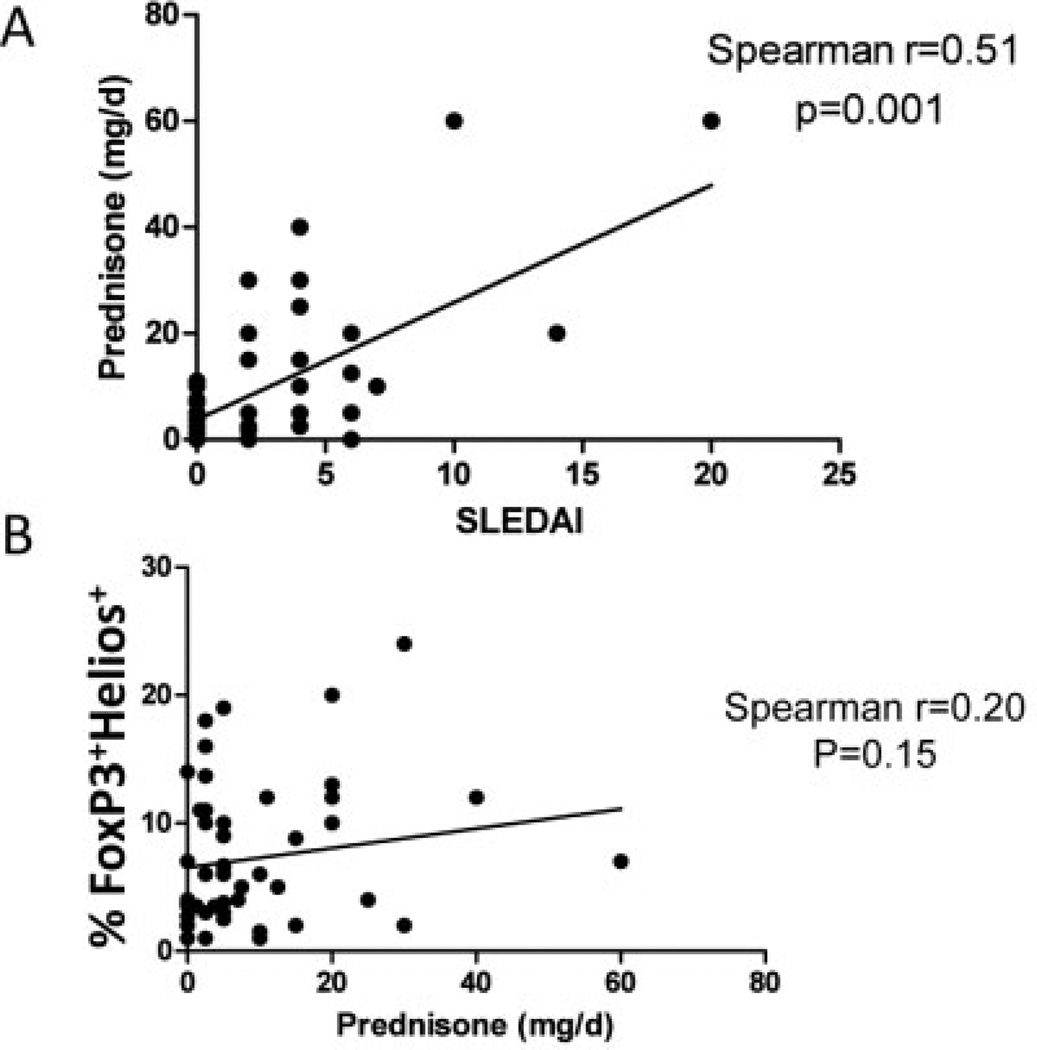
Use of corticosteroids has previously been shown to result in higher percentages of Treg cells in SLE patients (20). Although we observed a significant association between prednisone use and SLEDAI scores (Figure 6A), FoxP3+Helios + Treg cells did not correlate in a statistically significant way with the prednisone dosage across the entire spectrum of clinical activity (Figure 6B). These data strongly suggest that a positive association between the percentage of FoxP3+Helios+ Treg cells and the SLEDAI score is not primarily a reflection of the prednisone dosage.
Figure 6.
Lack of direct correlation between prednisone use and FoxP3+Helios + Treg cells in patients with systemic lupus erythematosus (SLE). A, Spearman’s rank correlation between the mean daily prednisone dose and clinical disease activity, as determined by Systemic Lupus Erythematosus Disease Activity Index (SLEDAI) scores. B, Spearman’s rank correlation between the percentage of FoxP3+Helios+ Treg cells and the daily prednisone dosage in SLE patients of all clinical disease activity groups.
DISCUSSION
In order to analyze the contribution of human Treg cells to the pathophysiology of SLE or any other autoimmune disease, it is necessary to have accurate and reliable criteria as to what constitutes a bona fide Treg cell in both normal individuals and patients with these conditions. Although it may seem to be a foregone conclusion that Treg cells are quantitatively or functionally deficient in SLE, much of the published data regarding Treg cell numbers in SLE patients rely on using CD25 and FoxP3, either alone or in combination, for the identification of Treg cells (21). We have shown that relative to healthy donors, SLE patients have greater overlap of CD25 expression between Treg cells and conventional T cells. Furthermore, CD25-CD4+ T cells from SLE patients have been shown by other investigators to include FoxP3 + Treg cells with suppressive functions (11). Therefore, the use of CD25 as a marker for the identification of Treg cells, even in combination with CD127− cells, may underrepresent the number of Treg cells in conditions in which IL-2 production is compromised as it is in SLE (22).
Other groups of investigators have emphasized the importance of using CD45RA and relative FoxP3 expression levels in order to distinguish different functional subsets of Treg cells (18). One major problem with this model is that it is not possible to sort viable Treg cells based on the level of FoxP3 expression. While Miyara et al claim that the level of CD25 expression mirrors the level of FoxP3 expression, such a scenario may not be true in a disease such as SLE. Since ∼70% of FoxP3+ T cells are found in the CD45RA−FoxP3low (fraction III in Miyara’s study) subpopulation in normal healthy adults and SLE patients (present study) and since this population is composed of “non–Treg cells” as defined by Miyara et al, major questions must be raised about the utility of using FoxP3 alone as a marker of bona fide Treg cells. Furthermore, the model proposed by Miyara et al is not readily applicable to cells from many patients over the age of 25 years, since the percentage of CD45RA+ Treg cells decreases steadily with age. It is highly likely that the CD45RA−FoxP3low subset (Miyara’s fraction III) is markedly heterogeneous and contains a substantial percentage of bona fide Treg cells.
Our previous studies divided FoxP3+ Treg cells from both mice and humans into 2 subpopulations based on the expression of the transcription factor Helios. A number of correlative experiments suggested that FoxP3 + Helios+ Treg cells were thymus derived, whereas FoxP3+Helios− T cells were generated peripherally. Although some studies in mice have demonstrated that Helios can be expressed on induced FoxP3+ T cells, there is little doubt that Helios expression is a valid marker of functional Treg cells. All FoxP3+ Helios+ Treg cells from both mice and humans exhibit highly demethylated TSDR regions of the FoxP3 gene, which further validates the utility of this marker (13). Our observation that at least 50% of the cells in fraction III described by Miyara et al express Helios and fail to produce IL-2 or IFNγ is strong evidence against the exclusion of these cells as “non–Treg cells” and calls into question the utility of this model for the separation of subsets of human Treg cells.
The present study, together with a recently published similar study (23), shows that the combination of Helios with FoxP3 is a superior method for identifying Treg cell numbers in SLE patients. By collecting data on absolute CD4 numbers, we were able to calculate the absolute numbers of FoxP3+Helios+ Treg cells. We compared the absolute numbers of FoxP3+Helios+ Treg cells in healthy donors and SLE patients and included a subset of SLE patients with inactive disease. Whereas patients with inactive disease showed percentages of FoxP3+Helios+ Treg cells that were similar to those in healthy donors, patients with more active disease had higher percentages of FoxP3+Helios+ Treg cells as compared to the patients with inactive disease and compared to healthy donors. Due to a decline in the absolute CD4 count in patients with more active SLE, as has been previously been reported in the literature (24), the absolute numbers of FoxP3+Helios+ Treg cells are not significantly changed between SLE patients and healthy donors and are maintained in the presence of varying levels of clinical activity. It remains to be seen whether FoxP3+Helios+ Treg cell numbers are preserved in untreated SLE patients with the highest clinical activity (SLEDAI score of ≥10). While we did study samples from a significant number of patients with active SLE, only a few (∼8% [4 of 52]) had a SLEDAI score of ≥10. Of note, in those with the highest SLE activity, the mean percentage of FoxP3+Helios+ Treg cells was 11.5% of CD4+ T cells, as compared to 4.5% in patients with inactive SLE.
The previously reported observations of low levels of IL-2 in some SLE patients (22) as well as evidence that IFNα can negatively influence Treg cell expansion (7) would have predicted that Treg cell homeostasis is disrupted in active SLE. It is therefore unclear by what mechanism FoxP3+Helios Treg cells might be maintained or even increased in SLE patients with more active disease. It remains possible that FoxP3+Helios+ Treg cells are maintained via stimulation by cytokines other than IL-2 or are stimulated by the heightened level of general T cell activation, which has been documented in SLE (6). The increased percentage of FoxP3+Helios + Treg cells may indicate an attempt, albeit unsuccessful, by the immune system to correct for “runaway” activation of conventional T cells. While the Treg cell numbers may be adequate, conventional T cells and other targets of Treg cell inhibition may be resistant to suppression due to their heightened activation by direct antigen receptor stimulation, by cytokines such as IFNα or IL-6, or through Toll-like receptor activation (25–27).
Workers in our laboratory are actively trying to identify a cell surface marker on human T cells that can differentiate between Helios− and Helios+ Treg cells so that the FoxP3+Helios+ Treg cells can be tested directly in a functional suppression assay. Absent the ability to isolate live FoxP3+Helios+ Treg cells, we rely on FoxP3 TSDR hypomethylation and very low cytokine production as evidence that the Helios + subset of FoxP3+ CD4+ T cells are most likely to have suppressive functions.
It is also important to keep in mind that the majority of studies of Treg cells in SLE, including the present study, are limited to the peripheral blood compartment and may not directly reflect the numbers of Treg cells that are present in the tissues with end-organ damage in SLE (28). Future studies directed at identifying Treg cells in situ in tissue samples from SLE patients may benefit from the combination of Helios and FoxP3 markers as a more reliable method by which to identify bona fide Treg cells.
Until we and other investigators are able to determine whether functional Treg cells are present in sufficient numbers to suppress harmful effector cell actions in target tissues in SLE, we will not be able to conclusively answer whether Treg cells are an essential part of the pathophysiology of SLE or just innocent bystanders. In order to justify focusing therapeutic approaches on Treg cells in SLE and other autoimmune conditions (29), it will be necessary to use the best methods for accurately identifying Treg cells with the highest suppressive potential, including after ex vivo expansion. We assert that Helios in combination with FoxP3 is currently the best way to identify the majority of bona fide human Treg cells for this purpose.
ACKNOWLEDGMENTS
We thank Ms Donna Hardwick and Gema Souto-Adeva for their help with collecting the clinical samples.
Supported by the NIH (Intramural Research Programs of the National Institute of Allergy and Infectious Diseases, the National Institute of Arthritis and Musculoskeletal and Skin Diseases, and the National Institute of Dental and Craniofacial Research).
Footnotes
AUTHOR CONTRIBUTIONS
All authors were involved in drafting the article or revising it critically for important intellectual content, and all authors approved the final version to be published. Dr. Golding had full access to all of the data in the study and takes responsibility for the integrity of the data and the accuracy of the data analysis.
Study conception and design. Golding, Hasni, Illei, Shevach.
Acquisition of data. Golding, Hasni, Illei.
Analysis and interpretation of data. Golding, Hasni, Illei, Shevach.
ADDITIONAL DISCLOSURES
Author Illei is currently an employee of MedImmune, but was employed by the National Institute of Dental and Craniofacial Research, National Institutes of Health, during the time the study was conducted.
REFERENCES
- 1.Sakaguchi S, Miyara M, Costantino CM, Hafler DA. FOXP3+ regulatory T cells in the human immune system. Nat Rev Immunol. 2010;10:490–500. doi: 10.1038/nri2785. [DOI] [PubMed] [Google Scholar]
- 2.Kinnunen T, Chamberlain N, Morbach H, Choi J, Kim S, Craft J, et al. Accumulation of peripheral autoreactive B cells in the absence of functional human regulatory T cells. Blood. 2013;121:1595–1603. doi: 10.1182/blood-2012-09-457465. [DOI] [PMC free article] [PubMed] [Google Scholar]
- 3.Bennett CL, Christie J, Ramsdell F, Brunkow ME, Ferguson PJ, Whitesell L, et al. The immune dysregulation, polyendocrinopathy, enteropathy, X-linked syndrome (IPEX) is caused by mutations of FOXP3. Nat Genet. 2001;27:20–21. doi: 10.1038/83713. [DOI] [PubMed] [Google Scholar]
- 4.Michels-van Amelsfort JM, Walter GJ, Taams LS. CD4+CD25+ regulatory T cells in systemic sclerosis and other rheumatic diseases. Expert Rev Clin Immunol. 2011;7:499–514. doi: 10.1586/eci.11.28. [DOI] [PubMed] [Google Scholar]
- 5.Scheinecker C, Bonelli M, Smolen JS. Pathogenetic aspects of systemic lupus erythematosus with an emphasis on regulatory T cells. J Autoimmun. 2010;35:269–275. doi: 10.1016/j.jaut.2010.06.018. [DOI] [PubMed] [Google Scholar]
- 6.Crisp´ın JC, Kyttaris VC, Terhorst C, Tsokos GC. T cells as therapeutic targets in SLE. Nat Rev Rheumatol. 2010;6:317–325. doi: 10.1038/nrrheum.2010.60. [DOI] [PMC free article] [PubMed] [Google Scholar]
- 7.Golding A, Rosen A, Petri M, Akhter E, Andrade F. Interferon-α regulates the dynamic balance between human activated regulatory and effector T cells: implications for antiviral and autoimmune responses. Immunology. 2010;131:107–117. doi: 10.1111/j.1365-2567.2010.03280.x. [DOI] [PMC free article] [PubMed] [Google Scholar]
- 8.Mesquita D, de Melo Cruvinel W, Araujo J, Pucci F, Salmazi K, Kallas E, et al. Systemic lupus erythematosus exhibits a dynamic and continuum spectrum of effector/regulatory T cells. Scand J Rheumatol. 2011;40:41–50. doi: 10.3109/03009742.2010.489229. [DOI] [PubMed] [Google Scholar]
- 9.Gavin MA, Torgerson TR, Houston EE, DeRoos PP, Ho WY, Stray-Pedersen AA, et al. Single-cell analysis of normal and FOXP3-mutant human T cells: FOXP3 expression without regulatory T cell development. Proc Natl Acad Sci U S A. 2006;103:6659–6664. doi: 10.1073/pnas.0509484103. [DOI] [PMC free article] [PubMed] [Google Scholar]
- 10.Tran DQ, Ramsey H, Shevach EM. Induction of FOXP3 expression in naive human CD4+FOXP3− T cells by T-cell receptor stimulation is transforming growth factor β-dependent but does not confer a regulatory phenotype. Blood. 2007;110:2983–2990. doi: 10.1182/blood-2007-06-094656. [DOI] [PMC free article] [PubMed] [Google Scholar]
- 11.Bonelli M, Savitskaya A, Steiner CW, Rath E, Smolen JS, Scheinecker C. Phenotypic and functional analysis of CD4+CD25− Foxp3+ T cells in patients with systemic lupus erythematosus. J Immunol. 2009;182:1689–1695. doi: 10.4049/jimmunol.182.3.1689. [DOI] [PubMed] [Google Scholar]
- 12.Thornton AM, Korty PE, Tran DQ, Wohlfert EA, Murray PE, Belkaid Y, et al. Expression of Helios, an Ikaros transcription factor family member, differentiates thymic-derived from peripherally induced Foxp3+ T regulatory cells. J Immunol. 2010;184:3433–3441. doi: 10.4049/jimmunol.0904028. [DOI] [PMC free article] [PubMed] [Google Scholar]
- 13.Kim YC, Bhairavabhotla R, Yoon J, Golding A, Thornton AM, Tran DQ, et al. Oligodeoxynucleotides stabilize Helios-expressing Foxp3+ human T regulatory cells during in vitro expansion. Blood. 2012;119:2810–2818. doi: 10.1182/blood-2011-09-377895. [DOI] [PMC free article] [PubMed] [Google Scholar]
- 14.Bombardier C, Gladman DD, Urowitz MB, Caron D, Chang DH the Committee on Prognosis Studies in SLE. Derivation of the SLEDAI: a disease activity index for lupus patients. Arthritis Rheum. 1992;35:630–640. doi: 10.1002/art.1780350606. [DOI] [PubMed] [Google Scholar]
- 15.Tan EM, Cohen AS, Fries JF, Masi AT, McShane DJ, Rothfield NF, et al. The 1982 revised criteria for the classification of systemic lupus erythematosus. Arthritis Rheum. 1982;25:1271–1277. doi: 10.1002/art.1780251101. [DOI] [PubMed] [Google Scholar]
- 16.Hochberg MC for the Diagnostic and Therapeutic Criteria Committee of the American College of Rheumatology. Updating the American College of Rheumatology revised criteria for the classification of systemic lupus erythematosus [letter] Arthritis Rheum. 1997;40:1725. doi: 10.1002/art.1780400928. [DOI] [PubMed] [Google Scholar]
- 17.Seddiki N, Santner-Nanan B, Martinson J, Zaunders J, Sasson S, Landay A, et al. Expression of interleukin (IL)-2 and IL-7 receptors discriminates between human regulatory and activated T cells. J Exp Med. 2006;203:1693–1700. doi: 10.1084/jem.20060468. [DOI] [PMC free article] [PubMed] [Google Scholar]
- 18.Miyara M, Yoshioka Y, Kitoh A, Shima T, Wing K, Niwa A, et al. Functional delineation and differentiation dynamics of human CD4+ T cells expressing the FoxP3 transcription factor. Immunity. 2009;30:899–911. doi: 10.1016/j.immuni.2009.03.019. [DOI] [PubMed] [Google Scholar]
- 19.Floess S, Freyer J, Siewert C, Baron U, Olek S, Polansky J, et al. Epigenetic control of the foxp3 locus in regulatory T cells. PLoS Biol. 2007;5:e38. doi: 10.1371/journal.pbio.0050038. [DOI] [PMC free article] [PubMed] [Google Scholar]
- 20.Prado C, Gomez J, Lopez P, de Paz B, Gutierrez C, Suarez A. Dexamethasone upregulates FOXP3 expression without increasing regulatory activity. Immunobiology. 2011;216:386–392. doi: 10.1016/j.imbio.2010.06.013. [DOI] [PubMed] [Google Scholar]
- 21.Horwitz DA. Regulatory T cells in systemic lupus erythematosus: past, present and future. Arthritis Res Ther. 2008;10:227. doi: 10.1186/ar2511. [DOI] [PMC free article] [PubMed] [Google Scholar]
- 22.Solomou EE, Juang YT, Gourley MF, Kammer GM, Tsokos GC. Molecular basis of deficient IL-2 production in T cells from patients with systemic lupus erythematosus. J Immunol. 2001;166:4216–4222. doi: 10.4049/jimmunol.166.6.4216. [DOI] [PubMed] [Google Scholar]
- 23.Alexander T, Sattler A, Templin L, Kohler S, Gross C, Meisel A, et al. Foxp3+Helios+ regulatory T cells are expanded in active systemic lupus erythematosus. Ann Rheum Dis. 2013;72:1549–1558. doi: 10.1136/annrheumdis-2012-202216. [DOI] [PubMed] [Google Scholar]
- 24.Vila LM, Alarcon GS, McGwin G, Jr, Bastian HM, Fessler BJ, Reveille JD for the LUMINA Study Group. Systemic lupus erythematosus in a multiethnic US cohort. XXXVII. Association of lymphopenia with clinical manifestations, serologic abnormalities, disease activity, and damage accrual. Arthritis Rheum. 2006;55:799–806. doi: 10.1002/art.22224. [DOI] [PubMed] [Google Scholar]
- 25.Yan B, Ye S, Chen G, Kuang M, Shen N, Chen S. Dysfunctional CD4+,CD25+ regulatory T cells in untreated active systemic lupus erythematosus secondary to interferon-a-producing antigen-presenting cells. Arthritis Rheum. 2008;58:801–812. doi: 10.1002/art.23268. [DOI] [PubMed] [Google Scholar]
- 26.Goodman WA, Young AB, McCormick TS, Cooper KD, Levine AD. Stat3 phosphorylation mediates resistance of primary human T cells to regulatory T cell suppression. J Immunol. 2011;186:3336–3345. doi: 10.4049/jimmunol.1001455. [DOI] [PMC free article] [PubMed] [Google Scholar]
- 27.Pasare C, Medzhitov R. Toll pathway-dependent blockade of CD4+CD25+ T cell-mediated suppression by dendritic cells. Science. 2003;299:1033–1036. doi: 10.1126/science.1078231. [DOI] [PubMed] [Google Scholar]
- 28.Van Amelsfort JM, Jacobs KM, Bijlsma JW, Lafeber FP, Taams LS. CD4+CD25+ regulatory T cells in rheumatoid arthritis: differences in the presence, phenotype, and function between peripheral blood and synovial fluid. Arthritis Rheum. 2004;50:2775–2785. doi: 10.1002/art.20499. [DOI] [PubMed] [Google Scholar]
- 29.Bluestone JA. The yin and yang of interleukin-2-mediated immunotherapy. N Engl J Med. 2011;365:2129–2131. doi: 10.1056/NEJMe1110900. [DOI] [PubMed] [Google Scholar]


