Abstract
Transaldolase (TA) exchange overestimates gluconeogenesis measured with deuterated water (2H2O). However, it is unknown whether TA differs in people with type 2 diabetes (T2DM). 2H2O was ingested, and [1-13C]acetate and [3-3H]glucose were infused in T2DM (n = 10) and healthy nondiabetic (ND; n = 8) subjects. TA was assessed from the ratio of 13C3 to 13C4 glucose enrichment (13C3/13C4) measured by 13C NMR. Glucose turnover was measured before (∼16-h fast) and during hyperglycemic (∼10 mM) moderate-dose insulin (∼0.35 mU·kg−1·min−1) clamp. 13C3/13C4 in T2DM vs. ND was <1.0 and not different at baseline and clamp, indicating equivalent TA. To determine whether incomplete triose phosphate isomerase (TPI) exchange contributed to asymmetric 13C3/13C4, [U-13C]glycerol was infused in lieu of [1-13C]acetate during a separate visit in a subset of ND (n = 7) subjects. Ratio of 13C3/13C4 obtained following either tracer was <1.0 at baseline and during clamp, indicating that TPI exchange was essentially complete and did not contribute to asymmetric glucose enrichment. Uncorrected and corrected rates of gluconeogenesis were no different (P = not significant) in T2DM vs. ND both at baseline and during clamp. TA correction resulted in equivalent estimates of corrected gluconeogenesis in T2DM and ND that were ∼25–35% lower than uncorrected gluconeogenesis both at baseline and during the clamp. The asymmetric enrichment of glucose from 13C-gluconeogenic tracers is attributable to TA exchange and can be utilized to correct for TA exchange. In conclusion, TA exchange does not differ between T2DM and ND under fasting or hyperglycemic clamp conditions, and the 2H2O method continues to provide an accurate estimation of gluconeogenesis.
Keywords: gluconeogenesis, deuterated water, transaldolase, triose phosphate isomerase
after an overnight fast, plasma glucose is not symmetrically labeled from gluconeogenic carbon tracers such as [U-13C]glycerol (21) and [3-14C]lactate (25). Exchange of fructose 6-phosphate and triose phosphate mediated by transaldolase has been implicated by us (3, 7, 9) and others (12) in overestimation of rates of gluconeogenesis, utilizing the deuterated water method. In this method, glucose derived from glycogenolysis (GGL) via glucose 6-phosphate (G6P) source can become labeled in carbons 4, 5, and 6 from either a carbon-labeled gluconeogenic precursor or deuterated water independent of gluconeogenesis. This results in an overestimation of the gluconeogenic fraction and a corresponding underestimation of the glycogenolytic contribution to endogenous glucose production. This exchange is particularly important in the study of type 2 diabetes mellitus (T2DM) since it mimics the characteristic shift toward increased hepatic gluconeogenic activity during the progression of this disease. With a few exceptions (14), stable isotope tracer studies indicate an increased fractional gluconeogenesis in overnight-fasted T2DM subjects compared with healthy nondiabetic (ND) controls (6, 10, 15, 16, 28). Transaldolase (TA) exchange activity has been implicated in both ND and T2DM subjects from the depletion of position 5 relative to position 3 label following metabolism of [3,5-2H2]galactose to glucose (7). However, it is not known whether transaldolase exchange activity is different between ND and T2DM under conditions of fasting and hyperglycemia (frequently seen with meals). This study was undertaken to compare TA exchange reaction in ND and T2DM subjects using [1-13C]acetate infusion under conditions of fasting and during a hyperglycemic moderate-dose insulin clamp to determine whether or not TA exchange activity explains differences in glucose enrichment from gluconeogenic substrates between ND and T2DM subjects.
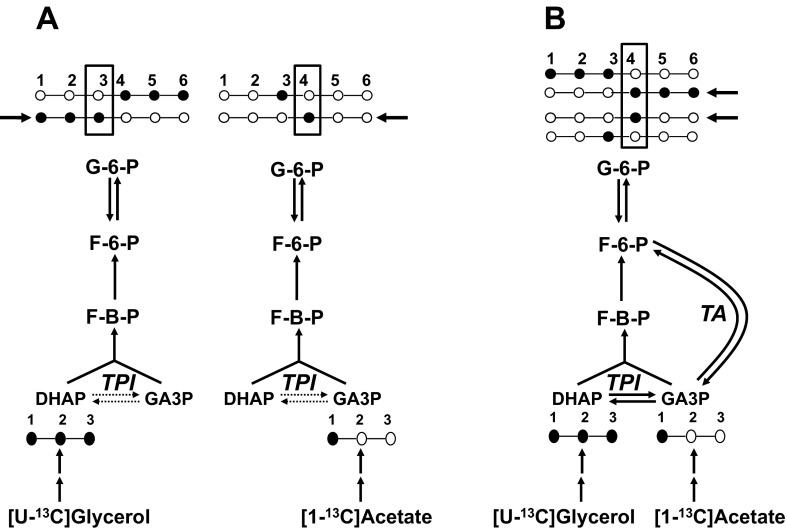
We have demonstrated that TA activity occurs in healthy humans based on a higher enrichment of glucose carbon 4 over carbon 3 (i.e., 13C3/13C4 < 1.0) from [1-13C]acetate (3). In this study, the asymmetric labeling of glucose from this tracer could also be explained by incomplete exchange of the label between glyceraldehyde 3-phosphate and dihydroxyacetone phosphate mediated by incomplete triose phosphate isomerase (TPI; see Fig. 1). When the carbon label is derived from glycerol instead of acetate, incomplete TPI exchange results in the opposite glucose C3/C4 labeling asymmetry (i.e., 13C3/13C4 > 1.0), whereas TA activity promotes a higher enrichment of glucose carbon 4 relative to carbon 3 for both tracers (21). Thus, by comparing glucose 13C3/13C4 from both acetate and glycerol, the contributions of incomplete TPI exchange and TA activity to the glucose-labeling asymmetry can be resolved.
Fig. 1.
Schematic highlighting the effects of incomplete triose phosphate isomerase (TPI) exchange and transaldolase (TA) exchange on the distribution of glucose 13C isotopomers (●, 13C; ○, 12C) and 13C enrichment of glucose carbon 3 and 4 positions (highlighted by the boxes) from [U-13C]glycerol and [1-13C]acetate. Glucose isotopomers favored by partial TPI exchange only (A) and TA activity in the presence of complete TPI exchange (B) are indicated by the bold arrows. When TPI exchange is complete, the 2 tracers generate equivalent glucose 13C3/13C4 ratios, and these are modified in the same manner by TA exchange (i.e., 13C3/13C4 < 1.0). DHAP, dihydroxyacetone phosphate; G6P, glucose 6-phosphate; FBP, fructose 1,6-bisphosphate; F6P, fructose 6-phosphate; GA3P, glyceraldehyde 3-phosphate.
Therefore, we also compared the 13C enrichment of glucose from [1-13C]acetate and [U-13C]glycerol in a subset of ND subjects to determine the extent to which asymmetric glucose C3 and C4 enrichments are determined by incomplete TPI exchange and by TA exchange.
RESEARCH DESIGN AND METHODS
After approval from the Mayo Institutional Review Board was given for our experiments, 11 T2DM and 10 ND subjects gave written informed consent to participate in the study. Data from one T2DM and two ND subjects were excluded from analyses due to insufficient 13C3 and 13C4 glucose enrichments for reliable quantification of 13C3/13C4. All subjects were in good health and at stable weights. None regularly engaged in exercise training programs. None of the first-degree relatives of the healthy subjects had a history of diabetes mellitus. At the time of screening, one of the T2DM subjects was being treated with lifestyle modification alone; eight T2DM subjects were being treated with metformin and two on a combination of a sulfonylurea and metformin. Thiazolidinedione and glucagon-like peptide-1-based therapies were exclusionary. Oral antihyperglycemic medications were discontinued 10 days prior to study. All subjects were instructed to maintain their body weight constant and follow a weight maintenance diet (55% carbohydrate, 30% fat, and 15% protein) ≥2 wk prior to study. Body composition was measured prior to the study visit in the Mayo Center for Translational Science Activities (CTSA) body composition core using Lunar iDXA software version 6.10 (GE Healthcare Technologies, Madison, WI), and waist/hip ratio was measured at screen visit. Subject characteristics are given in Table 1.
Table 1.
Subject characteristics
| Characteristic | Healthy | T2DM |
|---|---|---|
| Age, yr | 60 ± 12 | 64 ± 8.7 |
| Sex (M/F) | 4/4 | 6/4 |
| Weight, kg | 95.0 ± 21.5 | 86.1 ± 12.5 |
| BMI, kg/m2 | 31.8 ± 4.7 | 30.6 ± 3.7 |
| Lean body mass, kg | 51.5 ± 11.7 | 49.8 ± 10.2 |
| Fasting plasma glucose, mg/dl | 90 ± 5 | 143.0 ± 49.4* |
| Hb A1c,% (mmol/mol) | 5 ± 0.2 (31 ± 2) | 7.1 ± 0.6 (54 ± 7)* |
| Waist/hip ratio | 0.9 ± 0.1 | 1.0 ± 0.1 |
Values are means ± SD. T2DM, type 2 diabetes mellitus; M, male; F, female.
P < 0.05 vs. healthy.
Experimental Design
Subjects were admitted to the clinical research unit of the Mayo CTSA at ∼1700 on the evening before the study and provided a standard supper (10 calories/kg; carbohydrate/fat/protein, 55:30:15). Subjects then ingested 1.67 g/lean body wt 2H2O in three equally divided doses at 2200, 2400, and 0200. Thereafter, the subjects were permitted sips of water containing 2H2O if they so desired but otherwise remained fasting.
Subjects were awakened the following morning and catheters were placed in forearm veins for tracer infusion and sampling of arterialized venous blood as previously described (8). At 0600 (−180 min) infusions of [3-3H]glucose (12 μCi prime and 0.12 μCi/min continuous), and [1-13C]acetate (5.0 μmol·kg−1·min−1) or [U-13C]glycerol (0.5 μmol·kg−1·min−1) were started and continued until the end of study at 1300. At ∼0630, 1 g of acetaminophen was given and repeated at ∼0845 to enable measurement of urinary glucuronide. At time zero, somatostatin (60 ng·kg−1·min−1), insulin (0.35 mU·kg−1·min−1), and glucagon (0.65 ng·kg−1·min−1) were started to ensure constant and equal portal concentrations of insulin and glucagon (3, 8). Blood was sampled for glucose, [3-3H]glucose-specific activity, and hormones at −30 and 0, 60, 120, 180, 210, and 240 min. Pooled samples for [3-13C]glucose, [4-13C]glucose, and [5-2H]glucose and [2-2H]glucose enrichments were obtained (3).
An infusion of 50% dextrose containing [3-3H]glucose was started at time zero and given in amounts sufficient to clamp plasma glucose at ∼180 mg/dl, as described previously (8). In addition, the basal infusion of [3-3H]glucose was tapered beginning at time zero in a pattern that mimicked the anticipated changes in glucose production to minimize the changes in plasma glucose-specific activity, as described previously (2, 5).
Analytical Methods
Samples at −30 and 0 min were combined for baseline and 210 and 240 min for clamp measurements of 2H and 13C enrichments by 2H and 13C NMR analysis of monoacetone glucose (MAG). All blood samples were immediately placed on ice, centrifuged at 4°C, separated, and stored at −80°C until analyses. Plasma glucose was analyzed using a GM9 Analox glucose analyzer (Analox Instruments, London, UK). Plasma insulin, C-peptide, and glucagon concentrations and [3-3H]glucose-specific activity were measured as described previously (2, 3).
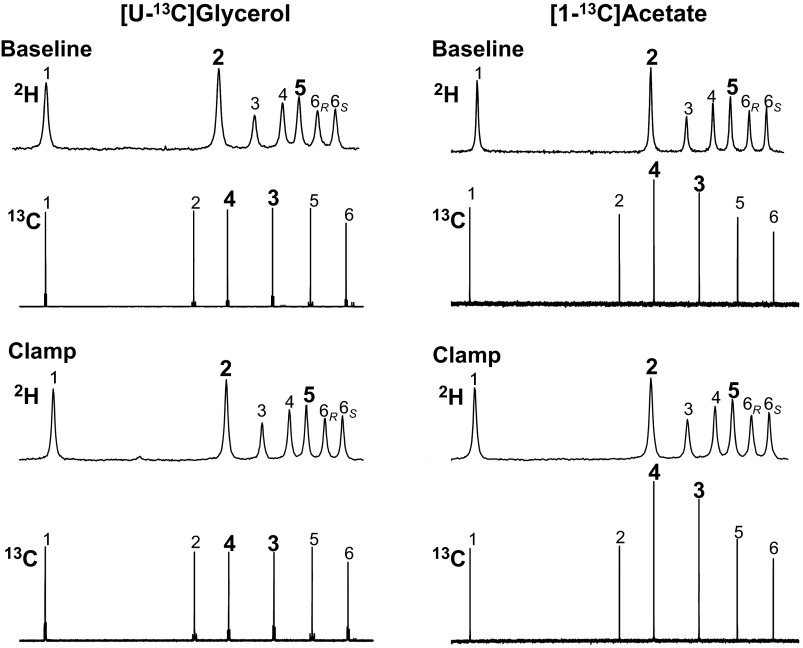
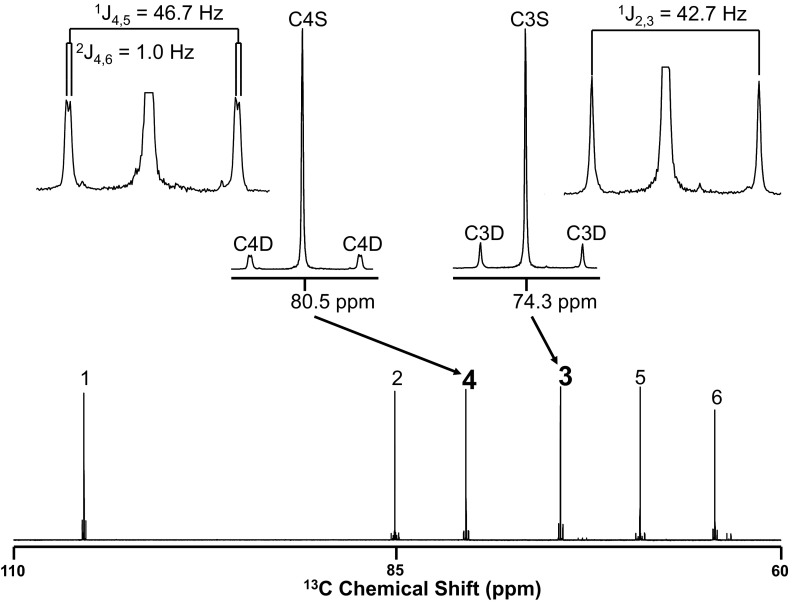
13C-excess enrichment of glucose carbons 3 and 4 from [1-13C]acetate was measured by quantitative 13C and 1H NMR analysis (see Fig. 2) of the MAG derivative, as described previously (19, 20). 13C-excess enrichment of glucose carbons 3 and 4 from [U-13C]glycerol was measured from partially saturated and no nuclear Overhauser enhancement (nOe-enhanced) proton-decoupled 13C NMR spectra by analyzing the carbon 3 and carbon 4 isotopomer signals (see Fig. 3). Briefly, the singlet component of each signal was assumed to represent the 1.11% natural abundance 13C, and the doublet components were assumed to represent 13C enrichment of plasma glucose from [U-13C]glycerol. Excess 13C enrichment was calculated as the ratio of doublet to singlet multiplied by 1.11% (21). The 13C NMR analyses were performed with a BrukerAvance III 600 system equipped with a 5-mm TCP-QNP cold probe. 2H NMR spectra were acquired at 50°C with a 14.1T Varian VNMR system, as described previously (19, 20). 2H enrichment was calculated by comparing the hexose positional 2H signal intensities with those of the MAG methyl signals enriched to 2% 2H (19). NMR signals were quantified using the NUTS NMR spectral analysis program (Acorn NMR, Fremont, CA).
Fig. 2.
2H NMR and 13C NMR spectra of monoacetone glucose derivative from plasma glucose of a healthy subject administered with 2H2O and infused with [U-13C]glycerol and [1-13C]acetate in separate visits. Spectra were obtained at baseline and during a clamp. Nos. above the signals indicate their position in the glucose molecule. The chemical shift axes of the spectra are omitted for clarity.
Fig. 3.
High-resolution view of the baseline [U-13C]glycerol 13C NMR spectrum shown in Fig. 2. The carbon 3 and carbon 4 isotopomer signals and their 1- and 2-bond coupling constants are shown in expanded form.
Calculations
All rates are expressed per lean body mass. Glucose turnover was calculated using the steady-state equations of Steele, as described previously (27). The fraction of plasma glucose derived from TA exchange was calculated from the ratio of excess glucose carbon 3 to carbon 4 13C enrichments (13C3/13C4) (3). Endogenous glucose production (EGP) was calculated by subtracting the glucose infusion rate required to maintain hyperglycemia from total glucose appearance. Gluconeogenesis was calculated by multiplying the ratio of deuterium enrichment of positions 5 and 2 of glucose (2H5/2H2) times endogenous glucose production. GGL was calculated by subtracting gluconeogenesis from EGP, as described previously (8). TA-corrected rates of gluconeogenesis and GGL were calculated as published previously (3, 4).
Statistical Analysis
Data in the text and figures are expressed as means ± SE. Values from −30 and 0 min were averaged as basal and at 210 and 240 min as clamp for statistical analysis and representation. Student's paired one-tailed t-test was used to test the hypothesis that plasma glucose 13C3/13C4 is less than one, and Student's unpaired two-tailed t-test was used to test differences between groups. A P value <0.05 was considered statistically significant.
RESULTS
Effects of TA Exchange
Plasma glucose, insulin, C-peptide, and glucagon concentrations.
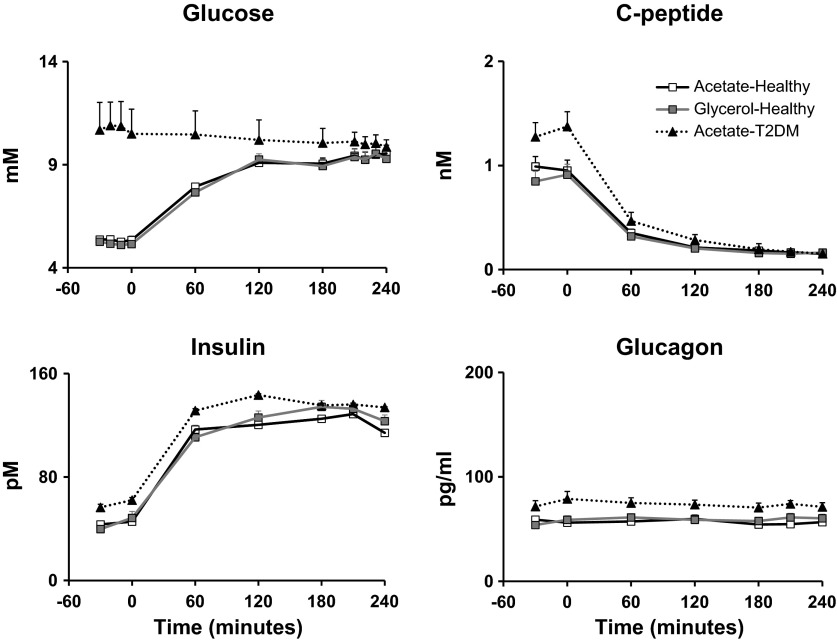
Fasting plasma glucose concentrations (Fig. 4) were higher (P < 0.0001) in subjects with T2DM than in ND subjects at baseline (10.74 ± 0.72 vs. 5.34 ± 0.15 mM) but were matched [P = not significant (NS)] during the clamp (10.00 ± 0.52 vs. 9.43 ± 0.13 mM) (Fig. 4). Fasting insulin concentrations (Fig. 4) were significantly higher (P < 0.05) in T2DM than in ND subjects at baseline (59.34 ± 7.30 vs. 34.65 ± 5.59 pM) but did not differ (P = NS) during the clamp (134.94 ± 4.64 vs. 126.30 ± 7.99 pM). Similarly, C-peptide concentrations (Fig. 4) were significantly higher (P < 0 .05) in T2DM than in ND subjects before the clamp (1.32 ± 0.13 vs. 0.97 ± 0.13 nM) but were no different (P = NS) during the clamp (0.16 ± 0.02 vs. 0.16 ± 0.02 nM), indicating that there was suppression of endogenous insulin secretion in both groups. Glucagon concentrations (Fig. 4) were significantly higher (P < 0 .05) in T2DM than in ND subjects before the clamp (78.67 ± 5.37 vs. 57.56. ± 5.09 nM) and, as expected, were not different (P = NS) during the clamp (65.17 ± 2.71 vs. 56.25 ± 3.20 nM).
Fig. 4.
Plasma glucose, insulin, C-peptide, and glucagon concentrations observed before and during the clamp on [1-13C]acetate infusion in healthy (□) and type 2 diabetes mellitus (T2DM; ▲) subjects and on[U-13C]glycerol infusion in healthy subjects (gray squares). An insulin infusion was started at time zero.
Glucose infusion rate and [3-3H]glucose-specific activity.
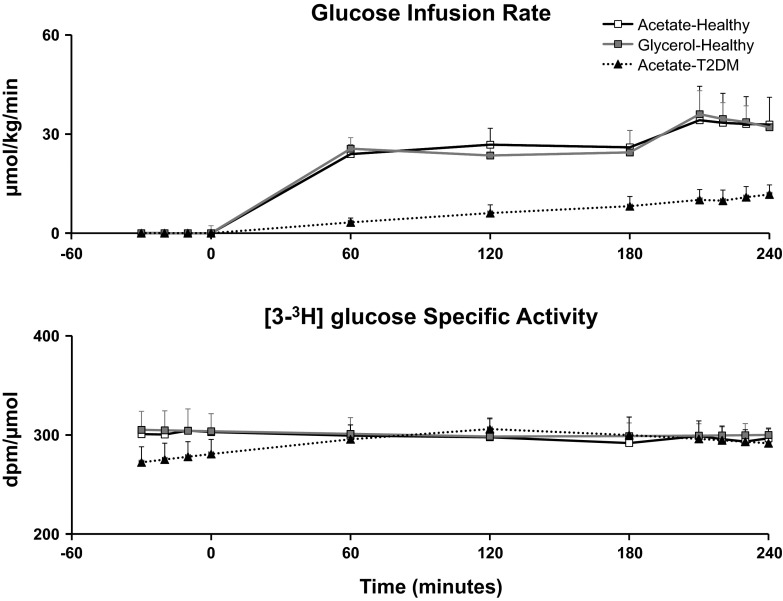
The glucose infusion rate (Fig. 5) required to maintain hyperglycemia (∼10 mM) during the clamp was significantly lower (P < 0.05) in T2DM than in ND subjects (10.63 ± 3.08 vs. 33.39 ± 8.93 μmol·kg−1·min−1) (Fig. 5).
Fig. 5.
Top: glucose infusion rate required to maintain target glucose concentrations (∼10 mM) during [1-13C]acetate infusion in healthy (□) and T2DM subjects (▲) and [U-13C]glycerol infusion in healthy subjects (gray squares). Bottom: plasma [3-3H]glucose-specific activity during [1-13C]acetate infusion in healthy (□) and T2DM subjects (▲) and [U-13C]glycerol infusion in healthy subjects (gray squares).
Plasma [3-3H]glucose-specific activity (Fig. 5) remained constant throughout the study in both groups, enabling measurement of glucose fluxes using steady-state equations.
Plasma glucose 13C enrichments and ratio of 13C3/13C4 obtained from [1-13C]acetate.
13C NMR spectra of plasma MAG obtained following infusion of [1-13C]acetate demonstrate a consistently higher 13C NMR signal intensity of carbon 4 over carbon 3 (see Fig. 2 and Table 2). Since these spectra were acquired under quantitative conditions (i.e., no nuclear Overhauser enhancement during proton decoupling and full relaxation of the 13C signals between pulses) as in previous studies (3), these data (Table 2) indicate an excess 13C enrichment of carbon 4 over carbon 3 or ratio of 13C3/13C4 < 1.0. This is consistent with TA activity, where unlabeled G6P derived from GGL (under baseline conditions) or a combination of GGL and inflow of plasma glucose (under clamp conditions) is enriched in positions 4, 5, and 6 from labeled trioses. The 2H enrichment patterns that are revealed by the 2H NMR spectra also suggest that glucose 13C enrichment from [1-13C]acetate occurs because of TA exchange. For both ND and T2DM groups, there are substantial GGL and GGL/glucose contributions to EGP under baseline and clamp conditions, respectively, as seen by the ratio of positions 5 and 2 enrichments (Fig. 2 and Table 3), thereby providing a significant source of unlabeled G6P for TA exchange.
Table 2.
Plasma [3-13C]glucose/[4-13C]glucose ratios observed during transaldolase exchange and triose phosphate isomerase exchange
| [1-13C]Acetate Infusion | 13C3 enrichment | 13C4 enrichment | 13C3/13C4 |
|---|---|---|---|
| Baseline | |||
| Healthy | 0.29 ± 0.03 | 0.39 ± 0.03 | 0.72 ± 0.04 |
| T2DM | 0.26 ± 0.05 | 0.38 ± 0.06 | 0.66 ± 0.02 |
| Clamp | |||
| Healthy | 0.30 ± 0.03 | 0.43 ± 0.06 | 0.72 ± 0.05 |
| T2DM | 0.36 ± 0.06 | 0.52 ± 0.07 | 0.66 ± 0.03 |
| [U-13C]glycerol infusion | |||
| Healthy (baseline) | 0.46 ± 0.03 | 0.56 ± 0.02 | 0.81 ± 0.05 |
| Healthy (clamp) | 0.23 ± 0.02 | 0.32 ± 0.04 | 0.72 ± 0.04 |
Data are presented as means ± SE. 13C enrichment of glucose in carbons 3 and 4 in healthy subjects infused with [1-13C]acetate and [U-13C]glycerol and type 2 diabetic subjects with [1-13C]acetate alone under baseline and clamp conditions.
Table 3.
Deuterium enrichment in positions 5 and 2 of plasma glucose
| [1-13C]Acetate Infusion | 2H2 Enrichment | 2H5 Enrichment (Uncorrected) | 2H5/2H2 (Uncorrected) | 2H5 Enrichment (Corrected) | 2H5/2H2 (Corrected) |
|---|---|---|---|---|---|
| Baseline | |||||
| Healthy | 0.51 ± 0.03 | 0.29 ± 0.02 | 0.57 ± 0.03 | 0.20 ± 0.01 | 0.40 ± 0.01 |
| T2DM | 0.52 ± 0.03 | 0.29 ± 0.02 | 0.55 ± 0.02 | 0.19 ± 0.02 | 0.36 ± 0.02 |
| Clamp | |||||
| Healthy | 0.24 ± 0.04 | 0.14 ± 0.03 | 0.53 ± 0.03 | 0.10 ± 0.03 | 0.39 ± 0.04 |
| T2DM | 0.46 ± 0.02 | 0.25 ± 0.02 | 0.56 ± 0.03 | 0.17 ± 0.02 | 0.37 ± 0.03 |
| [U-13C]glycerol infusion | |||||
| Healthy (baseline) | 0.47 ± 0.02 | 0.27 ± 0.02 | 0.56 ± 0.02 | 0.22 ± 0.03 | 0.45 ± 0.05 |
| Healthy (clamp) | 0.20 ± 0.02 | 0.11 ± 0.01 | 0.54 ± 0.02 | 0.08 ± 0.01 | 0.39 ± 0.04 |
Data are presented as means ± SE. Deuterium (2H) enrichments of glucose on hydrogens 5 (2H5) and 2 (2H2) from ingested 2H2O and the 2H5/2H2 ratio uncorrected and corrected for transaldolase exchange in healthy and T2DM subjects infused with [1-13C]acetate and in healthy subjects infused with [U-13C]glycerol alone under baseline and clamp conditions.
Rates of EGP and glucose disappearance.
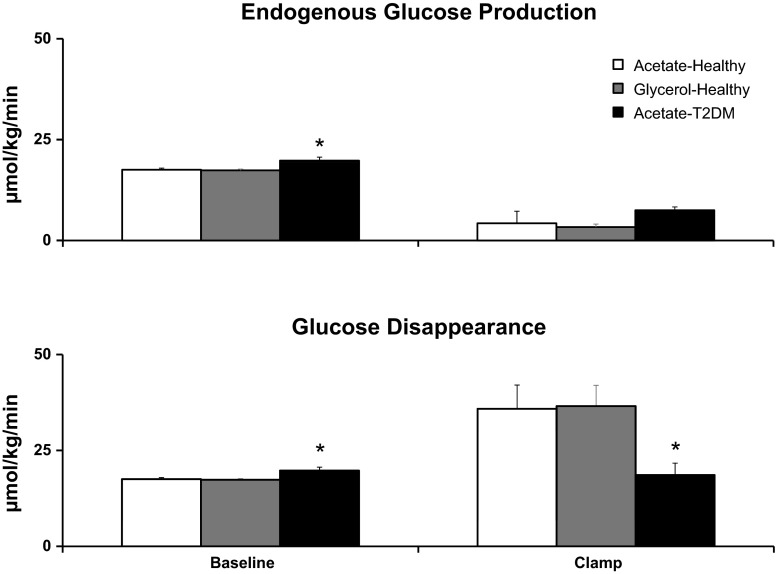
Rates of EGP (Fig. 6) were significantly higher (P < 0.05) in T2DM than in ND subjects at baseline (19.78 ± 0.75 vs. 17.53 ± 0. 44 μmol·kg−1·min−1) but similar (P = 0.06) during clamp (7.50 ± 0.69 vs. 4.27 ± 1.23 μmol·kg−1·min−1) (Fig. 6). Rates of glucose disappearance are equal to glucose production at baseline. Therefore, rates of glucose disappearance (Fig. 6) were significantly higher (P < 0.05) in T2DM than in ND subjects at baseline (19.78 ± 0.75 vs. 17.53 ± 0.44 μmol·kg−1·min−1) but lower during clamp (18.61 ± 3.10 vs. 35.85 ± 6.22 μmol·kg−1·min−1). The higher rates of EGP and glucose disappearance in T2DM than in ND subjects at baseline need to be interpreted in the light of higher glucose and insulin concentrations in T2DM during this period. In contrast, when glucose and insulin concentrations were matched between groups during the clamp, there were no statistically significant differences in rates of EGP, but rates of glucose disappearance were lower in T2DM than ND subjects.
Fig. 6.
Rates of endogenous glucose production and glucose disappearance observed at baseline and clamp during [1-13C]acetate infusion in healthy (open bars) and T2DM subjects (black bars) and [U-13C]glycerol infusion in healthy subjects (gray bars). *P < 0.05 vs. healthy acetate.
Rates of gluconeogenesis and GGL uncorrected and corrected for TA exchange.
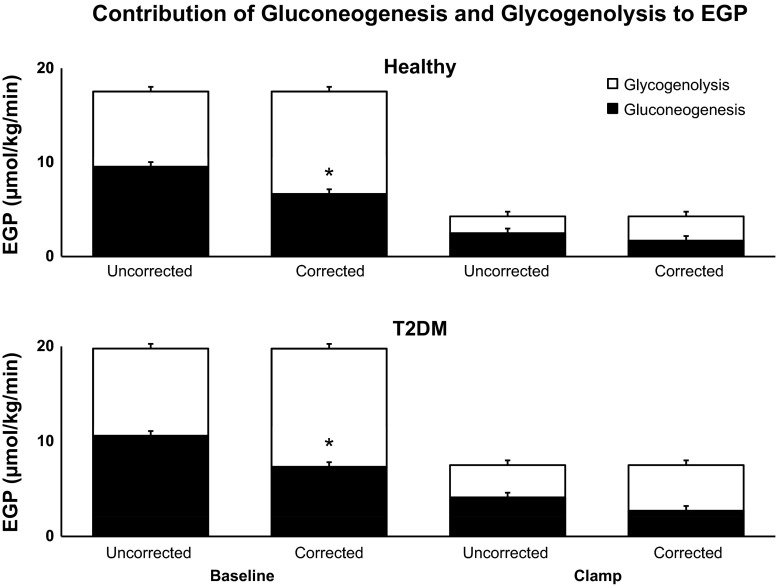
Corrected rates of gluconeogenesis (Fig. 7) in T2DM were lower (P < 0.05) than uncorrected rates of gluconeogenesis both prior to (7.32 ± 0.63 vs. 10.50 ± 0.78 μmol·kg−1·min−1) and during the clamp (2.71 ± 0.21 vs.4.11 ± 0.40 μmol·kg−1·min−1) (Fig. 7). Corrected rates of gluconeogenesis (Fig. 7) were lower (P < 0.05) than uncorrected rates of gluconeogenesis prior to (6.65 ± 0.43 vs. 9.54 ± 0.46 μmol·kg−1·min−1) but not during the clamp (1.68 ± 0.62 vs. 2.48 ± 0.78 μmol·kg−1·min−1) in ND subjects. The fractional difference between uncorrected and corrected rates of gluconeogenesis were not different (P = NS) between T2DM and ND subjects at baseline or during clamp, suggesting that the contribution of TA exchange to the estimate of fractional gluconeogenesis is no different between groups under these experimental conditions.
Fig. 7.
Contribution of gluconeogenesis (black bars) and glycogenolysis (open bars) to endogenous glucose production (EGP) observed during [1-13C]acetate infusion before and during the clamp in healthy and T2DM subjects, calculated using the uncorrected and corrected ratios of the deuterium enrichment on position 5 and position 2 of plasma glucose. *P < 0.05 vs. uncorrected gluconeogenesis.
Corrected rates of GGL (Fig. 7) in T2DM were higher (P < 0.05) than uncorrected rates of GGL both prior to (12.45 ± 0.58 vs.9.18 ± 0.65 μmol·kg−1·min−1) and during the clamp (4.80 ± 0.48 vs.3.40 ± 0.47 μmol·kg−1·min−1). In contrast, corrected rates of GGL (Fig. 7) were higher (P < 0.05) than uncorrected rates of GGL prior to (10.88 ± 0.36 vs. 7.99 ± 0.55 μmol·kg−1·min−1) but not during the clamp (2.59 ± 0.71 vs. 1.79 ± 0.46 μmol·kg−1·min−1) in ND subjects.
Effects of TPI Exchange
Plasma glucose, insulin, C-peptide, and glucagon concentrations.
Fasting plasma glucose concentrations (Fig. 4) in ND subjects were no different between [1-13C]acetate and [U-13C]glycerol studies (5.34 ± 0.15 vs. 5.17 ± 0.12 mM, P = NS; Fig. 4). Similarly, plasma glucose concentrations were also matched during the clamp (9.43 ± 0.13 vs.9.36 ± 0.40 mM, P = NS) on either occasion (Fig. 4). Plasma insulin concentrations (Fig. 4) were similar (P = NS) on both acetate as well as glycerol study days both prior to (34.65 ± 5.59 vs. 34.80 ± 4.61 pM) and during the clamp (126.30 ± 6.36 vs. 127.97 ± 4.37 pM). Similarly, C-peptide concentrations (Fig. 4) were no different (P = NS) on acetate vs. glycerol study days either before (0.97 ± 0.13 vs. 0.88 ± 0.11 nM) or during the clamp (0.16 ± 0.02 vs. 0.16 ± 0.03 nM), indicating comparable suppression of endogenous insulin secretion on both study days. Glucagon concentrations (Fig. 4) were no different (P = NS) on either study day before (57.56 ± 5.09 vs. 56.35 ± 3.79 nM) or during the clamp (56.25 ± 3.20 vs. 60.71 ± 3.35 nM).
Glucose infusion rate and [3-3H]glucose-specific activity.
The glucose infusion rate (Fig. 5) required to maintain hyperglycemia (∼10 mM) during the clamp was no different in ND subjects on acetate vs. glycerol (33.39 ± 8.93 vs. 34.07 ± 5.96 μmol·kg−1·min−1; Fig. 5) study days.
Plasma [3-3H]glucose-specific activity (Fig. 5) remained constant throughout the study on both days, enabling measurement of glucose fluxes using the steady-state equation.
Plasma glucose 13C enrichments and ratio of 13C3/13C4 obtained from [1-13C]acetate and [U-13C]glycerol.
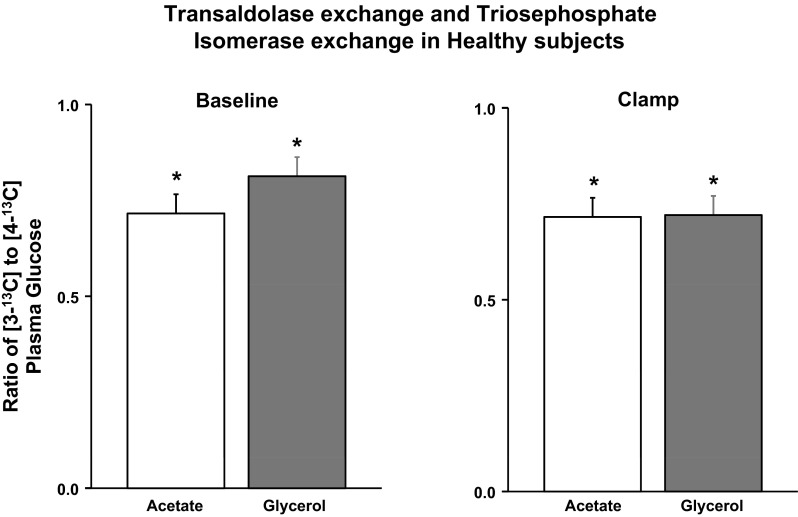
Following the infusion of [U-13C]glycerol, 13C NMR spectra of glucose observed showed 13C enrichment of glucose carbons 3 and 4 as 13C/13C spin-coupled doublets flanking central singlet carbon 3 and 4 signals, as shown in Fig. 3. The carbon 4 doublet was further split into two equal components by long-range coupling to carbon 6 (21), consistent with the [4,5,6-13C3]glucose isotopomer being the principal contributor to carbon 4 13C enrichment. This was also confirmed by inspection of the carbon 5 and 6 isotopomer signals (data not shown). The monoacetone carbon 3 resonance does not have significant coupling with carbon 1, and hence, the carbon 3 enrichment appeared as a simple doublet, representing nearest-neighbor coupling with carbon 2. Analysis of the carbon 2 multiplet showed that [1,2,3-13C3]glucose isotopomer constituted the majority (>80%) of 13C enrichment of the “upper” triose moiety of glucose and was the principal contributor to carbon 3 excess 13C enrichment. 13C3/13C4 ratios were <1.0 in all ND subjects on glycerol study visit at baseline and during clamp (Table 2 and Fig. 8). Similarly, 13C3/13C4 ratio derived from [1-13C]acetate observed was also <1.0 in all ND subjects studied (Fig. 8) and was not significantly different (P = NS) from those obtained with [U-13C]glycerol (Table 2 and Fig. 8). The concordance of [1-13C]acetate- and [U-13C]glycerol-derived 13C3/13C4 values is consistent with TA activity in the setting of nearly complete TPI exchange, as explained in Fig. 1.
Fig. 8.
Plasma [3-13C]glucose to [4-13C]glucose ratio observed at baseline (left) and during the clamp (right). *P < 0.001 vs. 1.
Rates of EGP and glucose disappearance.
Rates of endogenous glucose production in ND subjects were no different (P = NS) at baseline (17.53 ± 0.44 vs. 17.38 ± 0.40 μmol·kg−1·min−1) on either acetate or glycerol study days (as shown in Fig. 6). Similarly, suppression of EGP during clamp was no different (P = NS, 4.27 ± 1.23 vs. 3.33 ± 0.74 μmol·kg−1·min−1) on either acetate or glycerol study days (Fig. 6).
At baseline, EGP equals glucose disappearance. Rates of glucose disappearance were no different (P = NS) prior to clamp (Fig. 6). During the clamp, rates of glucose disappearance were similar on both acetate vs. glycerol study days (35.85 ± 6.22 vs. 36.58 ± 5.26 μmol·kg−1·min−1), suggesting comparable insulin-induced glucose uptake on both occasions (Fig. 6).
Rates of gluconeogenesis and GGL uncorrected and corrected for TA exchange reaction.
Uncorrected and corrected rates of gluconeogenesis in ND subjects were similar (P = NS) on acetate and glycerol study days both prior to (9.54 ± 0.46 vs. 9.82 ± 0.56 μmol·kg−1·min−1, 6.65 ± 0.43 vs. 7.85 ± 0.89 μmol·kg−1·min−1) and during the clamp (2.48 ± 0.78 vs. 1.83 ± 0.62 μmol·kg−1·min−1, 1.68 ± 0.62 vs. 1.32 ± 0.32 μmol·kg−1·min−1) (data not shown).
Uncorrected and corrected rates of glycogenolysis in ND subjects were no different (P = NS) on acetate and glycerol study days either prior to (7.99 ± 0.55 vs. 7.56 ± 0.36 μmol·kg−1·min−1, 10.88 ± 0.36 vs. 9.53 ± 0.76) or during the clamp (1.79 ± 0.46 vs. 1.50 ± 0.31 μmol·kg−1·min−1, 2.59 ± 0.71 vs. 2.01 ± 0.42 μmol·kg−1·min−1) in ND subjects (data not shown). These data indicate that there is nearly complete TPI exchange and that overestimation of gluconeogenesis is due to TA exchange alone.
DISCUSSION
The present study demonstrates that TA exchange is equal in people with and without type 2 diabetes both in the overnight-fasted state and during matched hyperglycemia and portal insulin concentrations. The deuterated water method is utilized extensively for estimation of rates of gluconeogenesis (1, 6, 11, 13, 15, 17, 26). Together with glucose tracer methodology, this is important for understanding the progression of type 2 diabetes and for evaluating the effects of various therapeutic strategies (viz., medications) intended to mitigate excessive hepatic glucose production by inhibiting gluconeogenesis. Therefore, validation of tracer-derived gluconeogenesis measurements is possible in principle, for example, by comparison with gluconeogenic fluxes obtained by subtraction of real-time glycogenolysis and EGP (18, 23, 24), a measurement that is insensitive to TA activity. However, outside of a few specialized clinical research centers, this approach is not available, and in many cases it does not provide reliable estimates of gluconeogenesis under clamp conditions. Therefore, recent studies have focused on the analysis of glucose enrichment from 13C tracers that are coadministered with 2H2O. Apart from providing a wealth of additional metabolic information for estimating gluconeogenic fluxes in various settings (12, 22, 29), these tracers also can be used to identify asymmetric enrichment of glucose from TA activity.
A relevant limitation of using [1-13C]acetate as a tracer for determining TA activity is that the observed glucose 13C3/13C4 ratio can be explained by incomplete equilibration of the 13C label into dihydroxyacetone acetone phosphate and glyceraldehyde 3-phosphate pools by TPI, as illustrated in Fig. 1. To address this, we infused [U-13C]glycerol, a tracer that enters the triose phosphate pool distally to [1-13C]acetate and would generate glucose with a higher enrichment of carbon 3 over carbon 4 if TPI exchange were incomplete, as shown in Fig. 1.
Ratio of 13C3/13C4 obtained during fasting (∼16 h) via [1-13C]acetate was ∼0.7, whereas the values obtained with [U-13C]glycerol were ∼0.8. In comparison, the enrichment differences for overnight-fasted and 24-h-fasted subjects administered with [U-13C]propionate were 0.92 and 0.79, respectively (12). Whereas current data from our [U-13C]glycerol study are in reasonable agreement with these values, the [1-13C]acetate data tend to show more variability. We are not sure whether this reflects real differences in hepatic acetate metabolism over that of glycerol and propionate systematic differences in NMR quantification of excess enrichments from 13C singlet vs. spin-coupled isotopomer signal difference due to experimental conditions or a combination of all of the above. For assessment of 13C3/13C4 from [1-13C]acetate, when the signal contribution from excess 13C enrichment is small (<10% of the natural abundance signal or <0.1% excess 13C enrichment), relatively small systematic errors in measurement of the carbon 3 and carbon 4 resonances propagate much larger errors in estimates of 13C3/13C4. For reasons not currently ascertainable, analysis of these very low enrichment samples yielded implausibly low values of 13C3/13C4. Because of this, we excluded analysis of subjects infused with [1-13C]acetate that had 13C3 or 13C4 glucose excess enrichments of <0.1%. 13C NMR isotopomer analyses are more robust in that the 13C excess enrichment information is directly obtained from the ratio of different 13C NMR signals rather than from subtraction of two signals of similar intensities. The precision of isotopomer analysis is limited only by the signal-to-noise ratio of the weaker 13C signal component of the resonance (usually the multiplet). We chose to measure the C3 and C4 multiplet signals over the others (i.e., C2 vs. C5 or C1 vs. C6) because they provide the highest signal-to-noise ratio for a given 13C enrichment level and are contributed largely by the principal [1,2,3-13C3]- and [4,5,6-13C3]glucose isotopomers formed from [U-13C]glycerol. In principle, an isotopomer analysis of 13C acetate incorporation into the two triose halves of glucose could also be determined by replacing [1-13C]acetate with [1,2-13C2]acetate.
We have demonstrated previously that the pattern of glucose 123 vs. 456 enrichment from [U-13C]glycerol is far more sensitive to incomplete TPI exchange compared with tracers that enter the triose phosphate pool as glyceraldehyde 3-phosphate, such as [1-13C]acetate and [U-13C]propionate (21). For [U-13C]glycerol, incomplete TPI exchange generates glucose with 13C3/13C4 > 1.0, i.e., opposing the effect of TA. The overall tendency for a higher 13C3/13C4 ratio from [U-13C]glycerol compared with [1-13C]acetate is consistent with TPI exchange that approaches 100% completion.
As described recently, the effects of TA on measurements of gluconeogenesis by the 2H2O method can be corrected by analyzing 13C3/13C4 from coadministration of a 13C tracer (3, 12, 21). Since equilibration of the 13C label between glyceraldehyde 3-phosphate and dihydroxyacetone phosphate (DHAP) via TPI is essentially complete, the 13C tracer can be a DHAP precursor (i.e., [13C]glycerol or dihydroxyacetone) or a glyceraldehyde 3-phosphate precursor (13C-propionate, acetate, or bicarbonate), although glucose enrichment from the latter group is less sensitive to incomplete TPI exchange (21).
Consistent with our previous observation in healthy humans and in prediabetes (3, 4), we have now observed that a comparable fraction of the hepatic G6P pool also undergoes TA exchange in people with type 2 diabetes. TA exchange explains the labeling asymmetry of plasma glucose from gluconeogenic carbon tracers and contributes to the enrichment of glucose position 5 from 2H2O. The fraction of hepatic G6P that undergoes TA exchange is relatively constant and does not differ with varying degrees of insulin sensitivity, ranging from healthy subjects to highly insulin-resistant patients with established type 2 diabetes, nor with varying doses of insulin (3, 4, 7, 9). Since the effect of TA exchange on the source of EGP depends on the contribution of glycogenolysis to EGP, its effects are proportionally highest under conditions of abnormally high hepatic G6P production from glycogenolysis. For example, if glycogenolysis contributed 75% of EGP and gluconeogenesis 25%, the presence of a modest level of TA exchange activity (20% exchange of hepatic G6P) would result in apparent glycogenolytic and gluconeogenic contributions of 60 and 40%, respectively. In other words, the uncorrected gluconeogenic flux would be 1.6 times higher than the corrected value.
In summary, the present data indicate that infusion of [1-13C]acetate results in comparable estimates of TA exchange in healthy subjects and in people with type 2 diabetes both in the overnight-fasted state and during acute hyperglycemia with moderate-dose insulin infusion. We also have demonstrated that asymmetric enrichment of glucose from [U-13C]glycerol is also consistent with TA activity and nearly complete TPI exchange. Together with our current and previous observations and those of others, these data provide strong evidence that TA exchange results in a significant fraction of glycogenolytic G6P (15–35%) becoming enriched in position 5 from 2H2O, resulting in a modest overestimation of fractional gluconeogenesis and underestimation of glycogenolytic contribution to EGP. However, this exchange activity is equivalent for healthy, prediabetic, and T2DM subjects and therefore does not explain differences in gluconeogenic and glycogenolytic fluxes between these subject groups. However, it may contribute to the variability in these flux estimates within each subject group. Thus, the 2H2O method continues to provide reliable estimates for quantifying gluconeogenesis and glycogenolysis in various physiological and pathophysiological states.
GRANTS
This study was supported by the US Public Health Service (DK-29953, DK-50456, and UL1-TR000135) and the Mayo Clinic and Fundaçãopara a Ciência e a Tecnologia (FCT; PTDC/SAU-MET/11198/2009, RECI/QEQ-QFI/0168/2012). The NMR spectrometers are part of the National NMR Network and were purchased in the framework of the Portuguese National Programme for Scientific Re-equipment, contract REDE/1517/RMN/2005, with funds from POCI 2010 and FCT.
DISCLOSURES
Dr. Rita Basu is the guarantor of this work, had full access to all the data, and takes full responsibility for the integrity of data and the accuracy of data analysis. There are no conflicts of interest, financial or otherwise, to declare for any of the authors.
AUTHOR CONTRIBUTIONS
A.R., S.D., A.B., and R.B. performed the experiments; A.R., S.D., F.C., A.R.S., A.F., J.G.J., and R.B. analyzed the data; A.R., S.D., A.B., J.G.J., and R.B. edited and revised the manuscript; A.R., S.D., A.B., J.G.J., and R.B. approved the final version of the manuscript; S.D., A.B., J.G.J., and R.B. interpreted the results of the experiments; S.D., J.G.J., and R.B. prepared the figures; S.D., J.G.J., and R.B. drafted the manuscript; A.B., J.G.J., and R.B. contributed to the conception and design of the research.
ACKNOWLEDGMENTS
We are grateful to Dr. R. A. Rizza for insight and suggestions and we miss Dr. Bernie Landau's wisdom. We thank B. Dicke (Mayo Clinic), P. Reich (Mayo Clinic), B. Norby (Mayo Clinic), and Cheryl Shonkwiler (Mayo Clinic) for technical assistance, B. McConahey (Mayo Clinic) for technical assistance and graphics, Carrie Speltz (medical secretary, Mayo Clinic) for assistance with preparation of the manuscript, and the staff of the Mayo Clinical Research Unit and Center for Clinical and Translation Science Activities for assistance with the studies. We are grateful to our research volunteers for participating in these studies.
REFERENCES
- 1. Adkins A, Basu R, Persson M, Dicke B, Shah P, Vella A, Schwenk WF, Rizza R. Higher insulin concentrations are required to suppress gluconeogenesis than glycogenolysis in nondiabetic humans. Diabetes 52: 2213–2220, 2003 [DOI] [PubMed] [Google Scholar]
- 2. Basu A, Basu R, Shah P, Vella A, Johnson CM, Jensen M, Nair KS, Schwenk F, Rizza RA. Type 2 diabetes impairs sphlanchnic uptake of glucose but does not alter intestinal glucose absorption during enteral glucose feeding: additional evidence for a defect in hepatic glucokinase activity. Diabetes 50: 1351–1362, 2001 [DOI] [PubMed] [Google Scholar]
- 3. Basu R, Barosa C, Basu A, Pattan V, Saad A, Jones J, Rizza R. Transaldolase exchange and its effects on measurements of gluconeogenesis in humans. Am J Physiol Endocrinol Metab 300: E296–E303, 2011 [DOI] [PMC free article] [PubMed] [Google Scholar]
- 4. Basu R, Barosa C, Jones J, Dube S, Carter R, Basu A, Rizza RA. Pathogenesis of prediabetes: role of the liver in isolated fasting hyperglycemia and combined fasting and postprandial hyperglycemia. J Clin Endocrinol Metab 98: E409–E417, 2013 [DOI] [PMC free article] [PubMed] [Google Scholar]
- 5. Basu R, Basu A, Johnson CM, Schwenk WF, Rizza RA. Insulin dose-response curves for stimulation of splanchnic glucose uptake and suppression of endogenous glucose production differ in nondiabetic humans and are abnormal in people with type 2 diabetes. Diabetes 53: 2042–2050, 2004 [DOI] [PubMed] [Google Scholar]
- 6. Basu R, Chandramouli V, Dicke B, Landau B, Rizza R. Obesity and type 2 diabetes impair insulin-induced suppression of glycogenolysis as well as gluconeogenesis. Diabetes 54: 1942–1948, 2005 [DOI] [PubMed] [Google Scholar]
- 7. Basu R, Chandramouli V, Schumann W, Basu A, Landau BR, Rizza RA. Additional evidence that transaldolase exchange, isotope discrimination during the triose-isomerase reaction, or both occur in humans: effects of type 2 diabetes. Diabetes 58: 1539–1543, 2009 [DOI] [PMC free article] [PubMed] [Google Scholar]
- 8. Basu R, Schwenk WF, Rizza RA. Both fasting glucose production and disappearance are abnormal in people with “mild” and “severe” type 2 diabetes. Am J Physiol Endocrinol Metab 287: E55–E62, 2004 [DOI] [PubMed] [Google Scholar]
- 9. Bock G, Schumann WC, Basu R, Burgess SC, Yan Z, Chandramouli V, Rizza RA, Landau BR. Evidence that processes other than gluconeogenesis may influence the ratio of deuterium on the fifth and third carbons of glucose: implications for the use of 2H2O to measure gluconeogenesis in humans. Diabetes 57: 50–55, 2008 [DOI] [PubMed] [Google Scholar]
- 10. Boden G, Chen X, Capulong E, Mozzoli M. Effects of free fatty acids on gluconeogenesis and autoregulation of glucose production in type 2 diabetes. Diabetes 50: 810–816, 2001 [DOI] [PubMed] [Google Scholar]
- 11. Boden G, Chen X, Stein TP. Gluconeogenesis in moderately and severely hyperglycemic patients with type 2 diabetes mellitus. Am J Physiol Endocrinol Metab 280: E23–E30, 2001 [DOI] [PubMed] [Google Scholar]
- 12. Browning JD, Burgess SC. Use of 2H2O for estimating rates of gluconeogenesis: determination and correction of error due to transaldolase exchange. Am J Physiol Endocrinol Metab 303: E1304–E1312, 2012 [DOI] [PMC free article] [PubMed] [Google Scholar]
- 13. Chen X, Iqbal N, Boden G. The effects of free fatty acids on gluconeogenesis and glycogenolysis in normal subjects. J Clin Invest 103: 365–372, 1999 [DOI] [PMC free article] [PubMed] [Google Scholar]
- 14. Diraison F, Large V, Brunengraber H, Beylot M. Gluconeogenesis is not increased in mildly hyperglycemic non-insulin-dependent diabetic patients (Abstract). Diabetologia 40: 955, 1997 [Google Scholar]
- 15. Gastaldelli A, Baldi S, Pettiti M, Toschi E, Camastra S, Natali A, Landau BR, Ferrannini E. Influence of obesity and type 2 diabetes on gluconeogenesis and glucose output in humans: a quantitative study. Diabetes 49: 1367–1373, 2000 [DOI] [PubMed] [Google Scholar]
- 16. Gastaldelli A, Miyazaki Y, Pettiti M, Buzzigoli E, Mahankali S, Ferrannini E, DeFronzo RA. Separate contribution of diabetes, total fat mass, and fat topography to glucose production, gluconeogenesis, and glycogenolysis. J Clin Endocrinol Metab 89: 3914–3921, 2004 [DOI] [PubMed] [Google Scholar]
- 17. Gastaldelli A, Toschi E, Pettiti M, Frascerra S, Quiñones-Galvan A, Sironi AM, Natali A, Ferrannini E. Effect of physiological hyperinsulinemia on gluconeogenesis in nondiabetic subjects and in type 2 diabetic patients. Diabetes 50: 1807–1812, 2001 [DOI] [PubMed] [Google Scholar]
- 18. Hundal RS, Krssak M, Dufour S, Laurent D, Lebon V, Chandramouli V, Inzucchi SE, Schumann WC, Petersen KF, Landau BR, Shulman GI. Mechanism by which metformin reduces glucose production in type 2 diabetes. Diabetes 49: 2063–2069, 2000 [DOI] [PMC free article] [PubMed] [Google Scholar]
- 19. Jones JG, Barosa C, Gomes F, Mendes AC, Delgado TC, Diogo L, Darcia P, Bastos M, Barros L, Fagulha A, Baptista C, Carvalheiro M, Caldeira MM. NMR derivatives for quantification of 2H and 13C-enrichment of human glucuronide from metabolic tracers. J Carb Chem 25: 203–217, 2006 [Google Scholar]
- 20. Jones JG, Fagulha A, Barosa C, Bastos M, Baptista C, Caldeira MM, Carvalheiro M. Noninasive analysis of hepatic glycogen kinetics before and after brakfast with deuterated water and acetaminophen. Diabetes 55: 2294–2300, 2006 [DOI] [PubMed] [Google Scholar]
- 21. Jones JG, Garcia P, Barosa C, Delgado TC, Caldeira MM, Diogo L. Quantification of hepatic transaldolase exchange activity and its effects on tracer measurements of indirect pathway flux in humans. Magn Reson Med 59: 423–429, 2008 [DOI] [PubMed] [Google Scholar]
- 22. Jones JG, Solomon MA, Cole SM, Sherry AD, Malloy CR. An integrated 2H and 13C NMR study of gluconeogenesis and TCA cycle flux in humans. Am J Physiol Endocrinol Metab 281: E848–E856, 2001 [DOI] [PubMed] [Google Scholar]
- 23. Kacerovsky M, Jones J, Schmid AI, Barosa C, Lettner A, Kacerovsky-Bielesz G, Szendroedi J, Chmelik M, Nowotny P, Chandramouli V, Wolzt M, Roden M. Postprandial and fasting hepatic glucose fluxes in long-standing type 1 diabetes. Diabetes 60: 1752–1758, 2011 [DOI] [PMC free article] [PubMed] [Google Scholar]
- 24. Kunert O, Stingl H, Rosian E, Krssák M, Bernroider E, Seebacher W, Zangger K, Staehr P, Chandramouli V, Landau BR, Nowotny P, Waldhäusl W, Haslinger E, Roden M. Measurement of fractional whole-body gluconeogenesis in humans from blood samples using 2H nuclear magnetic resonance spectroscopy. Diabetes 52: 2475–2482, 2003 [DOI] [PubMed] [Google Scholar]
- 25. Magnusson I, Schumann WC, Bartsch GE, Chandramouli V, Kumaran K, Wahren J, Landau BR. Noninvasive tracing of Krebs cycle metabolism in liver. J Biol Chem 266: 6975–6984, 1991 [PubMed] [Google Scholar]
- 26. Roden M, Stingl H, Chandramouli V, Schumann WC, Hofer A, Landau BR, Nowotny P, Waldhäusl W, Shulman GI. Effects of free fatty acid elevation on postabsorptive endogenous glucose production and gluconeogenesis in humans. Diabetes 49: 701–707, 2000 [DOI] [PubMed] [Google Scholar]
- 27. Steele R, Wall J, DeBodo R, Altszuler N. Measurement of size and turnover rate of body glucose pool by the isotope dilution method. Am J Physiol 187: 15–24, 1956 [DOI] [PubMed] [Google Scholar]
- 28. Wajngot A, Chandramouli V, Schumann WC, Ekberg K, Jones PK, Efendic S, Landau BR. Quantitative contributions of gluconeogenesis to glucose production during fasting in type 2 diabetes mellitus. Metabolism 50: 47–52, 2001 [DOI] [PubMed] [Google Scholar]
- 29. Weis BC, Margolis D, Burgess SC, Merritt ME, Wise H, Sherry AD, Malloy CR. Glucose production pathways by 2H and 13C NMR in patients with HIV-associated lipoatrophy. Magn Reson Med 51: 649–654, 2004 [DOI] [PubMed] [Google Scholar]


