

Abstract
In the distal nephron, the large-conductance Ca-activated K (BK) channel, comprised of a pore-forming-α (BK-α) and the BK-β4 subunit, promotes K excretion when mice are maintained on a high-K alkaline diet (HK-alk). We examined whether BK-β4 and the acid-base status regulate apical membrane expression of BK-α in the cortical (CCD) and medullary collecting ducts (MCD) using immunohistochemical analysis (IHC) and Western blot. With the use of IHC, BK-α of mice on acontrol diet localized mostly cytoplasmically in intercalated cells (IC) of the CCD and in the perinuclear region of both principle cells (PC) and IC of the MCD. HK-alk wild-type mice (WT), but not BK-β4 knockout mice (β4KO), exhibited increased apical BK-α in both the CCD and MCD. When given a high-K acidic diet (HK-Cl), BK-α expression increased but remained cytoplasmic in the CCD and perinuclear in the MCD of both WT and β4KO. Western blot confirmed that total BK-α expression was enhanced by either HK-alk or HK-Cl but only increased in the plasma membrane with HK-alk. Compared with controls, mice drinking NaHCO3 water exhibited more apical BK-α and total cellular BK-β4. Spironolactone given to mice on HK-alk significantly reduced K secretion and decreased total cellular BK-α but did not affect cellular BK-β4 and apical BK-α. Experiments with MDCK-C11 cells indicated that BK-β4 stabilizes surface BK-α by inhibiting degradation through a lysosomal pathway. These data suggest that aldosterone mediates a high-K-induced increase in BK-α and urinary alkalinization increases BK-β4 expression, which promotes the apical localization of BK-α.
Keywords: maxi K, apical membrane, intercalated cells, acid/base, potassium secretion
the large-conductance ca-activated K channel (BK) mediates K secretion during high distal nephron fluid flow that is stimulated by high-K diets (17, 22, 31, 42). Two BK channels, the pore-forming BK-α with the BK-β1 (BK-α/β1), and the BK-α with the BK-β4 (BK-α/β4) are involved in this process. The BK-α/β1 mediates K secretion in connecting tubule (CNT) cells (10, 32). The absence of the BK-β1 subunit results in hyperaldosteronism, hyperkalemia, fluid accumulation, and hypertension, effects that are exaggerated when animals consume a high-K diet (12). The BK-α/β4 appears more abundant and resides in the intercalated cells (IC) of the CNT and collecting ducts (10).
Evidence suggests a variety of roles for BK-α/β4 in IC. K-adapted mice generate high distal nephron fluid flows of four- to fivefold more than control diet mice (6). High flow-induced shear stress activates BK-α/β4, thereby reducing intracellular K content and the size of IC. The reduced IC size increases the functional luminal diameters of the CNT and cortical collecting duct (CCD; Ref. 16). More recent evidence suggests that BK-α/β4 mediates transepithelial K secretion, with the luminal exit of K serving as a counter-cation to the negatively charged ATP that is secreted during high tubule fluid flow (15, 16). However, high flow is not the only stimulator of K secretion via BK-α/β4 in mice. WT handle high-K alkaline diets (HK-alk) with only a slight increase in plasma K concentration. WT on a high-K chloride diet (HK-Cl), which is acidic, still generate high distal tubule fluid flow; however, the plasma K concentration increases and K clearance is lower than that of WT on HK-alk.
We showed previously that expression of BK-α, demonstrated by Western blot of whole kidney and intensity of immunohistochemical staining (IHC), was increased by a high-K diet and decreased with a low-K diet (17). Najjar et al. (26) showed that BK-α was located predominantly in IC of rabbit CCD and that a high-K diet resulted in its enhanced expression in the apical membrane. The acid/base content of the diet was not stated; however, rabbit diets are normally alkaline to mimic the normal vegetarian diet of rabbits. Although the mRNA of BK-β4 increased with a high-K diet, the role of BK-β4 in the apical expression of BK-α was not determined. Moreover, it was not determined whether the increased dietary K or the increased urinary alkalinization enhanced the apical expression of BK-α.
For this study, we used an antibody previously shown to be specific by its failure to detect BK-α in mice with a genetic deletion of the slo1 gene, which encodes the BK-α protein (24). We found that BK-α was localized predominantly in IC of the CCD and in both IC and principal cells (PC) of the MCD. Patch-clamp analysis has also identified BK predominantly in IC of rat collecting ducts (27). HK-alk, but not HK-Cl, enhances BK-β4 expression in the renal cortex (6). Thus BK-β4 is a key component in the ability of mice to handle successfully a high-K alkaline load.
For several types of Ca channels, an ancillary subunit is necessary for proper folding and expression in the apical membrane (8, 35). We performed these studies to determine whether BK-β4 was instrumental in expression of BK-α in the apical membrane of the distal nephron cells and whether the apical expression is associated with a high-K diet or the acid/base status of the mice. The results show that BK-β4 is necessary for expression of BK-α in the apical membrane of CCD and MCD. Although high-K consumption increases the total cellular amount of BK-α expression in an aldosterone-dependent manner, the urinary alkalinization increases the apical BK-α expression as well as the total cellular BK-β4 expression.
METHODS
Animal studies.
Wild-type (WT; C57Bl/6; Charles River, Wilmington, MA) and BK-β4KO mice (generously provided by R. Brenner) were maintained in accordance with the Institutional Animal Care and Use Committee of the University of Nebraska Medical Center. For all experiments, mice (12- to 20-wk-old) had full access to water and were fed either regular mouse chow (control; 0.6% K, 0.32% Na) or a special diet (Harlan Teklad, Madison, WI) for 7–10 days before death. Special diets were as follows: High K with alkaline anions (no. TD.07278; HK-alk; 5.0% K with 5% of equal carbonate/citrate/Cl and 0.32% Na) or high K with Cl as the counter anion (no. TD.09075; HK-Cl; 5.0% K with 5.0% Cl, 0.32% Na). Some WT mice on a control diet were given NaCl, NH4Cl, or NaHCO3 (all 280 mM in water) for 7 days. Urine was collected in metabolic cages (Nalgene), as previously described (16). Some WT mice were given spironolactone (40 mg·kg−1·day−1) or vehicle (poly-ethylene glycol) by oral gavage each day with the diet. After treatment, we collected fresh urine samples for analysis of Na and K with a flame photometer (Jenway Clinical PFP7; Stone, Staffordshire, UK) as previously described (12) and for pH and osmolality measurements using a Model 215 pH meter (Denver Instruments; Bohemia, NY) and Model 3250 osmometer (Advanced Instruments; Norwood, MA), respectively. At death, we extracted blood from the carotid artery and centrifuged for measurement of plasma K, Na, and osmolality and harvested kidneys for IHC and Western blot. Transtubular K gradient (TTKG) was calculated as: urine [K] × plasma osmolality/plasma [K] × urine osmolality, with brackets indicating concentration.
Cell culture.
MDCK-C11 cells (C11; passages 64–70, were a generous gift of Dr. Hans Oberleithner of Münster University). All cells were grown in high glucose DMEM (Invitrogen, Carlsbad, CA) supplemented with 10% FBS, 1.0 mM sodium pyruvate, 0.1 mM nonessential amino acids, 100 μg/ml penicillin, 100 μg/ml streptomycin, and 25 μg/ml gentamicin under standard incubation conditions of 37°C, 95% humidity-5% CO2.
RNA interference.
Knockdown of the BK-β4 subunit in C11 was achieved as previously described (15). Forty-eight hours after small interfering (si)RNA transfection, cells were treated with either 50 μM leupeptin or 500 nM bafilomycin A1 (Sigma, St. Louis, MO) for 24 h before collection for Western blot.
Plasma membrane protein isolation.
The plasma membrane fraction was isolated using Minute Plasma Membrane Protein Isolation Kit (Invent Biotechnologies, Eden Prairie, MN) according to the manufacturer's instruction. All steps were performed at 4°C. Briefly, cultured cells or kidney tissues were lysed in buffer A and placed in a filter cartridge. After centrifugation at 14,000 rpm for 30 s, pellets were resuspended and centrifuged at 3,000 rpm for 1 min. The supernatant was collected and centrifuged again at 14,000 rpm for 10 min. The supernatant was then collected as cytosol protein fraction and the pellet as total membrane fraction, which was resuspended in buffer B and centrifuged at 10,000 rpm for 5 min. The resultant pellet was collected separately as organelle membrane protein for further Western blot. The supernatant was then centrifuged again at 14,000 rpm for 15 min, and the pellet was collected as plasma membrane (PM) protein fraction for further experiments.
Western blotting.
Western blotting was performed as described previously (15, 16) following manufacturer's protocol (Bio-Rad Laboratories, Hercules, CA). Primary antibodies included anti-BK-α (mouse monoclonal, diluted 1:200; Neuromab), anti-BK-β4 (rabbit polyclonal, diluted 1:500; Alomone Laboratories), anti-cadherin (goat polyclonal, diluted 1:500; Santa Cruz Biotechnology), anti-GAPDH (goat polyclonal, diluted 1:500, Santa Cruz Biotechnology), and anti-β-actin (mouse monoclonal, diluted 1:500; Santa Cruz Biotechnology) with goat anti-rabbit IgG, donkey anti-mouse IgG, or donkey anti-goat IgG-conjugated horseradish peroxidase (diluted 1:10,000–1:20,000; Santa Cruz Biotechnology). Expression of primary antibodies was quantified by densitometry using Quantity One (Bio-Rad).
Immunohistochemical staining and quantification.
For fluorescent IHC of kidney sections, the kidneys were harvested, immediately fixed in Histochoice MB (Electron Microscopy Sciences, Hatfield, PA), embedded in paraffin, and sectioned onto slides as previously performed in our laboratory (11). Antibodies were used as follows: anti-sodium glucose transporter 1; anti-Tamm-Horsfall protein (THP); anti-NaCl cotransporter (NCC), anti-V-ATPase, anti-aquaporin 2 (AQP2; all goat polyclonal, diluted 1:100; Santa Cruz Biotechnology), and anti-BK-α (mouse monoclonal, diluted 1:200; Neuromab). After washing the tissue, we incubated it for 1 h (23°C) in the dark with the secondary antibody (donkey anti-mouse IgG-conjugated Alexa Fluor 488 and donkey anti-goat IgG-conjugated Alexa Fluor 594, diluted 1:200). Hoechst was used to stain nuclei. The coverslips were mounted onto slides overnight with Prolong Gold (Invitrogen), sealed with nail polish. These were viewed on a Leica HC fluorescence microscope with a ×40/0.75NAHCXPL Fluotar objective. Images were captured with a QImaging Retiga EXi CCD camera (Surrey, British Columbia, Canada) and analyzed with ImageJ software (version 1.42; National Institutes of Health, Bethesda, MD). Quantification of BK-α signal intensity was determined following online instructions in single-channel, gray scale images after background correction as performed previously (16, 28). Briefly, images were imported into ImageJ. The tubules and apical membranes positive for BK-α staining were outlined, and the occupied pixel intensity was measured. The arbitrary unit = pixel intensity/10,000. At least three kidney sections were imaged for each condition from different animals, and we examined a minimum of three separate immunofluorescence stainings for each tissue.
Statistics.
Data shown in Figs. 1–11 represent means ± SE. Significant differences between each group were determined by ANOVA plus Student-Newman-Keuls or Tukey test (P < 0.05 considered significant), unless otherwise denoted. We performed data management and statistical analyses using Excel (Microsoft, Redmond, WA) and SigmaPlot (version 11, Systat Software).
Fig. 1.
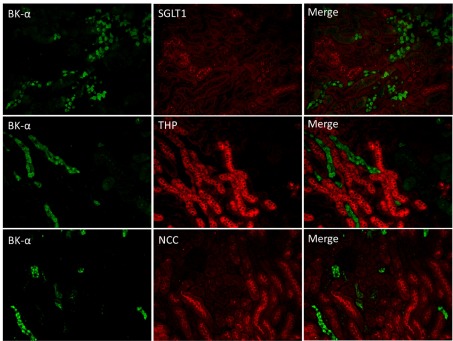
Localization of large-conductance Ca-activated K channel (BK) pore-forming-α subunit (BK-α) in renal sections of mice on control diet using double label immunohistochemistry (IHC). Top: anti-BK-α (green) costained with anti-sodium glucose transporter 1 (SGLT1; marker for proximal tubule). Middle: anti-BK-α costained with anti-Tamm-Horsfall protein (THP; marker for thick ascending limb). Bottom: anti-BK-α costained with anti-sodium chloride cotransporter (NCC; marker for distal tubule). No colabeling was found between BK-α and any of these 3 markers (magnification: ×10).
RESULTS
Renal expression pattern of BK-α in WT on a normal diet.
The anti-BK-α antibody was used in conjunction with antibody markers to determine the renal segmental location of BK-α. As shown by the representative stainings of Fig. 1, double IHC of anti-BK-α with either anti-SGLT1, which marks the proximal tubule (40); anit-THP, a marker for the thick ascending limb of the loop of Henle (3, 23); and anti-NCC, a marker of the early distal convoluted tubule (30, 32), revealed no costaining. We conclude that the Neuromab antibody used in the present study does not detect BK-α in the proximal tubule, thick ascending limb of Henle and the early distal tubule.
Figure 2 illustrates, with double IHC, the localization of BK-α in collecting duct PC and IC of sections of renal cortex (A and B) and medulla (C and D) of mice on a normal diet. Anti-AQP2 is a marker of PC, and anti-V-ATPase is a marker of IC of collecting ducts. The blue Hoechst staining identifies the nucleus. Anti-BK-α costains in CCD minimally with anti-AQP2 (Fig. 2A) and abundantly with anti-V-ATPase (Fig. 2B); however, BK-α is predominantly cytoplasmic in IC. As shown for the MCD, BK-α localizes with both anti-AQP2 (Fig. 2C) and anti-V-ATPase (Fig. 2D); however, BK-α is predominantly perinuclear. We conclude that for mice on a control diet, BK-α expresses mostly cytoplasmically in the IC of the CCD; however, BK-α expression appears perinuclear in both PC and IC of the MCD.
Fig. 2.

IHC localization of BK-α in principal cells (PC) and intercalated cells (IC) of cortical collecting ducts (CCD; A and B) and medullary collecting ducts (MCD; C and D) from mice on a control diet. A: cortical anti-BK-α costaining with anti-aquaporin 2 (AQP2), a marker of PC. B: cortical anti-BK-α costaining with anti-V-ATPase, a marker for IC. C: medullary anti-BK-α costaining with anti-AQP2. D: medullary anti-BK-α costaining with anti-V-ATPase. Hoechst stains nuclei of all cells (magnification: ×40).
Effects of high-K diets and BK-β4 on BK-α expression.
Table 1 shows the laboratory values (means ± SE) for urine volume, hematocrit, urinary pH, urinary K and Na concentrations, and plasma K and Na concentrations for the groups mice (WT-control, β4KO-control, WT-HK-alk, β4KO-HK-alk, WT-HK-Cl, and β4KO-HKCl) used in this study. As shown previously (6), the plasma [K] was elevated and the urinary [K] was decreased in β4KO, compared with WT, on HK-alk. The urine was alkaline in the mice on HK-alk and was acidic in the mice on HK-Cl. There was no difference in urine pH between genotypes.
Table 1.
Flow, hematocrit, urinary values for K, Na, osmolality, and pH and plasma values for K, Na, and osmolality for WT and β4KO on control, HK-alk, and HK-Cl diets
| V, ml/day | n | U[K], mM | n | U[Na], mM | n | Uosm, mosmol/kgH2O | n | UpH | n | P[K], mM | n | P[Na], mM | n | Posm, mosmol/kgH2O | n | Hct, % | n | |
|---|---|---|---|---|---|---|---|---|---|---|---|---|---|---|---|---|---|---|
| WT-control | 1.17 | 18 | 291.4 | 18 | 179.9 | 18 | 2,137 | 17 | 6.2 | 6 | 4.41 | 15 | 147.6 | 9 | 316.4 | 11 | 45.6 | 14 |
| ±SE | 0.1 | 27.1 | 12.5 | 168 | 0.1 | 0.15 | 2.4 | 3.3 | 0.4 | |||||||||
| β4KO-control | 0.96 | 8 | 227.8 | 8 | 123.1 | 8 | 2,281 | 10 | 6 | 7 | 4.25 | 10 | 148.5 | 10 | 320.3 | 7 | 45.9 | 10 |
| ±SE | 0.11 | 40.3 | 15.1 | 396 | 0.7 | 0.12 | 2 | 5 | 0.8 | |||||||||
| WT-HK | 6.07 | 29 | 533.1 | 29 | 60.8 | 29 | 1,406 | 29 | 8.7 | 11 | 4.83 | 21 | 147.3 | 18 | 316.2 | 15 | 43.4 | 25 |
| ±SE | 0.36 | 19.6 | 4.5 | 52 | 0.2 | 0.08 | 1.1 | 4.6 | 0.4 | |||||||||
| β4KO-HK | 6.4 | 15 | 390.6 | 15 | 39.9 | 13 | 1,247 | 11 | 8.7 | 8 | 5.37 | 12 | 144.7 | 7 | 316.6 | 10 | 40.3 | 10 |
| ± E | 0.46 | 19.3 | 4 | 47 | 0.2 | 0.17 | 2.1 | 0.9 | 0.6 | |||||||||
| WT-HK-Cl | 5.46 | 12 | 523.9 | 14 | 62.8 | 10 | 1,600 | 14 | 5.8 | 13 | 6.58 | 10 | 144.2 | 14 | 300 | 14 | 44.9 | 12 |
| ±SE | 0.39 | 18.1 | 3.3 | 75 | 0.1 | 0.34 | 1.7 | 4.1 | 1 | |||||||||
| β4KO-HK-Cl | 4.42 | 9 | 487.5 | 9 | 78.2 | 9 | 1,485 | 9 | 5.8 | 9 | 6.38 | 9 | 154.7 | 9 | 288.9 | 9 | 40 | 5 |
| ±SE | 0.52 | 52.1 | 5.1 | 144 | 0.1 | 0.47 | 3.2 | 6.5 | 0.9 |
Values are means ± SE.
V, flow; Hct, hematocrit, U, urinary values; P, plasma values; osm, osmolality; pH, pH values; WT, wild type; KO knockout; HK, alkaline high-K diet (HK); HK-Cl, acidic high-K diet.
Brackets indicate concentrations. Not all values were obtained in a single mouse, yielding a difference in “n” within a group.
IHC was used to determine the cellular expression and localization of BK-α in the CCD and MCD of WT and β4KO mice on normal, HK-alk and HK-Cl diets. As shown by the representative stainings of CCD in Fig. 3A, BK-α predominantly expresses in the cytoplasm of IC of mice on a control and HK-Cl diet; however, BK-α localizes in the apical membrane of IC when WT, but not β4KO, are on HK-alk. As shown by the summary bar plots of Fig. 3, B-D, the apical intensity of BK-α (Fig. 3B) was significantly enhanced in both WT and β4KO on HK-alk and HK-Cl, compared with control diet; however, the intensity of apical BK-α staining was significantly greater in WT, compared with β4KO, when mice were on HK-alk. The total cellular staining (Fig. 3C) of BK-α was significantly increased in CCD of both WT and β4KO on HK-alk and HK-Cl diets, compared with control diets. As shown in Fig. 3D, the proportion of apical to cytoplasmic staining of WT, but not β4KO, on HK-alk was significantly increased compared with control and HK-Cl diets.
Fig. 3.

IHC analysis of CCD for BK-α in wild-type (WT) and knockout (β4KO) on control, high-K alkaline (HK-alk) and high-K chloride (HK-Cl). A: representative stainings revealing localization of BK-α in the CCD of WT and BKβ4-KO on control, HK-alk, and HK-Cl diets (magnification: ×40). Outlines at top middle were shown as an example of how fluorescence intensity was measured. Areas occupied by the red line and yellow line represent apical and total BK-α staining, respectively. Summary bar plots of quantitated fluorescence for apical (B), total (C), and proportion of apical/total (D) BK-α expression levels in the CCD. Values are means ± SE. AU, arbitrary units. *P < 0.01 vs. WT; #P < 0.01 vs. control;  P < 0.01 vs. HK-alk; n ≥ 9 in each group.
Representative stainings of anti-BK-α on MCDs are shown in Fig. 4. As shown by the representative stainings of Fig. 4A, only WT on HK-alk exhibited BK-α in MCD apical membrane. The summary bar plots of Fig. 4B show that the intensity of apical BK-α in WT, but not β4KO, is significantly increased when mice are on the HK-alk diet. Figure 4C reveals that the total cellular expression of BK-α increased significantly in MCD of both WT and β4KO on HK-alk or HK-Cl; however, the staining intensity of BK-α from β4KO increased by a significantly greater amount. Figure 4D shows that WT, but not β4KO, on HK-alk exhibited a significant increase in the proportion of apical to total staining in the MCD, compared with mice on control and HK-Cl diets.
Fig. 4.

IHC analysis of MCD for BK-α in WT and β4KO on control, HK-alk and HK-Cl. Representative stainings revealing localization of BK-α in the MCD of WT and BKβ4-KO on control, HK-alk, and HK-Cl diets (A; magnification: ×40) and summary bar plots of quantitated fluorescence for apical (B), total (C), and apical/total (D) BK-α expression levels in the MCD. Symbols are same as in Fig. 3.
Western blot of whole kidney was performed to examine the total renal cellular and PM BK-α expression of mice on HK-alk vs. HK-Cl and corroborate the IHC results. The antibody revealed in Figs. 1 and 2 that significant BK-α expression was only in the distal nephron CNT and CCD cells. As shown by the representative Western blots of Fig. 5A and the summary bar plots of Fig. 5B, the total renal BK-α expression of WT increased significantly from 0.203 ± 0.035 on a control diet to 0.431 ± 0.066 on HK-alk and to 0.426 ± 0.049 on HK-Cl. The total renal BK-α expression of β4KO increased significantly from 0.224 ± 0.035 on a control diet to 0.576 ± 0.128 on HK-alk and to 0.516 ± 0.088 on HK-Cl.
Fig. 5.

Western blot analysis of total cellular expression of BK-α in WT and β4KO on control, HK-alk, and HK-Cl diets. Representative immunoblots (A) and summary bar plots (B) of quantitated densitometry for total cellular BK-α expression in WT and β4-KO on control, HK-alk and HK-Cl diets. β-actin was used as loading control for total cell lysate proteins. Values are means ± SE. *P < 0.05 vs. WT, #P < 0.01 vs. control; n = 4 in each group.
The representative blots of Fig. 6A and the summary bar plots of Fig. 6B validate the enrichment of the isolated PM protein fraction (marked by cadherin), compared with the whole cell fraction (marked by GAPDH). As shown, the cadherin/GAPDH is enriched in the plasma membrane fraction by approximately sevenfold, compared with the cytosolic fraction, and by approximately threefold, compared with the organelle membrane fraction. As shown by the representative blots of Fig. 6C and the summary bar plots of Fig. 6D, the PM BK-α expression increased significantly in WT from 0.898 ± 0.134 on a control diet to 1.377 ± 0.134 on HK-alk; however, BK-α expression was not increased in HK-Cl (0.916 ± 0.149). BK-α of the PM increased slightly but significantly in β4KO from 0.664 ± 0.085 on a control diet to 0.872 ± 0.066 on HK-alk but was not changed on HK-Cl (0.751 ± 0.094). However, β4KO fed HK-alk exhibited significantly reduced PM BK-α expression, compared with WT, suggesting that BK-β4 is responsible for increased apical BK-α expression in high-K alkaline conditions.
Fig. 6.

Western blot analysis of plasma membrane (PM) expression of BK-α in WT and β4KO on control, HK-alk, and HK-Cl diets. Representative immunoblots (A) and summary bar plots (B) of the relative densitometry level of cadherin in the isolated plasma membrane fraction (PM), cytosolic fraction (C), and organelle membrane fraction (OM). Values are means ± SE *P < 0.01 vs. C; #P < 0.01 vs. OM; n = 3 in each group. Representative immunoblots (C) and summary bar plots (D) of BK-α expression in PM by densitometry in WT and β4-KO on control, HK-alk and HK-Cl diets. Cadherin was used as loading control for PM proteins. Values are means ± SE. *P < 0.01 vs. WT; #P < 0.01 vs. control; P < 0.01 vs. HK-alk; n = 4 in each group.
Role of acid-base consumption on expression of BK-α and BK-β4.
We performed experiments to determine whether the acid/base status was solely responsible for the apical expression of BK-α by acidifying or alkalinizing the drinking water of WT on a control diet. The laboratory values for mice on NH4Cl, NaCl, or NaHCO3 in their drinking water are shown in Table 2.
Table 2.
Urinary and plasma values for WT mice given NaCl, NaHCO3, or NH4Cl in their drinking water
| V, ml/day | U[K], mM | U[Na], mM | Uosm, mosmol/kgH2O | UpH | P[K], mM | P[Na], mM | Posm, mosmol/kgH2O | Hct, % | |
|---|---|---|---|---|---|---|---|---|---|
| NaCl (n = 6) | 1.76 | 223 | 679.1 | 2605 | 6.65 | 3.66 | 146.5 | 290 | 39.2 |
| ±SE | 0.45 | 43.4 | 54.5 | 298 | 0.09 | 0.09 | 1.4 | 3.6 | 1.8 |
| NaHCO3 (n = 7) | 1.15 | 253.1 | 635.8 | 2396 | 8.48* | 3.5 | 150.9 | 288.6 | 41.7 |
| ±SE | 0.18 | 21.9 | 59.9 | 200 | 0.34 | 0.13 | 1.5 | 3.4 | 1.6 |
| NH4Cl (n = 6) | 1.53 | 188.2 | 151.5* | 2235 | 5.71* | 4.8* | 132.6* | 297.8 | 42.3 |
| ±SE | 0.21 | 18.1 | 17.1 | 205 | 0.04 | 0.2 | 1.2 | 5.2 | 0.6 |
Values are means ± SE. All definitions are the same as in Table 1.
P < 0.05 vs. NaCl.
As shown in Table 2 and Fig. 7A, the urinary pH was significantly less for mice drinking NH4Cl water (5.71 ± 0.04; n = 6) and significantly greater in mice drinking NaHCO3 water (8.48 ± 0.34; n = 7), compared with mice drinking NaCl water (6.65 ± 0.09; n = 6). The TTKG, shown in Fig. 7B, was significantly less in mice drinking NH4Cl (5.4 ± 0.2; n = 6) and greater in mice drinking NaHCO3 water 8.5 ± 0.3 (n = 7), compared with mice on NaCl water (6.7 ± 0.8; n = 5). These results show that the secretion of K is directly associated with the systemic urinary alkalinization of the mice.
Fig. 7.

IHC analysis of BK-α in mice with acid, neutral or alkaline drinking water. Summary bar plots showing (A) urinary pH and (B) transtubular K gradient (TTKG) of WT mice drinking NH4Cl, NaCl, or NaHCO3 water. C: representative stainings of BK-α in the cortex and medulla of WT mice drinking NH4Cl, NaCl, or NaHCO3 water (magnification: ×40). Summary bar plots of fluorescence intensity for BK-α expression in apical (D), total (E), and proportion of apical/total (F) levels in the cortex or medulla. Apical and proportion of apical/total BK-α intensity values were significantly decreased in the NH4Cl group and significantly increased in the NaHCO3 group, compared with the NaCl group. No significant difference in total BK-α expression among these 3 groups was found in either the cortical or medullary preparations. Values are means ± SE. *P < 0.05 vs. NaCl; n ≥ 9 in each group.
We performed IHC to determine whether acid/base status of mice on a normal diet exhibited increased apical expression of BK-α. Representative immunoblots of Fig. 7C and the summary bar plots of BK-α expression of apical (Fig. 7D), total cell (Fig. 7E), and apical/total cell (Fig. 7F) show the effects of acid/base on the localization of BK-α in the IC of the CCD. Although total cell BK-α expression was unaffected by acid/base, increased urinary alkalinization was associated with increased expression of BK-α in the apical membrane. In the MCD, BK-α expression of mice drinking NaHCO3 water shifted from the perinuclear region to the apical membranes of both IC and PC. Both the CCD and MCD exhibited decreased apical expression of BK-α when mice were acidified with NH4Cl water.
To corroborate the IHC results for acid/base, we performed Western blots to examine the effects of acid/base status on BK-α and BK-β4 expression in the mice kidneys (combined cortical and medullary). As shown by the immunoblots of Fig. 8A and the summary bar plots, the total cellular expression level of BK-β4 (Fig. 8B) increased significantly when the mice were given NaHCO3 and decreased significantly when mice were treated with NH4Cl. As shown in Fig. 8C, the total cellular BK-α expression was slightly but significantly increased in mice drinking NH4Cl compared with NaCl water; however, BK-α was unchanged in mice drinking NaHCO3, compared with NaCl water. As shown by the immunoblots of Fig. 8D and the summary bar plots of Fig. 8E, the PM BK-α expression was significantly increased in the mice drinking NaHCO3 and significantly reduced in mice drinking NH4Cl.
Fig. 8.

Western blot analysis of renal BK-α and BK- β4 expressions in mice with acid, neutral or alkaline drinking water. Representative immunoblots of total cellular BK-α expression (A) and summary bar plots of total BK-β4 expression (B) and total BK-α expression (C) in kidneys from mice drinking water containing NH4Cl, NaCl, or NaHCO3. β-Actin was used as loading control for total cell lysate proteins. Representative immunoblots (D) and summary bar plots (E) showing PM BK-α expression of mice drinking water containing NH4Cl, NaCl or NaHCO3. Values are means ± SE. *P < 0.05 vs. NaCl; n = 4 in each group.
These results reveal that urinary alkalinization alone yields increased BK-β4 expression and trafficking of the BK-α to the apical membrane of IC of the CCD and IC and PC of the MCD.
Role of aldosterone in expression of BK-α and BK-β4.
The increase in BK-α expression in the CCD and MCD of mice consuming a high-K diet may have resulted from a direct effect of high plasma [K] or by an increase in aldosterone stimulated by high plasma [K]. It was previously shown that plasma [K] only increases by 0.23 mM when WT mice consume a HK-alk diet (12); however, aldosterone secretion increases by 100% with plasma [K] elevations of only 1 mM (33). Table 3 shows the laboratory values, including urinary volume, hematocrit, urinary pH, urinary [K] and [Na], and plasma [K] and [Na] for WT on HK-alk treated by gavage with either vehicle or spironolactone. As shown, the plasma [K] was greater in the group given spironolactone, compared with vehicle. The hematocrit was slightly but significantly greater in the spironolactone group, indicating slight volume depletion.
Table 3.
Urinary and plasma values for WT mice on HK diets and treated with either vehicle or spironolactone
| V, ml/day | U[K], mM | U[Na], mM | Uosm, mosmol/kgH2O | UpH | P[K], mM | P[Na], mM | Posm, mosmol/kgH2O | Hct, % | |
|---|---|---|---|---|---|---|---|---|---|
| HK-veh (n = 3) | 6.29 | 347.2 | 52.1 | 1087 | 8.7 | 4.24 | 144.7 | 290 | 43 |
| ±SE | 0.76 | 32.1 | 8.4 | 108 | 0.2 | 0.14 | 2.2 | 0 | 0.4 |
| HK-spiro (n = 4) | 7.08 | 239.8* | 93.8* | 979 | 8.8 | 5.64* | 148.4 | 290 | 45.3* |
| ±SE | 0.7 | 11.3 | 1.2 | 54 | 0.3 | 0.31 | 0.7 | 0 | 0.6 |
Values are means ± SE.
Spiro, spironolactone; veh, vehicle.
All other definitions are the same as in Table 1
P < 0.05 vs. HK-veh.
Figure 9 illustrates with IHC the effects of spironolactone, a mineralocorticoid receptor blocker, on the expression of BK-α in the renal cortex and medulla of mice on a HK-alk diet. As shown with spironolactone treatment, the TTKG (Fig. 9A) was reduced significantly from 21.9 ± 0.9 (n = 3) to 13.2 ± 0.9 (n = 4) and the UNa/UK (Fig. 9B) was increased significantly from 0.17 ± 0.01 (n = 3) to 0.39 ± 0.02 (n = 4). These results show that spironolactone effectively attenuates the increase in Na reabsorption and K secretion that is attributed to high plasma [K]-stimulated aldosterone levels.
Fig. 9.

IHC determination of effects of vehicle (veh) or spironolactone on BK-α expression in CCD and MCD of WT mice on HK-alk. Effects of spironolactone on the TTKG (A) and the urinary [Na]-to-urinary [K] ratio UNa/UK (B), where brackets indicate concentration. C: representative IHC (magnification: ×40) and summary bar blots of BK-α fluorescence staining intensity of apical (D), total (E), and apical/total (F) in the cortex and medulla of mice on HK-alk diets and treated with vehicle or spironolactone. *P < 0.05 vs. HK-alk + veh; n ≥ 9 in each group.
We performed IHC to examine the effect of spironolactone on apical and cellular expression of BK-α in mice on HK-alk. As shown by the representative stainings of BK-α (Fig. 9C) and summary bar graphs of BK-α staining intensity for apical (Fig. 9D), total (Fig. 9E), and apical/total (Fig. 9F), there was a decrease in overall BK-α expression with spironolactone treatment, consistent with the view that aldosterone increases the transcription of BK-α in the distal nephron. However, the proportion of apical per total BK-α expression was not changed in the CCD or MCD with spironolactone treatment.
Western blot analysis was used to determine the effects of spironolactone on total and PM BK-β4 and BK-α expression in kidneys of HK-alk mice. As shown by the representative immunoblots in Fig. 10A and the summary bar plots of relative densitometries (Fig. 10, B and C), spironolactone treatment significantly reduced total cellular BK-α expression but did not affect total cellular BK-β4 expression. As shown by the representative immunoblot of the PM of Fig. 10D and the summary bar plots of the densitometries (Fig. 10E), spironolactone significantly decreased the PM expression of BK-α.
Fig. 10.

Western blot analysis of renal BK-α and BK-β4 expression in WT on HK-alk diets treated with vehicle or spironolactone. Representative immunoblots (A) and summary bar plots of relative densitometries of total cell lysate BK-β4 (B) and BK-α (C) expressions in kidneys of mice on HK-alk treated with vehicle or spironolactone. β-Actin was used as loading control for total cell lysate proteins. Representative immunoblots (D) and summary bar plots (E) of PM densitometries of BK-α expression in the kidneys of mice on HK-alk treated with vehicle or spironolactone. Cadherin was used as loading control for PM proteins. *P < 0.05 vs. HK-alk + veh; n = 3 in each group.
Mechanism of regulated apical BK-α expression by BK-β4 in IC.
MDCK-C11 cells (C11) are a subclone of MDCK with a predominant IC phenotype. We previously showed that BK-β4 is mostly expressed at the apical membrane of MDCK-C11 cells as examined by confocal fluorescence microscopy (15). It has been shown previously that the expression of BK-α and other K channels in the plasma membrane are controlled by the lysosomal pathway (13, 19, 21, 43). We hypothesized that BK-β4 stabilizes the apical expression of BK-α in IC by inhibiting their degradation rather than promoting trafficking from the endoplasmic reticulum to the apical membrane. The immunoblots of Fig. 11A and the summary bar plots of Fig. 11B show the purity of the isolated PM fraction of C11 cells, using cadherin as a PM marker and GAPDH as a cytosolic marker. As shown, the cadherin-to-GAPDH ratio is more than fivefold enriched compared with the cytosolic fraction and twofold enriched compared with the organelle membrane fraction.
Fig. 11.

Western blot analysis of BK-β4 and PM BK-α expression in MDCK-C11 cells. Immunoblots (A) and summary bar plots (B) demonstrating the relative densitometries of cadherin/GAPDH in the PM, OM, and cytosolic (C) fractions of MDCK-C11 cells. *P < 0.01 vs. C; #P < 0.01 vs. OM; n = 3 in each group. C: representative immunoblots and summary bar plots of densitometries of the total cellular lysate (TCL) from BK-β4 (D) and BK-α (E) in PM after treating with scramble or BK-β4 small interfering (si)RNA in DMSO, 500 nM bafilomycin, or 50 μM leupeptin. β-Actin was used as loading control for TCL proteins, and cadherin was the loading control for PM proteins. P < 0.05 vs. scramble siRNA + DMSO; #P < 0.05 vs. BK-β4 siRNA + DMSO; n = 3 in each group.
As shown by the immunoblots of Fig. 11C, top, and the summary bar plots of Fig. 11D, addition of BK-β4 siRNA significantly reduced, compared with scramble siRNA, the total cellular lysate expression of BK-β4. In the continued presence of BK-β4 siRNA, the expression of BK-β4 was not significantly reversed by treatment with bafilomycin or leupeptin, both of which are specific lysosome inhibitors. As shown by the immunoblots of BK-α in the PM fraction (Fig. 11C, bottom) and the summary bar plots of Fig. 11E, addition of BK-β4 siRNA significantly diminished, compared with scrambled siRNA, BK-α expression in the PM. In the presence of scrambled BK-β4 siRNA, there was a minimal, insignificant, increase in BK-α expression when treated with bafilomycin or leupeptin. These results suggest that BK-β4 stabilizes surface BK-α expression by inhibiting their degradation through the lysosomal pathway.
DISCUSSION
Our results showed that BK-α was located predominantly in IC of the cortical collecting ducts and in both PC and IC of the outer medullary collecting ducts. For WT placed on HK-alk, but not on a HK-Cl, BK-α localized to the apical membranes of cortical IC and the apical membranes of both IC and PC of the medulla. For β4KO, BK-α was retained in the cytoplasm of cells regardless of diet. Western blot and IHC showed that BK-α was upregulated by a high-K diet, regardless of acid-base status of the mice; however, total cellular BK-β4 was enhanced by alkaline conditions and the BK-α was expressed more abundantly in the apical membrane during alkaline conditions. Spironolactone, an aldosterone receptor blocker, attenuated the increase in overall cellular BK-α expression but did not affect the proportion of apical to cellular BK-α expression. Our results from MDCK-C11 cells indicate that the BK-β4 subunit stabilizes BK-α in the apical membrane by preventing its degradation via a lysosomal pathway.
Role of BK-β4 and acid-base status in BK-α expression in PM.
Previous studies have revealed roles for ancillary subunits in the trafficking of BK channels to the plasma cell membrane. Coexpression of BK-β4 subunits decreased BK-α in the basolateral membrane of auditory hair cells (4) and neuron cells (36). However, subunits of other types of channels, such as L-type Ca channels (8), play roles in trafficking of the pore-forming channel to the plasma membrane. The role of BK-β4 in the apical expression of BK-α, as determined in the present study, is different than the role of BK-β4 in the expression of BK-α in the plasma membrane of hair cells or neuronal cells, which are functionally and structurally similar to the basolateral membrane of epithelial cells. BK-β4 localizes mostly in the cytosol of cultured neuron cells (34) but at the apical membrane of cultured IC cells (15). Moreover, Neph1, which expresses both in neurons and kidney podocytes, exhibited decreased surface BK-α expression in embryonic neurons, but increased expression in epithelial-like podocytes (20).
In the present study, our data support the notion that BK-β4 regulates BK-α expression in the plasma membrane by inhibiting its lysosomal degradation. The surface expression of BK was previously shown to result from regulating the lysosomal degradation pathway (43). The latter finding was interesting because the kidney-specific with no lysine kinase 1 (KS-WNK1), which is part of the kinase system that distinguishes between high-K-stimulated aldosterone and low Na-stimulated aldosterone, regulates BK in collecting ducts by preventing its lysosomal degradation (13). Kir2.1 currents in myocytes are also increased and stabilized by preventing the lysosomal breakdown with leupeptin (19). We did not investigate the details of the degradative pathway with respect to BK-α and its subunits; however, there is precedence for this finding. A previous study found that the lysosomal protein LIMP2 is important in preventing the lysosomal degradation of KCNQ1 and its subunit KCNE1 thereby stabilizing their apical membrane localization in the marginal cells of the stria vascularis (21). The role of acid/base and BK-β4 in the prevention of lysosomal breakdown of BK-α will be detailed in future studies.
It was interesting that the apical BK-α expression was more prevalent in alkaline, rather than acidic conditions. This supports our finding that mice on an HK-alk diet maintain K balance, whereas mice on an acidic high-K diet exhibit elevated plasma [K] (6). Part of this mechanism probably involves direct inhibition of ROMK by a decreasing luminal pH (5, 34). Low internal pH inhibits BK channels (2); however, inhibition by low external pH (luminal compartment) has not been reported. Therefore, a different mechanism likely governs pH regulation of K secretion via BK-α/β4.
It is not understood how alkalosis enhanced BK expression in the apical membrane. However, acetazolamide, which increases luminal HCO3 concentration by inhibiting the proximal Na-HCO3 exchange process, increased epithelial Na channel (ENaC) in the apical membrane and enhanced ENaC-mediated Na reabsorption (29). Therefore, in addition to promoting apical BK expression, the alkaline urine may promote coupling of ENaC-mediated Na reabsorption with BK-α/β4-mediated K secretion, rather than Na absorption via the NCC of the early distal convoluted tubule. The reason for the decreased BK-α in NaCl and NaHCO3, compared with NH4Cl drinking water is uncertain but possibly due to the decreased plasma aldosterone in animals with high Na intake (14).
Our results support the notion that BK-α/β4 mediates K secretion from β-IC, which are more prevalent in the CNT and initial collecting ducts (25) and where K secretion would be supported by pendrin-mediated HCO3 secretion as occurs when the urine is alkalinized. However, the significance of BK channels in the MCD is not clear. In the medullary region where water is absorbed, high-K loading would yield a very high luminal K concentration, such that K would reabsorb (recycle) rather than secrete. It is possible that the BK-αβ4 is a pathway for medullary K recycling as previously described by Stokes (38).
Role of aldosterone.
Aldosterone plays a significant role in regulating the excretion of K when consuming a high-K diet (9). Our experiments with spironolactone are evidence that high plasma K-induced aldosterone regulates the synthesis of BK. It was shown previously that a high-K diet causes elevated mRNA of BK-α and BK-β4 in isolated rat collecting ducts (7). However, low Na (high renin)-induced aldosterone did not enhance BK expression, suggesting that BK was not regulated by aldosterone but rather by high plasma [K].
Our results explain why the low Na diet, and also treatment with DOCA (a synthetic mineralocorticoid), do not increase the number of BK found in cell-attached patches of the rat (27). BK may only be found in abundance in cell attached patches of the CCD if the mineralocorticoid stimulation is accompanied by a high-K and an alkaline load, which enhances its apical expression in IC. Aldosterone receptors are present in IC (1), where aldosterone regulates HCO3 (41) and H secretion (18). β-IC have substantial 11β-hydroxysteroid dehydrogenase type 2 (11-βHSD2) that inactivates 11-β-hydroxy glucocorticoids. These results support the notion that aldosterone regulates BK-α/β4-mediated K secretion from β-IC.
We would expect that aldosterone levels would be elevated in β4KO because plasma [K] is increased. However, we previously showed that the plasma aldosterone concentration was increased, but not significantly, in β4KO, compared with WT, on high-K diet (16). Either the sample size was too low to detect a difference or the adrenal glomerulosa cells of β4KO were less responsive to elevations in plasma [K]. Regardless, the reduced relative apical expression of BK-α in the β4KO was not the result of reduced aldosterone expression in β4KO.
In agreement with our results, a study demonstrated that aldosterone can directly increase luminal expression of colonic BK-α (37). Moreover, colonic K secretion is at least partially dependent on ENaC-mediated Na reabsorption (39), supporting an aldosterone effect to enhance the Na-dependent driving force for BK-mediated K secretion. Unlike the CCD, BK-α in the colon is expressed with BK-β2 (37). The role of the BK-β2 subunit and whether acid/base plays a role in luminal BK-α expression in the colon are not known.
In summary, this study provided new evidence for the mechanism whereby the BK-α/β4 channel of IC becomes involved in K secretion when animals consume a HK-alk diet. Elevated plasma K concentration, via mineralocorticoids, enhances BK expression in the CCD and MCD; however, BK-α only locates to the apical membrane when the kidneys are handling an alkaline load. BK-α expression in the high-K condition is dependent on aldosterone, while its trafficking to apical membrane is dependent on BK-β4 expression, which is regulated by urine pH. A HK-alk diet is considered the natural diet of ancient humans, whereas the “modern” diet is normally acidic and associated with a high Na and low K. It is interesting that regardless of the anion associated with K in the high-K diet, flow is still increased. It is possible that BK-α/β1, which is located in the apical membrane of connecting tubule cells, which have a central cilium, is responsible for flow-induced K secretion regardless of acid/base secretion, and the BK-α/β4 is regulated by high-K alkaline conditions when it is necessary to yield a high-K secreted to Na reabsorbed ratio that exceeds the 0.66 Na-K-ATPase pump ratio of principal cells.
GRANTS
This project was funded by National Institutes of Diabetes and Digestive and Kidney Diseases Grants RO1-DK-071014 and RO1 DK-73070 (to S. C. Sansom) and a fellowship (#11PRE7530018) from the American Heart Association MWA Affiliate (to R. J. Cornelius).
DISCLOSURES
No conflicts of interest, financial or otherwise, are declared by the author(s).
AUTHOR CONTRIBUTIONS
Author contributions: D.W. and S.C.S. conception and design of research; D.W., R.J.C., and Y.Y. performed experiments; D.W., R.J.C., and S.C.S. analyzed data; D.W., R.J.C., and S.C.S. interpreted results of experiments; D.W. and S.C.S. prepared figures; D.W. and S.C.S. drafted manuscript; D.W., R.J.C., and S.C.S. edited and revised manuscript; S.C.S. approved final version of manuscript.
REFERENCES
- 1. Ackermann D, Gresko N, Carrel M, Loffing-Cueni D, Habermehl D, Gomez-Sanchez C, Rossier BC, Loffing J. In vivo nuclear translocation of mineralocorticoid and glucocorticoid receptors in rat kidney: differential effect of corticosteroids along the distal tubule. Am J Physiol Renal Physiol 299: F1473–F1485, 2010 [DOI] [PubMed] [Google Scholar]
- 2. Avdonin V, Tang XD, Hoshi T. Stimulatory action of internal protons on Slo1 BK channels. Biophys J 84: 2969–2980, 2003 [DOI] [PMC free article] [PubMed] [Google Scholar]
- 3. Bachmann S, Koeppen-Hagemann I, Kriz W. Ultrastructural localization of Tamm-Horsfall glycoprotein (THP) in rat kidney as revealed by protein A-gold immunocytochemistry. Histochemistry 83: 531–538, 1985 [DOI] [PubMed] [Google Scholar]
- 4. Bai JP, Surguchev A, Navaratnam D. beta4-subunit increases Slo responsiveness to physiological Ca2+ concentrations and together with beta1 reduces surface expression of Slo in hair cells. Am J Physiol Cell Physiol 300: C435–C446, 2011 [DOI] [PMC free article] [PubMed] [Google Scholar]
- 5. Boudry JF, Stoner LC, Burg MB. Effect of acid lumen pH on potassium transport in renal cortical collecting tubules. Am J Physiol 230: 239–244, 1976 [DOI] [PubMed] [Google Scholar]
- 6. Cornelius RJ, Wen D, Hatcher LI, Sansom SC. Bicarbonate promotes BK-αlpha/beta4-mediated K excretion in the renal distal nephron. Am J Physiol Renal Physiol 303: F1563–F1571, 2012 [DOI] [PMC free article] [PubMed] [Google Scholar]
- 7. Estilo G, Liu W, Pastor-Soler N, Mitchell P, Carattino MD, Kleyman TR, Satlin LM. Effect of aldosterone on BK channel expression in mammalian cortical collecting duct. Am J Physiol Renal Physiol 295: F780–F788, 2008 [DOI] [PMC free article] [PubMed] [Google Scholar]
- 8. Fang K, Colecraft HM. Mechanism of auxiliary beta-subunit-mediated membrane targeting of L-type [Ca(V)1.2] channels. J Physiol 589: 4437–4455, 2011 [DOI] [PMC free article] [PubMed] [Google Scholar]
- 9. Field MJ, Stanton BA, Giebisch GH. Differential acute effects of aldosterone, dexamethasone, and hyperkalemia on distal tubular potassium secretion in the rat kidney. J Clin Invest 74: 1792–1802, 1984 [DOI] [PMC free article] [PubMed] [Google Scholar]
- 10. Grimm PR, Foutz RM, Brenner R, Sansom SC. Identification and localization of BK-β subunits in the distal nephron of the mouse kidney. Am J Physiol Renal Physiol 293: F350–F359, 2007 [DOI] [PubMed] [Google Scholar]
- 11. Grimm PR, Irsik DL, Liu L, Holtzclaw JD, Sansom SC. Role of BKbeta1 in Na+ reabsorption by cortical collecting ducts of Na+-deprived mice. Am J Physiol Renal Physiol 297: F420–F428, 2009 [DOI] [PMC free article] [PubMed] [Google Scholar]
- 12. Grimm PR, Irsik DL, Settles DC, Holtzclaw JD, Sansom SC. Hypertension of Kcnmb1−/− is linked to deficient K secretion and aldosteronism. Proc Natl Acad Sci USA 106: 11800–11805, 2009 [DOI] [PMC free article] [PubMed] [Google Scholar]
- 13. Hadchouel J, Soukaseum C, Busst C, Zhou XO, Baudrie V, Zurrer T, Cambillau M, Elghozi JL, Lifton RP, Loffing J, Jeunemaitre X. Decreased ENaC expression compensates the increased NCC activity following inactivation of the kidney-specific isoform of WNK1 and prevents hypertension. Proc Natl Acad Sci USA 107: 18109–18114, 2010 [DOI] [PMC free article] [PubMed] [Google Scholar]
- 14. Harrap SB, Clark SA, Fraser R, Towrie A, Brown AJ, Lever AF. Effects of sodium intake and aldosterone on the renal pressure-natriuresis. Am J Physiol Renal Fluid Electrolyte Physiol 254: F697–F703, 1988 [DOI] [PubMed] [Google Scholar]
- 15. Holtzclaw JD, Cornelius RJ, Hatcher LI, Sansom SC. Coupled ATP and potassium efflux from intercalated cells. Am J Physiol Renal Physiol 300: F1319–F1326, 2011 [DOI] [PMC free article] [PubMed] [Google Scholar]
- 16. Holtzclaw JD, Grimm PR, Sansom SC. Intercalated cell BK-αlpha/beta4 channels modulate sodium and potassium handling during potassium adaptation. J Am Soc Nephrol 21: 634–645, 2010 [DOI] [PMC free article] [PubMed] [Google Scholar]
- 17. Holtzclaw JD, Grimm PR, Sansom SC. Role of BK channels in hypertension and potassium secretion. Curr Opin Nephrol Hypertens 20: 512–517, 2011 [DOI] [PMC free article] [PubMed] [Google Scholar]
- 18. Izumi Y, Hori K, Nakayama Y, Kimura M, Hasuike Y, Nanami M, Kohda Y, Otaki Y, Kuragano T, Obinata M, Kawahara K, Tanoue A, Tomita K, Nakanishi T, Nonoguchi H. Aldosterone requires vasopressin V1a receptors on intercalated cells to mediate acid-base homeostasis. J Am Soc Nephrol 22: 673–680, 2011 [DOI] [PMC free article] [PubMed] [Google Scholar]
- 19. Jansen JA, de Boer TP, Wolswinkel R, van Veen TA, Vos MA, van Rijen HV, van der Heyden MA. Lysosome mediated Kir2.1 breakdown directly influences inward rectifier current density. Biochem Biophys Res Commun 367: 687–692, 2008 [DOI] [PubMed] [Google Scholar]
- 20. Kim EY, varez-Baron CP, Dryer SE. Canonical transient receptor potential channel (TRPC)3 and TRPC6 associate with large-conductance Ca2+-activated K+ (BKCa) channels: role in BKCa trafficking to the surface of cultured podocytes. Mol Pharmacol 75: 466–477, 2009 [DOI] [PMC free article] [PubMed] [Google Scholar]
- 21. Knipper M, Claussen C, Ruttiger L, Zimmermann U, Lullmann-Rauch R, Eskelinen EL, Schroder J, Schwake M, Saftig P. Deafness in LIMP2-deficient mice due to early loss of the potassium channel KCNQ1/KCNE1 in marginal cells of the stria vascularis. J Physiol 576: 73–86, 2006 [DOI] [PMC free article] [PubMed] [Google Scholar]
- 22. Liu W, Morimoto T, Woda C, Kleyman TR, Satlin LM. Ca2+ dependence of flow-stimulated K secretion in the mammalian cortical collecting duct. Am J Physiol Renal Physiol 293: F227–F235, 2007 [DOI] [PubMed] [Google Scholar]
- 23. McKenzie JK, McQueen EG. Immunofluorescent localization of Tamm-Horsfall mucoprotein in human kidney. J Clin Pathol 22: 334–339, 1969 [DOI] [PMC free article] [PubMed] [Google Scholar]
- 24. Misonou H, Menegola M, Buchwalder L, Park EW, Meredith A, Rhodes KJ, Aldrich RW, Trimmer JS. Immunolocalization of the Ca2+-activated K+ channel Slo1 in axons and nerve terminals of mammalian brain and cultured neurons. J Comp Neurol 496: 289–302, 2006 [DOI] [PMC free article] [PubMed] [Google Scholar]
- 25. Muto S, Yasoshima K, Yoshitomi K, Imai M, Asano Y. Electrophysiological identification of alpha- and beta-intercalated cells and their distribution along the rabbit distal nephron segments. J Clin Invest 86: 1829–1839, 1990 [DOI] [PMC free article] [PubMed] [Google Scholar]
- 26. Najjar F, Zhou H, Morimoto T, Bruns JB, Li HS, Liu W, Kleyman TR, Satlin LM. Dietary K+ regulates apical membrane expression of maxi-K channels in rabbit cortical collecting duct. Am J Physiol Renal Physiol 289: F922–F932, 2005 [DOI] [PubMed] [Google Scholar]
- 27. Pacha J, Frindt G, Sackin H, Palmer LG. Apical maxi K channels in intercalated cells of CCT. Am J Physiol Renal Fluid Electrolyte Physiol 261: F696–F705, 1991 [DOI] [PubMed] [Google Scholar]
- 28. Pastor-Soler NM, Hallows KR, Smolak C, Gong F, Brown D, Breton S. Alkaline pH- and cAMP-induced V-ATPase membrane accumulation is mediated by protein kinase A in epididymal clear cells. Am J Physiol Cell Physiol 294: C488–C494, 2008 [DOI] [PMC free article] [PubMed] [Google Scholar]
- 29. Pech V, Pham TD, Hong S, Weinstein AM, Spencer KB, Duke BJ, Walp E, Kim YH, Sutliff RL, Bao HF, Eaton DC, Wall SM. Pendrin modulates ENaC function by changing luminal HCO3−. J Am Soc Nephrol 21: 1928–1941, 2010 [DOI] [PMC free article] [PubMed] [Google Scholar]
- 30. Plotkin MD, Kaplan MR, Verlander JW, Lee WS, Brown D, Poch E, Gullans SR, Hebert SC. Localization of the thiazide sensitive Na-Cl cotransporter, rTSC1 in the rat kidney. Kidney Int 50: 174–183, 1996 [DOI] [PubMed] [Google Scholar]
- 31. Pluznick JL, Sansom SC. BK channels in the kidney: role in K+ secretion and localization of molecular components. Am J Physiol Renal Physiol 291: F517–F529, 2006 [DOI] [PubMed] [Google Scholar]
- 32. Pluznick JL, Wei P, Grimm PR, Sansom SC. BK-β1 subunit: immunolocalization in the mammalian connecting tubule and its role in the kaliuretic response to volume expansion. Am J Physiol Renal Physiol 288: F846–F854, 2005 [DOI] [PubMed] [Google Scholar]
- 33. Pralong WF, Hunyady L, Varnai P, Wollheim CB, Spat A. Pyridine nucleotide redox state parallels production of aldosterone in potassium-stimulated adrenal glomerulosa cells. Proc Natl Acad Sci USA 89: 132–136, 1992 [DOI] [PMC free article] [PubMed] [Google Scholar]
- 34. Sackin H, Nanazashvili M, Li H, Palmer LG, Walters DE. External K activation of Kir1.1 depends on the pH gate. Biophys J 93: L14–L16, 2007 [DOI] [PMC free article] [PubMed] [Google Scholar]
- 35. Saheki Y, Bargmann CI. Presynaptic CaV2 calcium channel traffic requires CALF-1 and the alpha(2)delta subunit UNC-36. Nat Neurosci 12: 1257–1265, 2009 [DOI] [PMC free article] [PubMed] [Google Scholar]
- 36. Shruti S, Urban-Ciecko J, Fitzpatrick JA, Brenner R, Bruchez MP, Barth AL. The brain-specific beta4 subunit downregulates BK channel cell surface expression. PLoS One 7: e33429, 2012 [DOI] [PMC free article] [PubMed] [Google Scholar]
- 37. Sorensen MV, Matos JE, Sausbier M, Sausbier U, Ruth P, Praetorius HA, Leipziger J. Aldosterone increases KCa1.1 (BK) channel-mediated colonic K+ secretion. J Physiol 586: 4251–4264, 2008 [DOI] [PMC free article] [PubMed] [Google Scholar]
- 38. Stokes JB. Na and K transport across the cortical and outer medullary collecting tubule of the rabbit: evidence for diffusion across the outer medullary portion. Am J Physiol Renal Fluid Electrolyte Physiol 242: F514–F520, 1982 [DOI] [PubMed] [Google Scholar]
- 39. Sweiry JH, Binder HJ. Characterization of aldosterone-induced potassium secretion in rat distal colon. J Clin Invest 83: 844–851, 1989 [DOI] [PMC free article] [PubMed] [Google Scholar]
- 40. Takata K, Kasahara T, Kasahara M, Ezaki O, Hirano H. Localization of Na(+)-dependent active type and erythrocyte/HepG2-type glucose transporters in rat kidney: immunofluorescence and immunogold study. J Histochem Cytochem 39: 287–298, 1991 [DOI] [PubMed] [Google Scholar]
- 41. Verlander JW, Hassell KA, Royaux IE, Glapion DM, Wang ME, Everett LA, Green ED, Wall SM. Deoxycorticosterone upregulates PDS (Slc26a4) in mouse kidney: role of pendrin in mineralocorticoid-induced hypertension. Hypertension 42: 356–362, 2003 [DOI] [PubMed] [Google Scholar]
- 42. Woda CB, Bragin A, Kleyman TR, Satlin LM. Flow-dependent K+ secretion in the cortical collecting duct is mediated by a maxi-K channel. Am J Physiol Renal Physiol 280: F786–F793, 2001 [DOI] [PubMed] [Google Scholar]
- 43. Zhuang J, Zhang X, Wang D, Li J, Zhou B, Shi Z, Gu D, Denson DD, Eaton DC, Cai H. WNK4 kinase inhibits Maxi K channel activity by a kinase-dependent mechanism. Am J Physiol Renal Physiol 301: F410–F419, 2011 [DOI] [PMC free article] [PubMed] [Google Scholar]