Abstract
KDOQI practice guidelines recommend pre-dialysis blood pressure (BP) <140/90 mm Hg. However, most prior hemodialysis studies found elevated mortality with low, not high, systolic blood pressure (SBP), possibly due to unmeasured confounders affecting BP and mortality such as severity of comorbidities. To lessen this bias, we analyzed facility-level BP practices, relating patient-level survival to the fraction of patients in BP categories at each dialysis facility in Cox regression models adjusted for patient and facility characteristics. Analyses included 24,525 patients in the Dialysis Outcomes and Practice Patterns Study. Compared with pre-dialysis SBP 130–159 mm Hg, mortality was 13% higher in facilities with 20% more patients at SBP 110–129 mm Hg and 16% higher in facilities with 20% more patients at SBP ≥160 mm Hg. For patient-level SBP, mortality was elevated at low (<130 mm Hg), not high (up to ≥180 mm Hg) SBP. For pre-dialysis diastolic BP, mortality was lowest at 60–99 mm Hg, a wide range suggesting less chance to improve outcomes. Higher mortality at SBP <130 mm Hg is consistent with prior studies and may be due to excessive BP-lowering during dialysis. The lowest risk facility SBP range of 130–159 mm Hg indicates this range may be optimal, but may have been influenced by unmeasured facility practices. While additional study is needed, the findings contrast with KDOQI BP targets, and provide guidance on optimal BP range in absence of definitive clinical trial data.
Introduction
Hypertension (HTN) is a leading cause of mortality worldwide.1,2 Based on large clinical outcomes trials, clinical practice guidelines (CPGs) recommend treatment to blood pressure (BP) <140/90 in most patients with HTN and <130/80 in patients with diabetes or chronic kidney disease.3
Patients with end-stage renal disease (ESRD) treated by dialysis have increased risk of mortality, with nearly 50% of deaths due to cardiovascular (CV) causes.4,5 The burden of ESRD is rising internationally, with prevalence of ESRD treated by dialysis exceeding 350,000 in the United States.4,6 Because the prevalence of HTN among maintenance dialysis patients is 60–90%,5,7 its treatment is considered an important means to improve outcomes. The 2005 National Kidney Foundation Kidney Disease Outcomes Quality Initiative (KDOQI) CPG recommends pre- and post-dialysis BP goals of <140/90 and 130/80 mm Hg, based in part on data in the non-dialysis population. A direct relation between treatment of elevated BP levels and improved outcomes among dialysis patients has not been demonstrated, and definitive clinical trials investigating optimal target BP have yet to be carried out. Observational studies consistently have found elevated mortality in patients with low, but not high, BP levels.5,8–13
Some have speculated that the explanation for the observed relation between lower BP and elevated mortality is that hemodialysis (HD) patients have serious co-existing illness (e.g., poor ventricular function) that lowers BP and increases mortality risk (i.e., association of lower BP with elevated mortality is confounded by poor health status).5 Because observational analyses of BP and clinical outcomes are subject to bias due to unmeasured patient characteristics affecting BP and health status (i.e., unmeasured confounders), an objective of the study was to lessen this bias using analysis of BP management practices at the dialysis facility level, relating patient-level survival to the fraction of patients in each BP category at each dialysis facility. Analyses of patient-level BP are also presented. A goal of the study was to identify the possible optimal range of achieved BP for most patients in an HD unit, directly informing treatment decisions in routine clinical practice.
Results
Among 24,525 patients, total patient years of follow-up were 42,174, number of deaths was 5849, and mortality rate was 0.14 per year.
Distributions of Pre-Dialysis BP and Patient Characteristics by Pre-Dialysis SBP
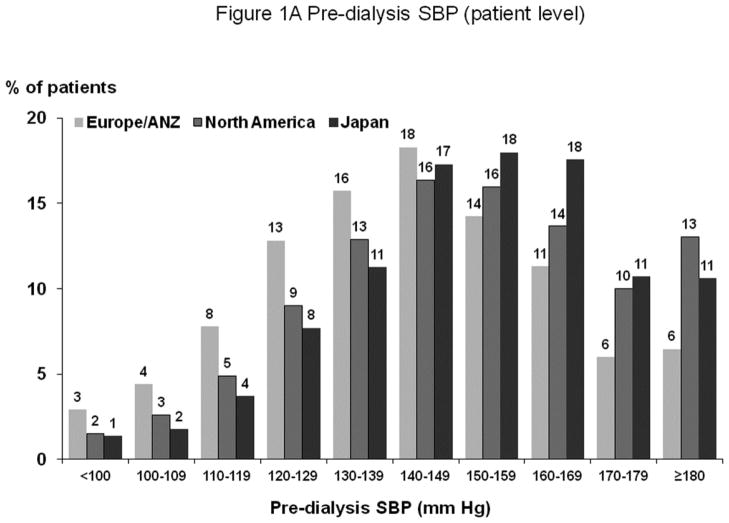
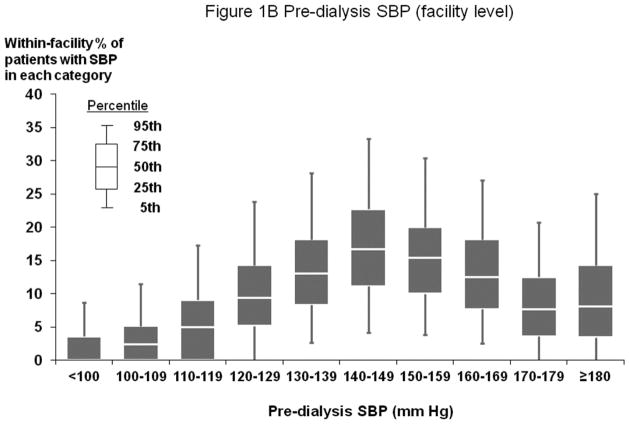
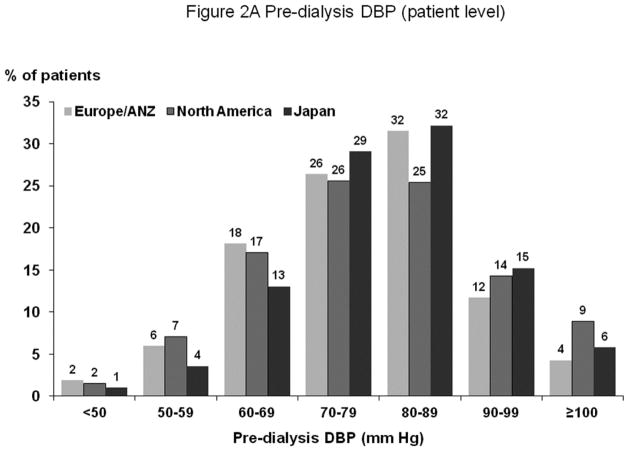
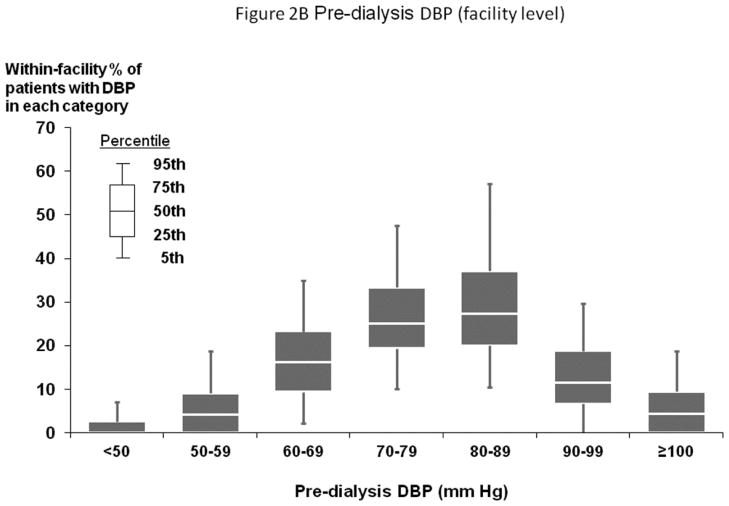
Figures 1A and 2A show distribution of pre-dialysis systolic blood pressure (SBP) and diastolic blood pressure (DBP) by region. Among all study participants, mean SBP was 147±24 mm Hg; mean DBP was 77±14 mm Hg. By region, Europe and Australia/New Zealand (ANZ) had lower average BP levels. Figures 1B and 2B show facility-level pre-dialysis SBP and DBP distribution, demonstrating substantial variation between facilities. Table 1 shows distributions of selected baseline patient characteristics by patient-level SBP, demonstrating generally unbalanced distributions of measured variables across SBP categories. Large variations in patient characteristics across patient-level SBP categories were also found within each region. When patients were categorized according to facility-level SBP (by quartiles, based on percent of facility patients with SBP ≥160 mm Hg) within each region, the majority of patient characteristics were balanced (Supplemental Table A).
Figure 1.
(A) Distribution of Patient-Level Pre-Dialysis SBP (by Region)
(B) Distribution of Facility-Level Pre-Dialysis SBP (Overall)
n=25,907 HD patients from 922 facilities in DOPPS I–III with ESRD duration >180 days. Europe/ANZ includes France, Germany, Italy, Spain, U.K., Belgium, Sweden, Australia, and New Zealand. North America includes U.S. and Canada. The mean (SD) of pre-dialysis SBP in Europe/ANZ, North America, and Japan were 141 (24), 151 (24), and 151 (22) mm Hg, respectively.
Figure 2.
(A) Distribution of Patient-Level Pre-Dialysis DBP (by Region)
(B) Distribution of Facility-Level Pre-Dialysis DBP (Overall)
n=25,836 HD patients from 921 facilities in DOPPS I–III with ESRD duration >180 days. Abbreviations: See footnote of Figure 1A–B. The mean (SD) of pre-dialysis DBP in Europe/ANZ, North America, and Japan were 76 (14), 79 (15), and 79 (13) mm Hg, respectively.
Table 1.
Baseline patient characteristics (means or proportions) by category of patient SBP at baseline
| Characteristic (mean or %) | Patient SBP Categories
|
P-value* | |||
|---|---|---|---|---|---|
| <110 mm Hg | 110–129 mm Hg | 130–159 mm Hg | ≥160 mm Hg | ||
|
| |||||
| (n=1,370) | (n=4,209) | (n=12,139) | (n=8,188) | ||
| SBP (mm Hg) | 98 | 120 | 144 | 174 | - |
| Demographics | |||||
| Age (y) | 63.2 | 62.2 | 61.3 | 61.1 | 0.31 |
| Body mass index | 24.1 | 24.5 | 24.4 | 24.3 | 0.08 |
| Black race (overall) | 9% | 9% | 12% | 16% | <0.0001 |
| Black race (US only) | 8% | 8 | 11% | 15% | <0.0001 |
| Male | 54% | 55% | 58% | 58% | 0.01 |
| Years with ESRD | 7.1 | 5.6 | 5.3 | 5.0 | <.0001 |
| Education (above high school) | 47% | 48% | 51% | 51% | <0.0001 |
| Income (above $20,000 or equivalent) | 32% | 33% | 33% | 30% | 0.02 |
| Coexisting conditions | |||||
| Coronary heart disease | 50% | 47% | 44% | 45% | 0.51 |
| Cancer | 14% | 13% | 11% | 9% | 0.0004 |
| Other cardiovascular disease | 50% | 41% | 36% | 33% | <.0001 |
| Cerebrovascular disease | 17% | 16% | 16% | 18% | <.0001 |
| Congestive heart failure | 41% | 35% | 31% | 34% | 0.0004 |
| Diabetes mellitus | 24% | 27% | 33% | 44% | <.0001 |
| Gastrointestinal bleed in past 12 mo | 7% | 6% | 6% | 6% | 0.68 |
| HIV/AIDS | 0.5% | 0.5% | 0.9% | 0.9% | 0.17 |
| Lung disease | 15% | 13% | 11% | 10% | 0.01 |
| Neurological disorders | 14% | 11% | 10% | 10% | 0.89 |
| Psychiatric disorder | 20% | 18% | 17% | 16% | 0.18 |
| Peripheral vascular disease | 29% | 25% | 25% | 26% | <.0001 |
| Recurrent cellulitis/gangrene | 11% | 8% | 8% | 8% | 0.07 |
| Labs and dialysis variables | |||||
| Hemoglobin (g/dL) | 11.3 | 11.3 | 11.1 | 10.9 | 0.0014 |
| Serum PTH (pg/mL) | 281 | 274 | 277 | 282 | 0.12 |
| Serum phosphorus (mg/dL) | 5.4 | 5.4 | 5.6 | 5.7 | <.0001 |
| Serum albumin (g/dL) | 3.6 | 3.7 | 3.8 | 3.8 | <.0001 |
| Serum ferritin (ng/mL) | 481 | 443 | 422 | 405 | 0.92 |
| Serum creatinine (mg/dL) | 8.8 | 9.2 | 9.5 | 9.8 | 0.0048 |
| Use of catheter (%) | 21% | 17% | 13% | 13% | 0.0006 |
| Single-pool Kt/V | 1.49 | 1.46 | 1.44 | 1.42 | <.0001 |
| Number of antihypertensive medications | 0.6 | 0.8 | 1.2 | 1.6 | <0.0001 |
25,907 HD patients from 922 facilities in DOPPS I–III (all countries) with ESRD duration >180 days.
P values were obtained from separate linear mixed or logistic models with each patient characteristic as outcome and a categorical variable of BP category as predictor, adjusting for geographic region and study phase and accounting for facility-clustering effects, to test for difference in each patient characteristic (mean or %) across three SBP categories (excluding SBP <110 mm Hg [shaded]).
All-Cause Mortality by Pre-Dialysis SBP Categories (Patient-Level and Facility-Level)
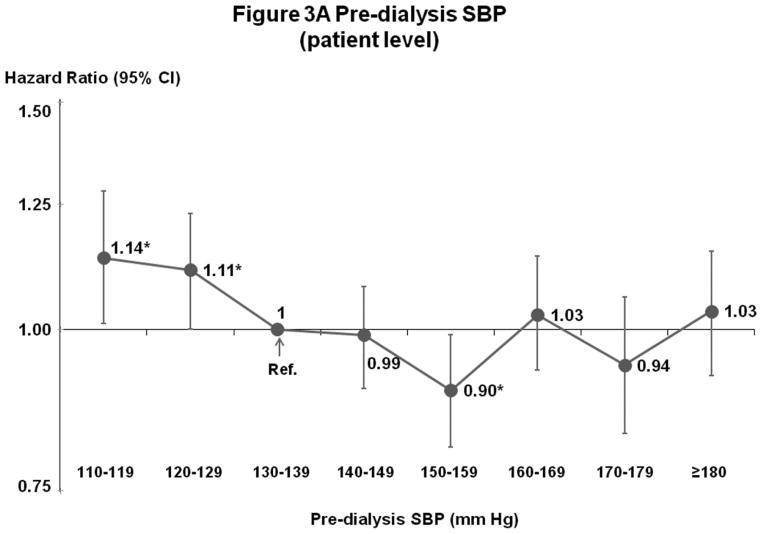
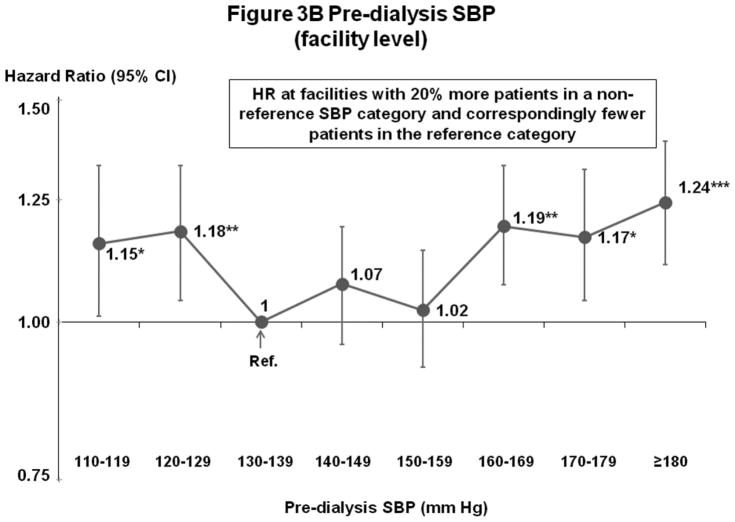
Figures 3A–B show results of fully-adjusted multivariable models. Compared with the reference category 130–139 mm Hg, all-cause mortality was elevated for patients with SBP 110–119 mm Hg (hazard ratio [HR]=1.14, 95% confidence interval [CI]=1.01–1.28, p=0.03) and 120–129 mm Hg (HR=1.11, 95% CI=1.00–1.23, p=0.04), and lower for patients with SBP 150–159 mm Hg (HR=0.90, 95% CI=0.81–0.99, p=0.03). For patients with SBP ≥160 mm Hg, there was no consistent difference in mortality from the reference category. Analyses of facility-level SBP categories (6 continuous variables, representing the proportion of facility patients in each SBP category except 130–139 mm Hg) showed elevated mortality consistently across low and high SBP categories. Combining categories based on results in Figure 3B, for facilities with 20% more patients in categories other than 130–159 mm Hg, higher mortality was observed for 110–129 mm Hg (HR=1.13 95% CI=1.05–1.21, p=0.001) and ≥160 mm Hg (HR=1.16, 95% CI=1.10–1.23, p<0.001). As corroborative data, Supplemental Table B shows generally lower crude mortality rates facilities with more patients in the SBP 130–159 mm Hg range. The result of instrumental variable analysis also indicated a U-shape association between SBP and mortality, with elevated hazards at <130 and ≥150 mm Hg (Supplemental Table C).
Figure 3.
(A) Mortality by Patient-Level Pre-Dialysis SBP Categories (Fully-Adjusted)
(B) Mortality by Facility-Level Pre-Dialysis SBP Categories (Fully-Adjusted)
n=24,525 HD patients from 920 facilities in DOPPS I–III with ESRD duration >180 days, excluding patients with pre-dialysis SBP <110 mm Hg. Cox models were stratified by geographic region and study phase, accounting for facility-clustering effects, and adjusted for all demographics, comorbid conditions, and labs listed in Table 1. Facility-level analyses were adjusted additionally for 5 facility practices. For this and subsequent figures, vertical lines represent 95% confidence intervals (CIs). HR=Hazard Ratio. *0.01≤p<0.05; **0.001≤p<0.01; ***p<0.001.
As a sensitivity analysis, we examined the association of SBP with all-cause mortality among all patients, including those SBP <110 mm Hg (n=25,907). As expected, in patient-based analysis, HR for SBP <110 mm Hg was elevated (HR=1.55, 95% CI=1.39–1.71, p<0.001), compared with 130–139 mm Hg. Facility-level analyses were corroborative: patients in facilities with 20% more patients SBP <110 mm Hg versus reference group (130–159 mm Hg) had 27% higher mortality rate (HR=1.27, 95% CI=1.13–1.41, p<0.001). An additional analysis based on most recent SBP level, rather than median of three values, yielded similar findings. Comparable results were obtained when missing data were calculated by multiple imputation, with point estimates varying <2% and P values not appreciably altered.
Pre-Dialysis DBP
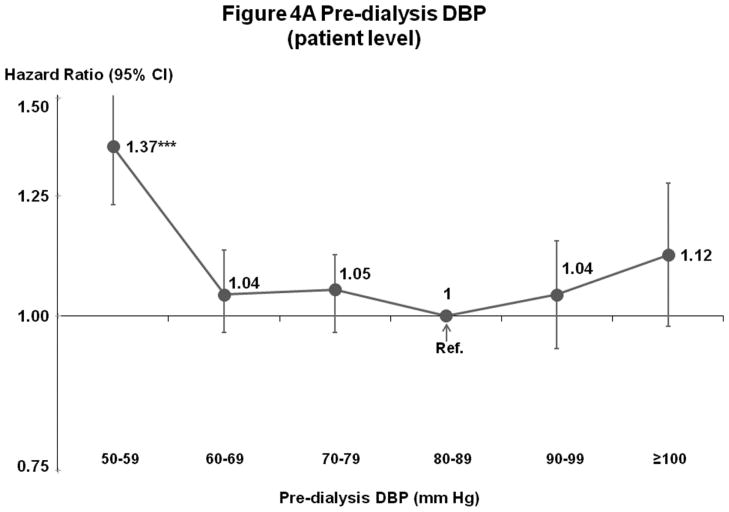
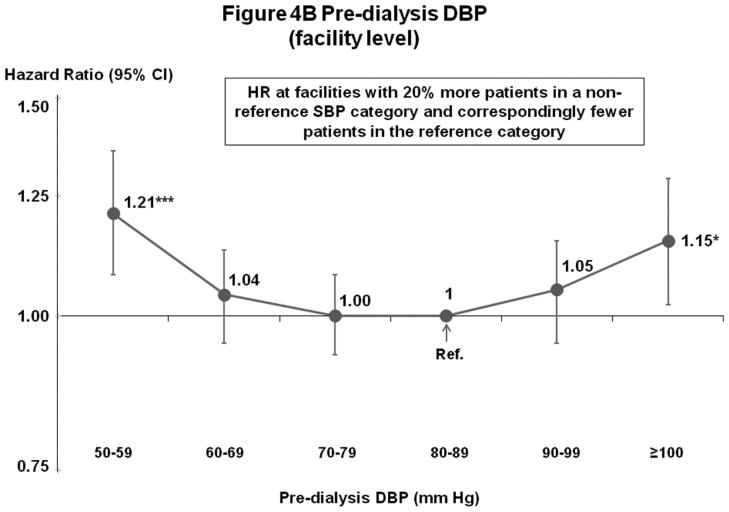
Mortality risk was lowest at 60–99 mm Hg in fully-adjusted patient and facility-level models (Figures 4A–B). Fewer patients had DBP outside 60–99 mm Hg (14%) than outside the lowest risk SBP range of 130–159 mm Hg (53%) (Figures 1A and 2A).
Figure 4.
(A) Mortality by Patient-Level Pre-Dialysis DBP Categories (Fully-Adjusted)
(B) Mortality by Facility-Level Pre-Dialysis DBP Categories (Fully-Adjusted)
n=25,424 HD patients from 919 facilities in DOPPS I–III with ESRD duration >180 days, excluding patients with pre-dialysis DBP <50 mm Hg. Cox models are as described for Figure 3.
Influence of Covariate Adjustment
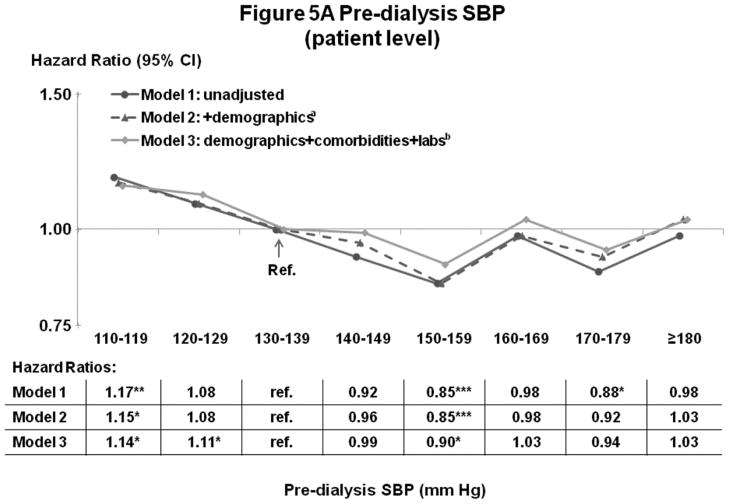
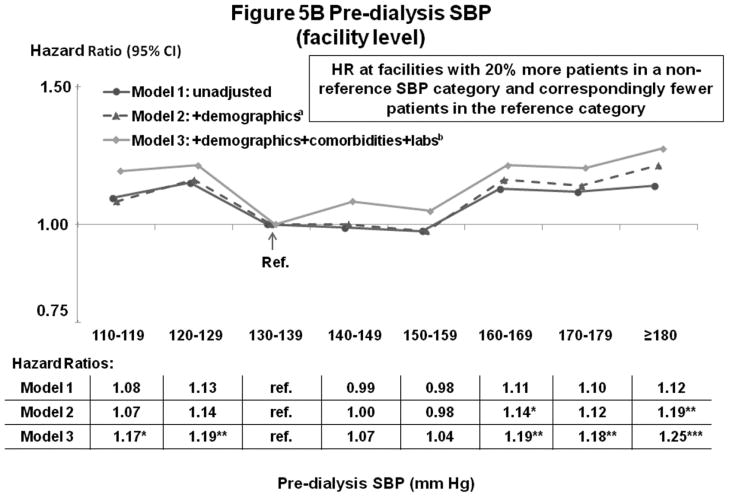
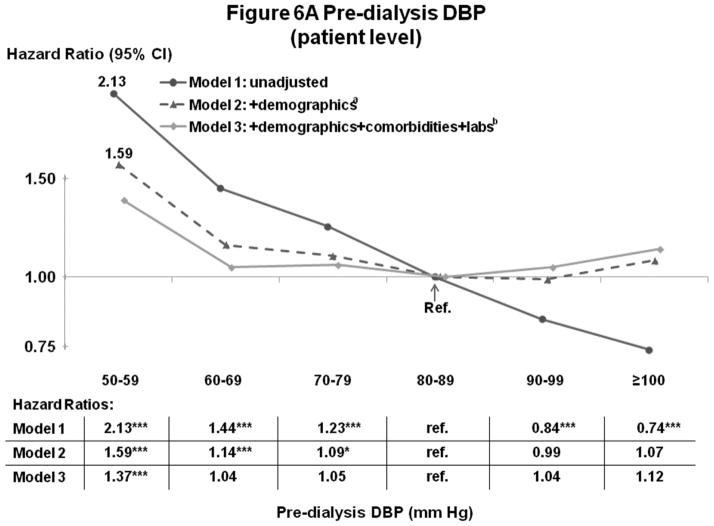
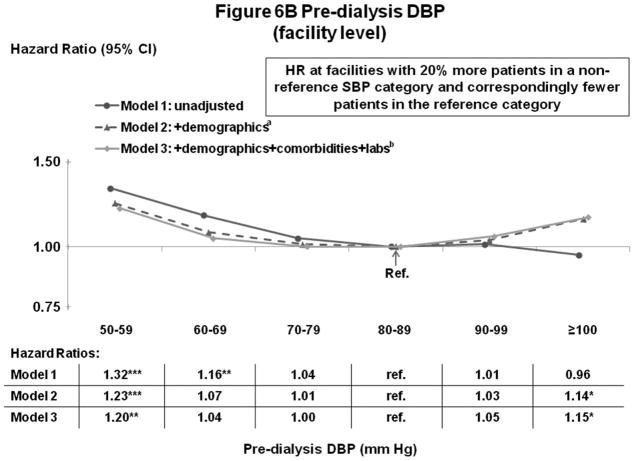
Figures 5A–B and 6A–B show the influence of progressively more comprehensive adjustment on the associations of pre-dialysis BP with survival. For patient-level SBP, associations were modestly attenuated (brought toward null) at higher BP, with adjustment for demographics, comorbidities, and laboratory values. Estimates for DBP were substantially attenuated by adjustment for demographics (mainly age), and were altered to a smaller extent by adjustment for comorbidities and lab values. At high DBP, progressive adjustment reversed direction of the association, from lower-to-higher mortality. As additional sensitivity analyses, adjustment for education level, household income, and antihypertensive agents had very little influence on the estimates presented herein. Antihypertensive agents were analyzed in three different ways: 1) any use (yes/no), 2) number of antihypertensive agents, and 3) separate dummy variables for seven classes of antihypertensive medications (Yes/No for: angiotensin receptor blockers, angiotensin-converting enzyme inhibitors [ACEi], beta blockers, calcium channel blockers, alpha blockers, central agonists, and vasodilators).
Figure 5.
(A) Mortality by Patient-Level Pre-Dialysis SBP Categories (Stepwise Adjustment)
(B) Mortality by Facility-Level Pre-Dialysis SBP Categories (Stepwise Adjustment)
n=24,525 patients, as described for Figure 3. a=adjusted for demographics in Table 1; b=adjusted for demographics, comorbid conditions, and labs in Table 1. For the facility-level SBP model, adjustment additionally for facility practices altered the HR slightly (as shown in Figure 3B).
Figure 6.
(A) Mortality by Patient-Level Pre-Dialysis DBP Categories (Stepwise Adjustment)
(B) Mortality by Facility-Level Pre-Dialysis DBP Categories (Stepwise Adjustment)
n=25,424 patients, as described for Figure 4. a=adjusted for demographics in Table 1; b=adjusted for demographics, comorbid conditions and labs in Table 1. For the facility-level DBP model, adjustment additionally for facility practices altered the HR slightly (as shown in Figure 4B).
Post-Dialysis BP
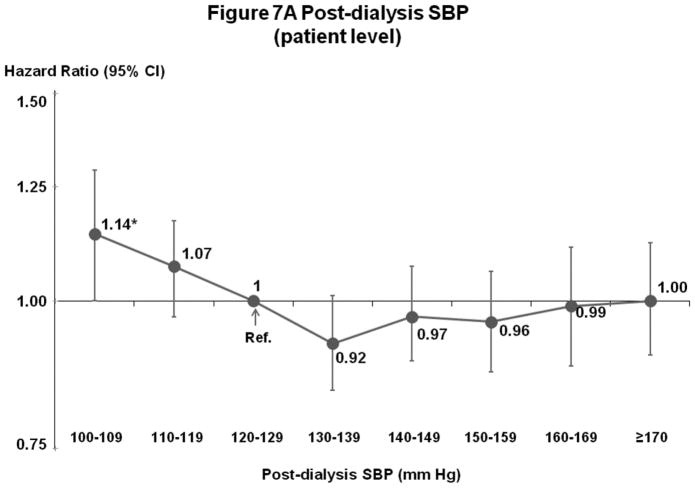
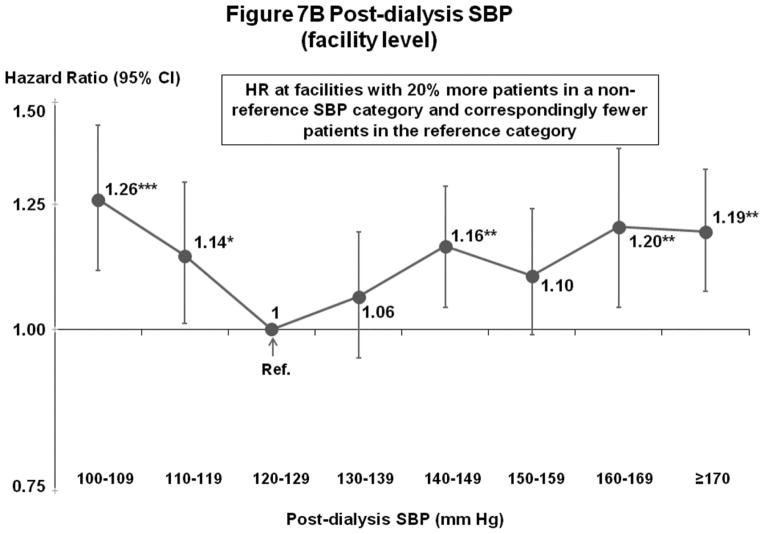
Post-Dialysis SBP (Figures 7A–B)
Figure 7.
(A) Mortality by Patient-Level Post-Dialysis SBP Categories (Fully-Adjusted)
(B) Mortality by Facility-Level Post-Dialysis SBP Categories (Fully-Adjusted)
n=24,303 HD patients from 915 facilities in DOPPS I–III with ESRD duration >180 days, excluding patients with post-dialysis SBP <100 mm Hg. Cox models are as described for Figure 3.
Patterns of associations with survival were comparable to those for pre-dialysis SBP, but the lowest risk levels were (as expected) shifted lower than for pre-dialysis SBP. For patient-level SBP, mortality risk was elevated for patients with low (<110 or 120 mm Hg) but not high SBP levels. For facility-level SBP, mortality risk was lowest at 120–139 mm Hg.
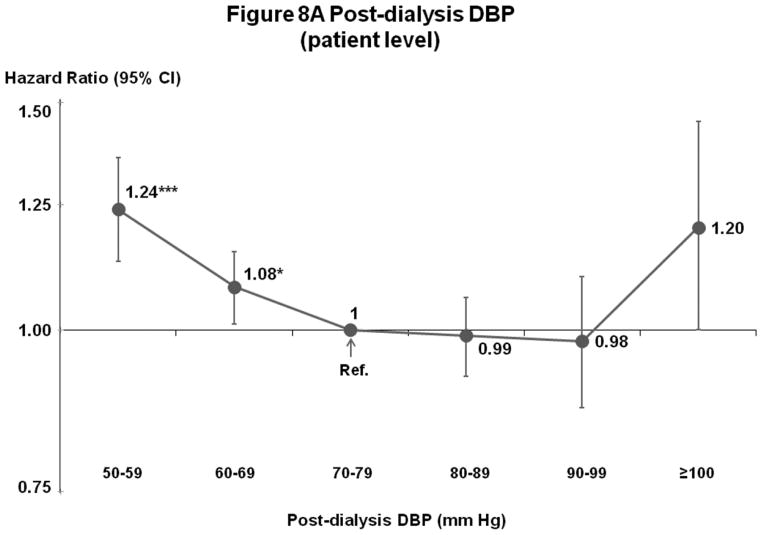
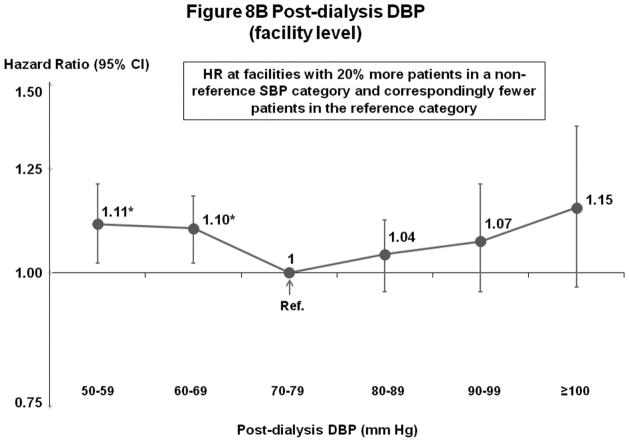
Post-Dialysis DBP (Figures 8A–B)
Figure 8.
(A) Mortality by Patient-Level Post-Dialysis DBP Categories (Fully-Adjusted)
(B) Mortality by Facility-Level Post-Dialysis DBP Categories (Fully-Adjusted)
n=24,805 HD patients from 911 facilities in DOPPS I–III with ESRD duration >180 days, excluding patients with post-dialysis DBP <50 mm Hg. Cox models are as described for Figure 3.
Mortality risk was lowest at 70–99 mm Hg (patient-level) and 70–89 or 70–99 mm Hg (facility-level).
Subgroup Analyses
Subgroups studied were: with or without heart failure, diabetes, and cardiovascular disease; serum albumin < or ≥3.8 g/dL; ESRD duration < or ≥180 days; or use of any anti-hypertensive medication (yes/no). Findings were consistent across subgroups for analyses of patient-level and facility-level SBP.
Change in BP from Before to After Dialysis
Distribution of change in SBP from before to after dialysis (pre- minus post-) was: 25th percentile=0 mm Hg, 50th percentile=11 mm Hg, 75th percentile=25 mm Hg. Associations of SBP with mortality were similar for patients with change in SBP above versus below median value (12 mm Hg) in both patient- and facility-level models. No interaction effect was found between predialysis SBP and change in SBP (pre- to post-HD) in patient- or facility-level model (p>0.05).
Discussion
The finding (Figure 3A) of elevated mortality for HD patients with pre-dialysis SBP <130 mm Hg, but not for patients with uncontrolled HTN, is consistent with most prior observational findings of elevated mortality rates at low, not high, BP. Interpretation of results from observational studies has been complicated because BP level among HD patients tends to be correlated with confounders (Table 1). This imbalance in health status may potentially bias the association between BP and death rates.5 The Dialysis Outcomes and Practice Patterns Study (DOPPS) collects an extensive list of comorbidities, laboratory values, medications, and clinical events, and our multivariable analyses adjust for numerous potential confounders. Nonetheless, as this analysis relies exclusively on measured patient-level data, it remains subject to bias due to unmeasured patient characteristics affecting BP and health status (i.e., unmeasured confounders), Some examples of information typically not captured completely in the medical records (and therefore not in our analyses) include information about the severity, chronicity, disability, functional status, and psychosocial impact of diagnosed comorbidities, and the patient’s ability to cope with ESRD and other conditions. In general, predicting the direction of bias from hypothetical confounders such as these is difficult.14
To potentially lessen bias due to unmeasured patient characteristics, we chose analysis of practice patterns at the dialysis facility level, relating patient-level mortality to the fraction of patients in each BP category at each dialysis facility, rather than observed BP level for each patient. This approach is a straightforward extension of the single grouped-treatment method.15 In their results, Johnston et al noted that the bias resulting from grouped treatment appears to be much smaller than that resulting from standard analyses using individual treatment variables. Our analysis avoids ‘ecologic bias’16,17 because it incorporates patient-level outcome and covariate data. The method also has similarities to IV analysis (and we performed a supplementary IV analysis that corroborated the facility-level BP findings).18–23 Recent applications of IV analysis in clinical medicine have been published.24–29
Our analytic approach takes advantage of the ‘quasi-random’ assignment of patients to different treatment strategies at different facilities, based on the reasonable assumption that differences in observed BP levels between facilities are due in part to differences in provider BP treatment protocols or preferences. In support of the validity of this assumption, we observed large variation between facilities in the percentage of patients at high and low SBP levels (Figure 1B). We also found that facility target SBP is associated with patient-level SBP (in a subset of DOPPS III facilities with these data available, p=0.003), i.e., that provider preference influences achieved BP levels. Additionally, we observed that patient health status is more nearly, albeit imperfectly, balanced when we categorize patients according to a facility-level measure of achieved BP levels (e.g., fraction of patients at SBP ≥160 mm Hg) versus according to each patient’s individually-achieved BP (Supplemental Table A).
We found that, on average, patients treated at facilities with a higher proportion of patients at pre-dialysis SBP 130–159 mm Hg have longer survival. A causal interpretation of this association (based on motivation for the analysis of facility practice) is that treatment to pre-dialysis SBP 130–159 mm Hg leads to longer survival. However, as in any clinical study, the potential for alternative explanations merits consideration.
In particular, the observed differences in survival according to facility-level BP may be due to other differences between facilities (e.g., a “good/bad facility” effect). Our analysis controls for facility achievement of widely-accepted (KDOQI) CPGs (Figure 3B), so the observed association is not explained by achievement of these metrics of good practice. Nonetheless, we cannot rule out facility-level confounding (i.e., unmeasured or incompletely specified facility-level variables that can influence both BP levels and mortality) as an alternative explanation for our findings. Stated in clinical terms, better survival in facilities with more patients at pre-dialysis SBP 130–159 mm Hg may not be due to BP control, but instead to other practices more common in these facilities that we did not account for analytically. Examples include specific BP treatments, achievement of other ‘standard of care’ clinical practices, or generally higher quality care that may occur in facilities with more patients in the SBP 130–159 mm Hg range. Future studies to confirm or refute this possibility are indicated.
In the absence of definitive clinical trial data, our findings help clarify understanding of optimal BP on dialysis. At high BP, facilities with more patients at pre-dialysis SBP ≥160 mm Hg have elevated mortality. This finding (assuming a causal interpretation) contrasts with other observational studies in HD reporting no increased mortality at elevated pre-dialysis SBP in this range or higher.5,8–13 It is consistent with well-established associations between HTN and mortality in the general population,1–3 and with recent studies challenging the notion that there is no association between HTN and adverse outcomes among HD patients.30–34 Two meta-analyses of small clinical trials found that treatment with anti-hypertensive medications was associated with longer survival and fewer CV events.31,34 In contrast to our study, meta-analyses investigated anti-hypertensive medication use, not BP levels, although one study reported that the association between medication use and better outcomes was stronger among patients with HTN.
At low BP, this analysis found higher mortality among patients with SBP <130 mm Hg, and at facilities with more patients at SBP <130 mm Hg. The finding of elevated risk at low BP is consistent with prior observational analyses of HD patient; several possible explanations merit discussion. First, could excess mortality at low BP be due to patient health status alone? It is unlikely, as adjustment for comorbidities (such as coronary heart disease and heart failure) had little effect on associations between SBP and mortality at the low SBP end (Figures 5A–B). Analysis of facility BP practice further reduces the likelihood that excess mortality at low BP levels is due to unmeasured patient characteristics (such as illness severity).
Instead, our findings support the possibility that low pre-dialysis SBP may cause mortality. Management of hemodynamic status in dialysis patients has unique considerations, and treatment of some HD patients to the general population’s optimal BP range may be dangerous. One likely reason is hemodynamic instability during HD sessions. Recent publications demonstrated cardiac regional wall motion abnormalities and impaired myocardial blood flow during dialysis by cardiac PET scan.35,36 These findings add to historical observations of ST segment abnormalities on EKG monitoring and elevations of troponin during HD. Repeated intradialytic ischemia, often subclinical, leads to myocardial stunning and hibernation, which can cause remodeling, scarring, heart failure and arrhythmias, increasingly recognized as important causes of death in HD patients.37,38 In the current study, the association of low pre-dialysis SBP with elevated mortality was not modified by change in SBP from before to after dialysis, but this variable may be insensitive to intradialytic hypotension or hemodynamic compromise during dialysis. Although our study did not collect data on intradialytic BP levels, another study of 1244 patients showed that intradialytic hypotension associated strongly with elevated mortality risk over 2 years.39
The optimal pre-dialysis BP range (130 to 159 mm Hg) may be higher than expected because it represents the peak of the 48- to 72-hour dialysis cycle and overestimates the average BP. This is supported by our analyses identifying lowest risk post-dialysis SBP (Figures 7A–B) 10–20 mm Hg lower than for pre-dialysis SBP (Figures 3A–B). A recent study found an average inter-dialytic increase in SBP of 13 mm Hg by ambulatory BP monitoring and 18 mm Hg by standard home BP monitoring.40 Additionally, clinicians often instruct HD patients to withhold pre-dialysis doses of antihypertensive medications. This practice would exacerbate overestimation of optimal BP caused by relying on pre-dialysis measurement.
The finding of a lower-limit optimal SBP value is consistent with recent data in non-dialysis populations. The ACCORD study, a clinical trial of patients with type 2 diabetes at high cardiovascular risk, found that targeting SBP <120 mm Hg versus <140 mm Hg (achieved SBP 119 vs. 134 mm Hg) did not reduce composite fatal and nonfatal major cardiovascular events.41 In 2009, the European Society of Hypertension raised concerns that excessive BP-lowering may increase the rate of coronary events in patients at high cardiovascular risk, possibly due to impairment of autoregulatory mechanisms that ensure organ perfusion.42 They recommended target SBP 130–139 mm Hg rather than a single cut-point value for higher risk patients receiving antihypertensive therapy.
Our findings indicate management of DBP may be less important than SBP. Risk for DBP in the adjusted model (Figure 4) was lowest at 60–99 mm Hg, i.e., across the range of commonly-observed DBP levels. Only 14% of patients had pre-dialysis DBP outside the range; 53% of patients had pre-dialysis SBP outside the lowest-risk 130–159 mm Hg. Thus, the opportunity for improving outcomes by modifying current practice is greater for SBP. Adjustment for demographics (especially age) and comorbidities had greater effect on the association with outcomes for patient-level DBP than SBP (Figures 5A and 6A). Ventricular stiffness in older patients and in hypertrophic cardiomyopathy (common among dialysis patients)43 may explain much of the association of low DBP with elevated mortality.
Additionally: (1) Because the DOPPS patient sample is a random cross-section of patients at participating HD units, this study’s findings can be generalized to the variety of patients seen and BP management decisions encountered on rounds in the dialysis unit. (2) The study informs mortality risks over the entire BP range in dialysis patients, unlike a randomized controlled trial. (3) Our findings based on observed facility-level BP values inform understanding of the association between target BP and outcomes to the extent that variations in facility-aggregated observed BP reflect differences between facility BP targets. (4) Our study is not intended to compare specific treatments (e.g., volume management and/or pharmacotherapy) for BP management.31,32,34,44 (5) Lastly, we studied BP levels measured in the dialysis center to inform current practice for most HD patients. Inter-dialytic BP monitoring has promise as a future treatment target, but its practice is uncommon and may not be feasible in many patients.45–48
Conclusion
Survival is significantly better among patients with pre-dialysis SBP ≥130 mm Hg, and at facilities with more patients at pre-dialysis SBP 130 to <160 mm Hg. Opportunities for improving outcomes may be greater for treatment of SBP than DBP. The finding of elevated mortality among facilities with more patients at high SBP, if indicative of a causal link between HTN and poor outcomes, clarifies apparently contradictory results from prior observational studies in HD patients versus clinical trials in the general population. Elevated mortality at low SBP, in both our patient and facility BP models, is consistent with prior studies of dialysis patients and emerging concerns about excessive BP lowering in non-dialysis patients at high CV risk. It corroborates accumulating evidence from clinical studies in dialysis that myocardial stunning, associated with intradialytic hypotension, may be common and is likely harmful. While additional investigation is indicated, these findings contrast with opinion-based KDOQI BP targets, providing guidance on optimal BP range in the absence of definitive clinical trial data in the near future.
Methods
Data Source & Study Patients
The DOPPS is a prospective cohort study of HD treatment and patient outcomes. Study sampling plan and methods have been described.49,50 Data were from DOPPS I (1996–2001), II (2002–2004), and III (2005–2008). There were 38,511 adult (≥18 years of age) HD patients with pre-dialysis SBP measurement reported at study entry, randomly selected from 928 dialysis facilities: 308 facilities in DOPPS I (n=15,473 patients from France, Germany, Italy, Japan, Spain, United Kingdom, and United States), 321 facilities in DOPPS II (n=12,311 patients from DOPPS I countries, plus Australia, Belgium, Canada, New Zealand, and Sweden) and 299 facilities in DOPPS III (n=10,727 patients from the same 12 countries). Detailed case-mix and comorbid data were collected for each patient at study entry. Longitudinal laboratory values, medication data, and cause-specific mortality events were collected during study follow-up. Informed patient consent was obtained as indicated in accordance with local requirements.
For primary analyses, patients with pre-dialysis SBP <110 mm Hg were excluded on the rationale that low SBP is generally due to substantial comorbid illness, i.e., SBP is not treated to this level and is not reflective of provider practice. A sensitivity analysis including patients with SBP <110 mm Hg is presented. Patients from 6 facilities with fewer than 7 patients with recorded BP levels were excluded. For primary analyses of prevalent HD patients, 25,907 patients from 922 facilities had ESRD >180 days at DOPPS enrollment. Of these, 24,525 patients from 920 dialysis facilities had pre-dialysis SBP ≥110 mm Hg at study entry (used for primary analyses). The 10th, 50th, and 90th percentiles for number of patients per facility were 17, 26, and 37.
Outcomes and Exposures
The primary outcome was mortality. In Cox regression models, time at-risk was from study entry until death; study departure due to kidney transplant, change in dialysis modality, or transfer to another facility; or the end-of-study follow-up.
In DOPPS I and II, the 3 most recent BP measurements over 1 week on or before study enrollment were reported; the median value was used. In DOPPS III, only the most recent measurement was reported. The primary exposure was pre-dialysis (i.e., measured in HD unit prior to the start of a dialysis session) SBP level at DOPPS enrollment (“baseline”). For analyses of patient-level SBP, patients were classified into 7 × 10 mm Hg SBP groups, from 110–119 to 170–179 mm Hg, and ≥180 mm Hg (with each patient in one of 7 SBP categories). For analyses of facility-level SBP, we created 7 continuous variables representing the proportion of patients in each facility that were in each of the 7 SBP categories. The 7 facility-level variables were assigned to all patients in that facility. Based on results with 7 categories, we performed additional analyses with pre-dialysis SBP levels divided into 3 categories: 110–129, 130–159, and ≥160 mm Hg. Associations of pre-dialysis DBP, post-dialysis SBP, and post-dialysis DBP with mortality are also presented.
Statistical Analysis
Distributions of patient-level and facility-level pre-dialysis SBP and DBP were depicted graphically. To examine cross-sectional associations of baseline patient characteristics with patient-level and facility-level SBP, separate linear mixed and logistic models with patient baseline characteristic as outcome and an ordinal variable of BP category as predictor were used.
Cox regression was used to assess the association between all-cause mortality (patient-level) and exposure variables: (1) patient-level SBP at baseline (each patient in one of 7 SBP categories) and (2) facility-level SBP (the proportion of facility patients in each SBP category for all patients in the facility). The facility-level approach is an extension of the single grouped-treatment method.15 Only 6 of 7 facility-level SBP categories (excluding 130–139 mm Hg) were included to avoid linear dependence (i.e., 6 proportions do not add up to 1). Facility-level results were reported as HRs at facilities with 20% more patients in a non-reference SBP category, and correspondingly fewer patients in the reference category. We divide both coefficient and standard error of the Cox regression in the facility-level analysis by a factor of five to obtain the magnitude of the association corresponding to every 20% of facility patients, but the significance level and qualitative interpretation of the results stay unchanged (whether reported for 20% or, for example, 10% or 100% of facility patients).
Cox models were stratified by geographic region and study phase, accounted for facility-clustering effects, and adjusted sequentially for potentially-confounding variables (Table 1). Facility-level analyses were further adjusted for 5 facility practices, including percent of patients in guidelines for hemoglobin, serum albumin, serum phosphorous, single pool Kt/V, and percent of patients using a catheter for dialysis. Robust variance estimates (sandwich estimator) were used to account for facility-level clustering.46 Proportionality of hazards was confirmed graphically and by an interaction term between each covariate and log-transformed follow-up time. For missing data, missing indicators were used. In confirmatory analyses, multiple imputation of missing data was performed using IVEware, and mortality analyses were repeated using the imputed data.
In support of analyses of facility-level BP, supplemental analyses used instrumental variable analysis with facility indictors as the instrument.18,19,51,52 A linear-Cox IV approach was used, with similarities to the traditional two-stage least-square IV method, using a linear approximation in the first stage and Cox regression in the second stage.24,25,53 Analyses used SAS 9.2 (SAS Institute, Cary, NC). The authors followed STROBE Statement guidelines for reporting observational studies.54
Supplementary Material
Acknowledgments
This study was presented in part at the annual meeting of the American Society of Nephrologists; November 4 through 9, 2008; Philadelphia, PA; and has appeared in abstract form (J Am Soc Nephrol 19: 281A, 2008).
The authors gratefully acknowledge Heather Van Doren, MFA, of Arbor Research Collaborative for Health, for assistance with editing and manuscript preparation.
Footnotes
Supplementary information is available at Kidney International’s website.
Disclosure
The DOPPS is administered by Arbor Research Collaborative for Health and is supported by scientific research grants from Amgen (since 1996), Kyowa Hakko Kirin (since 1999, in Japan), Genzyme (since 2009), and Abbott (since 2009), without restrictions on publications.
Dr. Akizawa receives consulting fees from Chugai, Kirin, and Abbott; grants/funds from Chugai and Kirin.
Dr. Kerr is on clinical advisory boards for Amgen, Fresenius, and Baxter.
References
- 1.Ezzati M, Lopez AD, Rodgers A, et al. Selected major risk factors and global and regional burden of disease. Lancet. 2002;360:1347–1360. doi: 10.1016/S0140-6736(02)11403-6. [DOI] [PubMed] [Google Scholar]
- 2.Kearney PM, Whelton M, Reynolds K, et al. Global burden of hypertension: analysis of worldwide data. Lancet. 2005;365:217–223. doi: 10.1016/S0140-6736(05)17741-1. [DOI] [PubMed] [Google Scholar]
- 3.Chobanian AV, Bakris GL, Black HR, et al. The Seventh Report of the Joint National Committee on Prevention, Detection, Evaluation, and Treatment of High Blood Pressure: the JNC 7 report. JAMA. 2003;289:2560–2572. doi: 10.1001/jama.289.19.2560. [DOI] [PubMed] [Google Scholar]
- 4.U.S. Renal Data System. USRDS 2009 Annual Data Report: Atlas of chronic kidney disease and end-stage renal disease in the United States. Bethesda, MD: National Institutes of Health, National Institute of Diabetes and Digestive Disease and Kidney Diseases; 2009. [Google Scholar]
- 5.K/DOQI clinical practice guidelines for cardiovascular disease in dialysis patients. Am J Kidney Dis. 2005;45:S1–153. [PubMed] [Google Scholar]
- 6.UK Renal Registry of the Renal Association. 2007. UK Renal Registry Report 2007. [Google Scholar]
- 7.Agarwal R, Nissenson AR, Batlle D, et al. Prevalence, treatment, and control of hypertension in chronic hemodialysis patients in the United States. Am J Med. 2003;115:291–297. doi: 10.1016/s0002-9343(03)00366-8. [DOI] [PubMed] [Google Scholar]
- 8.Port FK, Hulbert-Shearon TE, Wolfe RA, et al. Predialysis blood pressure and mortality risk in a national sample of maintenance hemodialysis patients. Am J Kidney Dis. 1999;33:507–517. doi: 10.1016/s0272-6386(99)70188-5. [DOI] [PubMed] [Google Scholar]
- 9.Kalantar-Zadeh K, Kilpatrick RD, McAllister CJ, et al. Reverse epidemiology of hypertension and cardiovascular death in the hemodialysis population: the 58th annual fall conference and scientific sessions. Hypertension. 2005;45:811–817. doi: 10.1161/01.HYP.0000154895.18269.67. [DOI] [PubMed] [Google Scholar]
- 10.Li Z, Lacson E, Jr, Lowrie EG, et al. The epidemiology of systolic blood pressure and death risk in hemodialysis patients. Am J Kidney Dis. 2006;48:606–615. doi: 10.1053/j.ajkd.2006.07.005. [DOI] [PubMed] [Google Scholar]
- 11.Zager PG, Nikolic J, Brown RH, et al. “U” curve association of blood pressure and mortality in hemodialysis patients. Medical Directors of Dialysis Clinic, Inc. Kidney Int. 1998;54:561–569. doi: 10.1046/j.1523-1755.1998.00005.x. [DOI] [PubMed] [Google Scholar]
- 12.Lowrie E, Huang WH, Lew NL, et al. The relative contribution of measured variables to death risk among hemodialysis patients. In: Friedman EA, editor. Death on Hemodialysis. Kluwer Academic; Boston: 1994. pp. 121–141. [Google Scholar]
- 13.Besarab A, Bolton WK, Browne JK, et al. The effects of normal as compared with low hematocrit values in patients with cardiac disease who are receiving hemodialysis and epoetin. N Engl J Med. 1998;339:584–590. doi: 10.1056/NEJM199808273390903. [DOI] [PubMed] [Google Scholar]
- 14.Rothman KJ, Greenland S, Lash TL. Modern Epidemiology. 3. Lippincott, Williams & Wilkins; Philadelphia: 2008. Analysis of Uncontrolled Confounding; pp. 365–370. [Google Scholar]
- 15.Johnston SC, Henneman T, McCulloch CE, et al. Modeling treatment effects on binary outcomes with grouped-treatment variables and individual covariates. Am J Epidemiol. 2002;156:753–760. doi: 10.1093/aje/kwf095. [DOI] [PubMed] [Google Scholar]
- 16.Johnston SC. Combining ecological and individual variables to reduce confounding by indication: case study--subarachnoid hemorrhage treatment. J Clin Epidemiol. 2000;53:1236–1241. doi: 10.1016/s0895-4356(00)00251-1. [DOI] [PubMed] [Google Scholar]
- 17.Morgenstern H. Ecologic studies. In: Rothman KJ, Greenland S, Lash TL, editors. Modern Epidemiology. 3. Lippincott Williams & Wilkins; Philadelphia: 2008. pp. 511–531. [Google Scholar]
- 18.Angrist JD, Imbens GW, Rubin DB. Identification of causal effects using instrumental variables. Journal of the American Statistical Association. 1996;91:444–455. [Google Scholar]
- 19.Newhouse JP, McClellan M. Econometrics in outcomes research: the use of instrumental variables. Annu Rev Public Health. 1998;19:17–34. doi: 10.1146/annurev.publhealth.19.1.17. [DOI] [PubMed] [Google Scholar]
- 20.Johnston J, DiNardo J. Econometric methods. 4. McGraw-Hill; New York: 1997. p. xviii.p. 531. [Google Scholar]
- 21.Brookhart MA, Rassen JA, Wang PS, et al. Evaluating the validity of an instrumental variable study of neuroleptics: can between-physician differences in prescribing patterns be used to estimate treatment effects? Med Care. 2007;45:S116–122. doi: 10.1097/MLR.0b013e318070c057. [DOI] [PubMed] [Google Scholar]
- 22.Martens EP, Pestman WR, de Boer A, et al. Instrumental variables: application and limitations. Epidemiology. 2006;17:260–267. doi: 10.1097/01.ede.0000215160.88317.cb. [DOI] [PubMed] [Google Scholar]
- 23.Judge GG, Hill RC, Griffiths WE, et al. Introduction to the Theory and Practice of Econometrics. 2. John Wiley & Sons, Inc; 1982. [Google Scholar]
- 24.Tentori F, Albert JM, Young EW, et al. The survival advantage for haemodialysis patients taking vitamin D is questioned: findings from the Dialysis Outcomes and Practice Patterns Study. Nephrol Dial Transplant. 2009;24:963–972. doi: 10.1093/ndt/gfn592. [DOI] [PubMed] [Google Scholar]
- 25.Ramirez SP, Albert JM, Blayney MJ, et al. Rosiglitazone is associated with mortality in chronic hemodialysis patients. J Am Soc Nephrol. 2009;20:1094–1101. doi: 10.1681/ASN.2008060579. [DOI] [PMC free article] [PubMed] [Google Scholar]
- 26.Brookhart MA, Wang PS, Solomon DH, et al. Evaluating short-term drug effects using a physician-specific prescribing preference as an instrumental variable. Epidemiology. 2006;17:268–275. doi: 10.1097/01.ede.0000193606.58671.c5. [DOI] [PMC free article] [PubMed] [Google Scholar]
- 27.Stukel TA, Fisher ES, Wennberg DE, et al. Analysis of observational studies in the presence of treatment selection bias: effects of invasive cardiac management on AMI survival using propensity score and instrumental variable methods. JAMA. 2007;297:278–285. doi: 10.1001/jama.297.3.278. [DOI] [PMC free article] [PubMed] [Google Scholar]
- 28.Bradbury BD, Do TP, Winkelmayer WC, et al. Greater Epoetin alfa (EPO) doses and short-term mortality risk among hemodialysis patients with hemoglobin levels less than 11 g/dL. Pharmacoepidemiol Drug Saf. 2009;18:932–940. doi: 10.1002/pds.1799. [DOI] [PubMed] [Google Scholar]
- 29.Brookhart MA, Schneeweiss S, Avorn J, et al. Comparative mortality risk of anemia management practices in incident hemodialysis patients. JAMA. 2010;303:857–864. doi: 10.1001/jama.2010.206. [DOI] [PubMed] [Google Scholar]
- 30.Stidley CA, Hunt WC, Tentori F, et al. Changing relationship of blood pressure with mortality over time among hemodialysis patients. J Am Soc Nephrol. 2006;17:513–520. doi: 10.1681/ASN.2004110921. [DOI] [PubMed] [Google Scholar]
- 31.Agarwal R, Sinha AD. Cardiovascular protection with antihypertensive drugs in dialysis patients: systematic review and meta-analysis. Hypertension. 2009;53:860–866. doi: 10.1161/HYPERTENSIONAHA.108.128116. [DOI] [PMC free article] [PubMed] [Google Scholar]
- 32.Wizemann V, Wabel P, Chamney P, et al. The mortality risk of overhydration in haemodialysis patients. Nephrol Dial Transplant. 2009;24:1574–1579. doi: 10.1093/ndt/gfn707. [DOI] [PMC free article] [PubMed] [Google Scholar]
- 33.Foley RN, Parfrey PS, Harnett JD, et al. Impact of hypertension on cardiomyopathy, morbidity and mortality in end-stage renal disease. Kidney Int. 1996;49:1379–1385. doi: 10.1038/ki.1996.194. [DOI] [PubMed] [Google Scholar]
- 34.Heerspink HJ, Ninomiya T, Zoungas S, et al. Effect of lowering blood pressure on cardiovascular events and mortality in patients on dialysis: a systematic review and meta-analysis of randomised controlled trials. Lancet. 2009;373:1009–1015. doi: 10.1016/S0140-6736(09)60212-9. [DOI] [PMC free article] [PubMed] [Google Scholar]
- 35.McIntyre CW, Burton JO, Selby NM, et al. Hemodialysis-induced cardiac dysfunction is associated with an acute reduction in global and segmental myocardial blood flow. Clin J Am Soc Nephrol. 2008;3:19–26. doi: 10.2215/CJN.03170707. [DOI] [PMC free article] [PubMed] [Google Scholar]
- 36.Dasselaar JJ, Slart RH, Knip M, et al. Haemodialysis is associated with a pronounced fall in myocardial perfusion. Nephrol Dial Transplant. 2009;24:604–610. doi: 10.1093/ndt/gfn501. [DOI] [PubMed] [Google Scholar]
- 37.McIntyre CW. Effects of hemodialysis on cardiac function. Kidney Int. 2009;76:371–375. doi: 10.1038/ki.2009.207. [DOI] [PubMed] [Google Scholar]
- 38.Burton JO, Jefferies HJ, Selby NM, et al. Hemodialysis-induced cardiac injury: determinants and associated outcomes. Clin J Am Soc Nephrol. 2009;4:914–920. doi: 10.2215/CJN.03900808. [DOI] [PMC free article] [PubMed] [Google Scholar]
- 39.Shoji T, Tsubakihara Y, Fujii M, et al. Hemodialysis-associated hypotension as an independent risk factor for two-year mortality in hemodialysis patients. Kidney Int. 2004;66:1212–1220. doi: 10.1111/j.1523-1755.2004.00812.x. [DOI] [PubMed] [Google Scholar]
- 40.Agarwal R, Light RP. Chronobiology of arterial hypertension in hemodialysis patients: implications for home blood pressure monitoring. Am J Kidney Dis. 2009;54:693–701. doi: 10.1053/j.ajkd.2009.03.018. [DOI] [PMC free article] [PubMed] [Google Scholar]
- 41.Cushman WC, Evans GW, Byington RP, et al. Effects of intensive blood-pressure control in type 2 diabetes mellitus. N Engl J Med. 2010;362:1575–1585. doi: 10.1056/NEJMoa1001286. [DOI] [PMC free article] [PubMed] [Google Scholar]
- 42.Mancia G, Laurent S, Agabiti-Rosei E, et al. Reappraisal of European guidelines on hypertension management: a European Society of Hypertension Task Force document. J Hypertens. 2009 doi: 10.1097/HJH.0b013e328333146d. [DOI] [PubMed] [Google Scholar]
- 43.Glassock RJ, Pecoits-Filho R, Barberato SH. Left ventricular mass in chronic kidney disease and ESRD. Clin J Am Soc Nephrol. 2009;4 (Suppl 1):S79–91. doi: 10.2215/CJN.04860709. [DOI] [PubMed] [Google Scholar]
- 44.Agarwal R, Alborzi P, Satyan S, et al. Dry-weight reduction in hypertensive hemodialysis patients (DRIP): a randomized, controlled trial. Hypertension. 2009;53:500–507. doi: 10.1161/HYPERTENSIONAHA.108.125674. [DOI] [PMC free article] [PubMed] [Google Scholar]
- 45.Agarwal R, Peixoto AJ, Santos SF, et al. Pre- and postdialysis blood pressures are imprecise estimates of interdialytic ambulatory blood pressure. Clin J Am Soc Nephrol. 2006;1:389–398. doi: 10.2215/CJN.01891105. [DOI] [PubMed] [Google Scholar]
- 46.Mazzuchi N, Carbonell E, Fernandez-Cean J. Importance of blood pressure control in hemodialysis patient survival. Kidney Int. 2000;58:2147–2154. doi: 10.1111/j.1523-1755.2000.00388.x. [DOI] [PubMed] [Google Scholar]
- 47.Alborzi P, Patel N, Agarwal R. Home blood pressures are of greater prognostic value than hemodialysis unit recordings. Clin J Am Soc Nephrol. 2007;2:1228–1234. doi: 10.2215/CJN.02250507. [DOI] [PubMed] [Google Scholar]
- 48.Levin NW, Kotanko P, Eckardt KU, et al. Blood pressure in chronic kidney disease stage 5D - report from a Kidney Disease: Improving Global Outcomes controversies conference. Kidney Int. 2010;77:273–284. doi: 10.1038/ki.2009.469. [DOI] [PubMed] [Google Scholar]
- 49.Young E, Goodkin D, Mapes D, et al. The Dialysis Outcomes and Practice Patterns Study (DOPPS): an international hemodialysis study. Kidney Int. 2000;57:S74–S81. doi: 10.1046/j.1523-1755.2002.00387.x. [DOI] [PubMed] [Google Scholar]
- 50.Pisoni RL, Gillespie BW, Dickinson DM, et al. The Dialysis Outcomes and Practice Patterns Study (DOPPS): design, data elements, and methodology. Am J Kidney Dis. 2004;44:7–15. doi: 10.1053/j.ajkd.2004.08.005. [DOI] [PubMed] [Google Scholar]
- 51.Wooldridge JM. Introductory Econometrics. (4) 2002;Chapter 15 [Google Scholar]
- 52.Greenland S. An introduction to instrumental variables for epidemiologists. Int J Epidemiol. 2000;29:722–729. doi: 10.1093/ije/29.4.722. [DOI] [PubMed] [Google Scholar]
- 53.Pisoni RL, Arrington CJ, Albert JM, et al. Facility hemodialysis vascular access use and mortality in countries participating in DOPPS: an instrumental variable analysis. Am J Kidney Dis. 2009;53:475–491. doi: 10.1053/j.ajkd.2008.10.043. [DOI] [PubMed] [Google Scholar]
- 54.von Elm E, Altman DG, Egger M, et al. The Strengthening the Reporting of Observational Studies in Epidemiology (STROBE) statement: guidelines for reporting observational studies. Ann Intern Med. 2007;147:573–577. doi: 10.7326/0003-4819-147-8-200710160-00010. [DOI] [PubMed] [Google Scholar]
Associated Data
This section collects any data citations, data availability statements, or supplementary materials included in this article.


