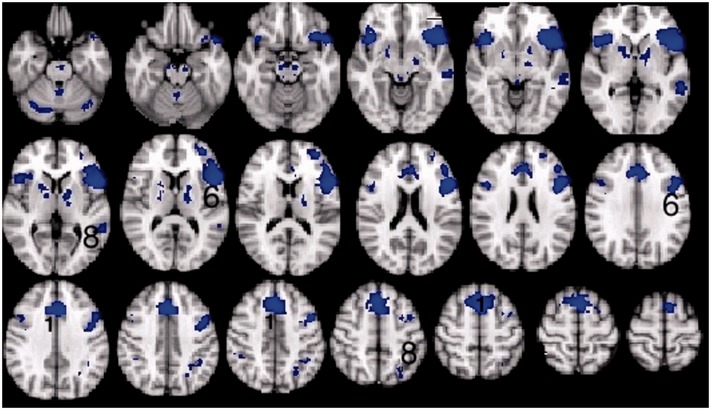
Figure 7.
Thresholded Z statistic images for the contrasts of listening to vocoded stimuli versus listening to normal stimuli in healthy volunteers (mean of both sessions) multiplied by the contrast of listening to normal stimuli versus listening to white noise in patients (mean of sessions 2 and 3). All images are thresholded using clusters determined by Z > 2.3 and a (corrected) cluster significance threshold of P = 0.05. Numbers identify activity within (1) the dACC/SFG and (6) inferior frontal gyrus and adjacent anterior insular cortex, (8) dorsal inferior parietal cortex and adjacent lateral intraparietal sulcus.

