

SUMMARY
Knowledge of hepatitis B and C prevalence, and numbers infected, are important for planning responses. Published HBsAg and anti-HCV prevalences for the 20 WHO European Region countries outside the EU/EFTA were extracted, to complement published data for the EU/EFTA. The general population prevalence of HBsAg (median 3·8%, mean 5·0%, seven countries) ranged from 1·3% (Ukraine) to 13% (Uzbekistan), and anti-HCV (median 2·3%, mean 3·8%, 10 countries) from 0·5% (Serbia, Tajikistan) to 13% (Uzbekistan). People who inject drugs had the highest prevalence of both infections (HBsAg: median 6·8%, mean 8·2%, 13 countries; anti-HCV: median 46%, mean 46%, 17 countries), and prevalence was also elevated in men who have sex with men and sex workers. Simple estimates indicated 13·3 million (1·8%) adults have HBsAg and 15·0 million (2·0%) HCV RNA in the WHO European Region; prevalences were higher outside the EU/EFTA countries. Efforts to prevent, diagnose, and treat these infections need to be maintained and improved.
This article may not be reprinted or reused in any way in order to promote any commercial products or services.
Key words: Epidemiology, European Region, hepatitis B, hepatitis C, prevalence
INTRODUCTION
Infection with the hepatitis B and C viruses (HBV and HCV) causes significant morbidity and mortality. Even though HBV infection can be prevented through vaccination, the World Health Organization (WHO) has estimated that globally around 240 million people are chronically infected [1, 2] with between 500 000 and 700 000 deaths each year [1, 3]. WHO estimates also indicate that 2–3% of the world's population are HCV-infected, equating to 120–170 million people [4]. About 1·0 million people die annually (∼2·7% of all deaths) from causes related to viral hepatitis, most commonly liver disease, including liver cancer [5]. An estimated 57% of liver cirrhosis cases and 78% of primary liver cancers result from HBV or HCV infection [6]. Co-infections with HIV are an increasing problem in countries with HIV epidemics in people who inject drugs (PWID), and in those treated with HIV anti-retrovirals, and underlying viral hepatitis is becoming a major cause of death [5].
Globally there are geographical variations in the extent of both HBV and HCV infection including within Europe [4]. In the European Union (EU) and European Free Trade Association (EFTA) area, prevalence in the general population varies from 0·4% to 5·2% for anti-HCV and from 0·1% to 5·6% for HBsAg [7]. Hepatitis prevalence in the rest of the WHO European Region, mainly eastern Europe and central Asia countries, has not been assessed even though this part of the Region has recently experienced an accelerating HIV epidemic and an increase in the population of PWID [8].
HBV and HCV are bloodborne viruses that are easily transmitted through blood-to-blood contact [2, 9–11]. Parenteral routes, particularly injecting drug use or poor hygiene in clinical settings, are major sources of transmission [2, 9–12]. HBV can also be transmitted sexually, and this route has also been reported for HCV in certain circumstances [10, 13]. Perinatal transmission of both HBV and HCV can also occur [2, 9, 10].
The majority of adults infected with HBV spontaneously resolve their infection and develop protective immunity [11]. Less commonly chronic infection results and, in rare cases, causes potentially fatal acute liver failure [11]. In contrast to HBV, the majority of HCV-infected adults develop chronic disease [14]. Those with chronic infections remain infectious to others and are at risk of developing serious liver disease such as cirrhosis or hepatocellular cancer [15, 16]. The available antiviral treatments for both HBV and HCV infections have increased and become more effective [17, 18]. Treatment may also have a role in prevention through reducing the pool of infectious people [19].
As chronic HBV and HCV infections are largely asymptomatic, many patients who might benefit from treatment remain undetected [20]. Efforts are needed to detect those infected and who would benefit from treatment, so that the costly sequelae of infection can be reduced [21, 22]. To target case-finding it is necessary to know which population groups are most affected; and information on the likely numbers infected is needed for healthcare planning, for example, to assess the cost of providing treatment. Examination of these at a regional level allows comparison of the burden between countries as well as informing international responses.
The aims of this study were to: (a) assess the prevalence of HBV and HCV infection in the WHO European Region countries outside the EU/EFTA through a literature review; (b) generate simple estimates of the numbers living with HBV and HCV infection in these countries, and (c) to compare this burden with that in the rest of the WHO European Region obtained from published data [7].
MATERIALS AND METHODS
Literature review
Studies that had measured HBV and HCV seroprevalence since 2000 were identified through a literature review. To be included, studies had to: (a) have tested a biological sample (self-reports were excluded) to measure prevalence of HBsAg or anti-HCV in a WHO European Region country outside the EU/EFTA area (n = 20, Table 1); (b) do so in one or more of these adult population groups: general population, blood donors, pregnant women, PWID, men who have sex with men (MSM), and sex workers; and (c) have been published from 2000 to 2010 inclusive. Studies not meeting these criteria or reporting sample sizes <100 were excluded.
Table 1.
Number and geographical coverage of studies that had measured the prevalence of hepatitis B surface antigen (HBsAg) or antibodies to the hepatitis C virus (anti-HCV) in each population group by country: countries in the WHO European Region outside EU/EFTA
| (a) General population and blood donors | ||||||||
|---|---|---|---|---|---|---|---|---|
| Country | General population | Blood donors | ||||||
| HBsAg | Anti-HCV | HBsAg | Anti-HCV | |||||
| No. of studies | Coverage of studies | No. of studies | Coverage of studies | No. of studies | Coverage of studies | No. of studies | Coverage of studies | |
| Albania | 3 | National (x2), 1 city/area | 1 | 1 city/area | 2 | 1 city/area, n.s. | 2 | 1 city/area, n.s. |
| Armenia | 0 | 0 | 0 | 0 | ||||
| Azerbaijan | 0 | 0 | 0 | 0 | ||||
| Belarus | 0 | 0 | 0 | 0 | ||||
| Bosnia & Herzegovina | 0 | 0 | 1 | National | 2 | National, 1 city/area | ||
| Croatia | 0 | 0 | 1 | National | 1 | National | ||
| Georgia | 0 | 1 | 1 city/area | 0 | 0 | |||
| Israel | 0 | 0 | 1 | National | 1 | National | ||
| Kazakhstan | 1 | 1 city/area | 2 | National, 1 city/area | 1 | National | 0 | |
| Kyrgyzstan | 0 | 1 | 2 cities/areas | 0 | 0 | |||
| Montenegro | 0 | 0 | 1 | National | 1 | National | ||
| Republic of Moldova | 0 | 0 | 0 | 0 | ||||
| Russian Federation | 2 | ?National, 1 city/area | 2 | ?National, 1 city/area | 1 | 1 city/area | 1 | 1 city/area |
| Serbia (incl. Kosovo*) | 1 | 1 city/area | 1 | 1 city/area | 1 | 1 city/area | 1 | 1 city/area |
| Tajikistan | 0 | 1 | Multi-site | 1 | National | 1 | National | |
| The former Yugoslav Republic of Macedonia | 0 | 0 | 1 | 1 city/area | 1 | 1 city/area | ||
| Turkey | 9 | Multi-site (x2), 1 city/area (x7) | 7 | Multi-site, 1 city/area (x6) | 3 | National, 1 city/area (x2) | 3 | National, 1 city/area (x2) |
| Turkmenistan | 0 | 0 | 0 | 0 | ||||
| Ukraine | 4 | Unclear | 3 | Unclear | 3 | Unclear | 2 | Unclear |
| Uzbekistan | 1 | Multisite | 1 | Multisite | 1 | Multisite | 2 | Multisite |
| Total | 21 | 20 | 18 | 18 | ||||
| (b) People who injecting drugs (PWID) | ||||
|---|---|---|---|---|
| PWID | ||||
| HBsAg | Anti-HCV | |||
| No. ofstudies | Coverage of studies | No. of studies | Coverage of studies | |
| Albania | 1 | 1 city/area | 2 | 1 city/area |
| Armenia | 0 | 0 | ||
| Azerbaijan | 1 | Multi-site | 2 | Multi-site, 2 cities/areas |
| Belarus | 1 | Multi-site | 2 | Multi-site, 1 city/area |
| Bosnia & Herzegovina | 2 | Multi-site | 2 | Multi-site |
| Croatia | 3 | National multi-site, 1 city/area | 3 | National, multi-site, 1 city/area |
| Georgia | 3 | 1 city/area | 4 | Multi-site, 1 city/area (x3) |
| Israel | 1 | National | 1 | National |
| Kazakhstan | 1 | 2 cities/areas | 2 | National, 2 cities/areas |
| Kyrgyzstan | 0 | 2 | Multi-site, 2 cities/areas | |
| Montenegro | 1 | Unclear | 2 | 1 city/area, unclear |
| Republic of Moldova | 1 | National | 1 | National |
| Russian Federation | 2 | 2 cities/areas, 1 city/area | 16 | Multi-site (x2), 1 city/area (x12), unclear (x2) |
| Serbia (incl. Kosovo*) | 1 | 1 city/area | 3 | Multi-site, 1 city/area (x2) |
| Tajikistan | 0 | 2 | Multi-site, 1 city/area | |
| The former Yugoslav Republic of Macedonia | 0 | 0 | ||
| Turkey | 1 | Multi-site | 1 | 1 city/area |
| Turkmenistan | 0 | 0 | ||
| Ukraine | 3 | 1 city/area (x1), unclear (x2) | 6 | 1 city/area (x4), unclear (x2) |
| Uzbekistan | 0 | 2 | National multi-site | |
| Total | 22 | 53 | ||
| (c) Men who have sex with men (MSM) and sex workers | ||||||||
|---|---|---|---|---|---|---|---|---|
| MSM | Sex workers | |||||||
| HBsAg | Anti-HCV | HBsAg | Anti-HCV | |||||
| No. of studies | Coverage of studies | No. of studies | Coverage of studies | No. of studies | Coverage of studies | No. of studies | Coverage of studies | |
| Albania | 1 | 1 city/area | 0 | 0 | 0 | |||
| Armenia | 0 | 0 | 0 | 0 | ||||
| Azerbaijan | 1 | 1 city/area | 1 | 1 city/area | 1 | Multi-site | 1 | Multi-site |
| Belarus | 0 | 0 | 0 | 0 | ||||
| Bosnia & Herzegovina | 1 | National | 1 | National | 1 | National | 1 | National |
| Croatia | 1 | 1 city/area | 2 | 1 city/area, national | 0 | 1 | National | |
| Georgia | 1 | 1 city/area | 1 | 1 city/area | 0 | 0 | ||
| Israel | 0 | 0 | 0 | 0 | ||||
| Kazakhstan | 0 | 1 | National | 0 | 1 | National | ||
| Kyrgyzstan | 0 | 1 | National | 0 | 3 | National multi-site, 1 city/area | ||
| Montenegro | 0 | 0 | 0 | 0 | ||||
| Republic of Moldova | 0 | 1 | 1 city/area | 0 | 1 | 1 city/area | ||
| Russian Federation | 0 | 1 | 2 cities/areas | 0 | 3 | Multi-site, 1 city/area (x2) | ||
| Serbia (incl. Kosovo*) | 1 | 1 city/area | 1 | 1 city/area | 1 | 1 city/area | 1 | 1 city/area |
| Tajikistan | 0 | 0 | 0 | 1 | National | |||
| The former Yugoslav Republic of Macedonia | 0 | 0 | 0 | 0 | ||||
| Turkey | 1 | Multi-site | 0 | 2 | Multi-site, 1 city/area | 1 | 1 city/area | |
| Turkmenistan | 0 | 0 | 0 | 0 | ||||
| Ukraine | 1 | Unclear | 1 | Unclear | 1 | Unclear | 1 | Unclear |
| Uzbekistan | 0 | 0 | 0 | 2 | Multi-site, 1 city/area | |||
| Total | 8 | 11 | 6 | 17 | ||||
EU/EFTA, European Union and European Free Trade Association area; n.s., not stated.; ‘?’, preceding a detail indicates that the information available on this item in the source was limited.
According to United Nations Security Council Resolution 1244 (1999).
Medline and EMBASE were searched for studies on the prevalence of HBV and HCV (see Supplementary online material for search terms). The grey literature were indentified through searches of documents held by the WHO Regional Office for Europe, the European Monitoring Centre for Drugs and Drug Addition (EMCDDA) website, and the sources identified in a systematic review on HIV in the WHO European Region – which had systematically collected data on seroprevalence studies (including those with a focus on viral hepatitis) [8]. Bibliographies were checked for further sources. The titles and abstracts were first reviewed to identify relevant publication (in English or Russian), the full text was then assessed for inclusion and data extracted (including secondary reports). Data relating to screening of first-time blood donors was obtained from the Council of Europe report [23].
The prevalences in pregnant women were combined with the general population data. The nature of this population, women of child-bearing age, could mean that the prevalence might not reflect that overall in the general population, particularly if prevalence differs by gender or age, or if fertility rates are higher in migrant groups with higher prevalences; however, we have assumed that such differences are likely to be small overall. Prevalence in first-time blood donors was not combined with the general population data, as blood donors are a highly select group. In most countries those who may have been at risk of infection with bloodborne viruses are excluded from giving blood, thus blood donors are usually likely to be at lower risk overall than the general population.
A ‘selected prevalence’ estimate in the general population was obtained for each country using the algorithm in Table 2. This was applied to other groups if sufficient studies were identified.
Table 2.
Algorithm used to select a national prevalence
| Prevalences were selected using the following hierarchy: |
| (1) National studies. |
| (2) Studies with multiple sites across the country. |
| (3) Regional/city levels studies. |
| If more there was than one study (for example several multi-site studies) then the weight mean was used (or mean if this could not be calculated) to obtain the selected prevalence. |
Simple estimates of number infected
The total number of adults currently infected with HBV and HCV was estimated by applying the HBsAg and anti-HCV prevalences to the 2008 national adult (aged ⩾15 years) population estimates [24]. In countries that had a selected prevalence in blood donors only, the prevalence in the general population was simply imputed from the blood-donor data. This was done by using the median ratio of the blood-donor estimates to the general population estimates for those countries with selected estimates for both of these groups. For countries with no general population and no blood-donor estimate the median of the selected general population's prevalences was used. Medians were used as the distributions were skewed, with a small number of countries having a much higher prevalence than the rest; the median thus gives a more conservative estimate than would be obtained using the mean. For HCV, 74% of those anti-HCV positive were assumed to have current infection [25].
To obtain comparable simple estimates of the numbers living with these infections in the EU/EFTA countries the same method was applied to published data (n = 30, excluding four with populations <100 000). Prevalence in first time blood donors was taken from the Council of Europe report [23], with additional data from an European Centre for Disease Prevention and Control (ECDC) review [7] (HBsAg prevalence for 27 countries, anti-HCV for 26). General population prevalences were obtained from the ECDC review, this had obtained selected prevalences for the EU/EFTA countries using a similar method (13 countries HBsAg, 12 anti-HCV) [7].
The numbers of current PWID infected with HBV and HCV were obtained by applying the selected PWID HBsAg and anti-HCV prevalences to published national estimates of the number of current injectors [26, 27]. Where national estimates of the current injecting population were not available the median of the national prevalences of injecting drug use was used to impute the number of PWID from the adult population data. For countries with no HBsAg or anti-HCV prevalence estimate for PWID the median of the selected national prevalences was used. Medians were again used as the distributions were skewed. As with the general population for HCV, 74% of those anti-HCV positive were assumed to have current infection [25].
To obtain comparable simple estimates of the number of PWID living with these infections in the EU/EFTA countries prevalence data from studies undertaken since 1999 was downloaded from the EMCDDA website [27] (all EU states and Norway report HBV and HCV seroprevalences for PWID to EMCDDA) and literature searches for Switzerland and Iceland (not members of EMCDDA). Selected prevalence estimates were then derived using the same algorithm as above. Numbers were then estimated using the same approach, including imputations for missing data, as for the countries outside EU/EFTA.
RESULTS
After accounting for studies reported by more than one publication, a total 86 sources were identified (Supplementary Fig. S1).
Prevalence: general population and blood donors
Twenty-one studies, undertaken in seven countries (35% of total), had measured HBsAg prevalence in a group representing the general population (Table 1): 11 recruited from the general population, five pregnant women, and five other groups (Supplementary Table S1). Half of these studies had recruited from one city/area (Table 1). Thirteen countries (65%) had measured HBsAg prevalence in blood donors (18 studies, 39% had national coverage, Table 1). Together the general population and blood donor studies covered 13 countries. The study HBsAg prevalences ranged from 0·1% (blood donors, Bosnia & Herzegovina) to 13% (general population, Uzbekistan, Supplementary Table S1). The selected country HBsAg prevalence estimates (Table 3, Fig. 1) ranged from 1·3% to 13% for the general population (median 3·4%, mean 5·0%) and from 0·1% to 8·4% for blood donors (median 1·1%, mean 2·2%). The selected general population prevalence was higher than the selected blood-donor prevalence in five of the seven countries with both (Table 3), the median of the ratio between these was 1·4 (range 0·57–2·6, mean 1·6).
Table 3.
Simple estimates of the number of adults with hepatitis B surface antigen (HBsAg) and hepatitis C virus (HCV) in WHO European Region
| Country | Population aged ⩾15 yr in 2008 | Prevalence in first time blood donors | Prevalence in studies representing general population | Prevalence in general population imputed from blood donors* | Prevalence estimate used | Estimated numbers with infection (rounded to nearest 100) | ||||||
|---|---|---|---|---|---|---|---|---|---|---|---|---|
| aged ⩾15 yr | HBsAg | Anti-HCV | HBsAg | Anti-HCV | HBsAg | Anti-HCV | HBsAg | Anti-HCV | HBsAg | Anti-HCV | Chronic HCV | |
| Those outside EU/EFTA | ||||||||||||
| Albania | 2 389 000 | 7·0% | 0·7% | 9·0% | 3·0% | 11% | 2·5% | Measured | Measured | 215 000 | 71 700 | 53 000 |
| Armenia | 2 431 000 | |||||||||||
| Azerbaijan | 6 549 000 | |||||||||||
| Belarus | 8 228 000 | |||||||||||
| Bosnia & Herzegovina | 3 170 000 | 0·1% | 0·03% | 0·1% | 0·1% | Imputed from BD | Imputed from BD | 4700 | 1900 | 1400 | ||
| Croatia | 3 760 000 | 0·2% | 0·1% | 0·3% | 0·2% | Imputed from BD | Imputed from BD | 10 200 | 7600 | 5600 | ||
| Georgia | 3 575 000 | 6·7% | Measured | 239 500 | 177 200 | |||||||
| Israel | 5 077 000 | 0·1% | 0·1% | 0·2% | 0·2% | Imputed from BD | Imputed from BD | 8300 | 10 400 | 7700 | ||
| Kazakhstan | 11 796 000 | 1·8% | 3·8% | 1·0% | 2·4% | Measured | Measured | 448 200 | 118 000 | 87 300 | ||
| Kyrgyzstan | 3 790 000 | 1·6% | Measured | 60 600 | 44 900 | |||||||
| Montenegro | 498 000 | 0·7% | 0·6% | 1·0% | 1·2% | Imputed from BD | Imputed from BD | 5000 | 5900 | 4400 | ||
| Republic of Moldova | 3 016 000 | |||||||||||
| Russian Federation | 120 185 000 | 1·1% | 2·1% | 1·5% | 3·6% | 1·5% | 4·3% | Measured | Measured | 1 802 800 | 4 326 700 | 3 201 700 |
| Serbia | 8 068 000 | 4·2% | 0·3% | 2·4% | 0·5% | 5·7% | 0·6% | Measured | Measured | 193 600 | 40 300 | 29 900 |
| Tajikistan | 4 239 000 | 3·0% | 2·9% | 0·5% | 4·1% | 5·9% | Imputed from BD | Measured | 171 800 | 21 200 | 15 700 | |
| FYR Macedonia | 1 674 000 | 1·0% | 0·2% | 1·4% | 0·5% | Imputed from BD | Imputed from BD | 22 800 | 7500 | 5600 | ||
| Turkey | 53 958 000 | 2·1% | 0·3% | 3·4% | 0·7% | 2·9% | 0·7% | Measured | Measured | 1 834 600 | 377 700 | 279 500 |
| Turkmenistan | 3 531 000 | |||||||||||
| Ukraine | 39 554 000 | 1·0% | 1·3% | 1·3% | 12% | 1·3% | 2·7% | Measured | Measured | 514 200 | 4 746 500 | 3 512 400 |
| Uzbekistan | 19 034 000 | 5·2% | 6·4% | 13·3% | 13·1% | 7·1% | 13% | Measured | Measured | 2 531 500 | 2 493 500 | 1 845 200 |
| Countries without HBsAg | 31 120 000 | 3·4% | Estimated from median prevalence | 1 058 100 | ||||||||
| Anti-HCV | 15 527 000 | 2·3% | Estimated from median prevalence | 357 100 | 264 300 | |||||||
| Total (rounded to nearest 1000) | 8 821 000 | 12 886 000 | 95 360 000 | |||||||||
| Those in EU/EFTA | ||||||||||||
| Austria | 7 087 000 | 0·1% | 0·1% | 0·3% | 0·5% | Imputed from BD | Imputed from BD | 24 300 | 37 900 | 28 000 | ||
| Belgium | 8 790 000 | 0·1% | 0·03% | 0·7% | 0·6% | 0·4% | 0·3% | Measured | Measured | 61 500 | 52 700 | 39 000 |
| Bulgaria | 6 606 000 | 1·8% | 0·4% | 1·3% | 7·9% | 4·5% | Imputed from BD | Measured | 520 800 | 85 900 | 63 500 | |
| Cyprus | 707 000 | 0·1% | 0·02% | 0·9% | 0·4% | 0·2% | Measured | Imputed from BD | 6400 | 1400 | 1 000 | |
| Czech Republic | 8 875 000 | 0·04% | 0·13% | 0·6% | 0·2% | 1·3% | Measured | Imputed from BD | 53 300 | 118 000 | 87 300 | |
| Denmark | 4 476 000 | 0·03% | 0·03% | 0·1% | 0·3% | Imputed from BD | Imputed from BD | 6100 | 12 400 | 9200 | ||
| Estonia | 1 140 000 | 0·3% | 0·7% | 1·2% | 7·0% | Imputed from BD | Imputed from BD | 13 600 | 79 600 | 58 900 | ||
| Finland | 4 403 000 | 0·03% | 0·04% | 0·2% | 0·1% | 0·4% | Measured | Imputed from BD | 8800 | 17 900 | 13 200 | |
| France | 50 870 000 | 0·03% | 0·02% | 1·3% | 0·1% | 0·2% | Imputed from BD | Measured | 61 400 | 661 300 | 489 400 | |
| Germany | 70 748 000 | 0·1% | 0·1% | 0·6% | 0·4% | 0·6% | 0·8% | Measured | Measured | 424 500 | 283 000 | 209 400 |
| Greece | 9 578 000 | 2·0% | 0·3% | 2·1% | 1·0% | 8·4% | 3·3% | Measured | Measured | 201 100 | 95 800 | 70 900 |
| Hungary | 8 511 000 | 0·0% | 0·3% | 0·0% | 3·1% | Imputed from BD | Imputed from BD | 2600 | 267 400 | 197 900 | ||
| Iceland | 249 000 | |||||||||||
| Ireland | 3 506 000 | 0·01% | 0·01% | 0·1% | 0·1% | 0·1% | Measured | Imputed from BD | 3500 | 3100 | 2300 | |
| Italy | 51 260 000 | 0·4% | 1·4% | 5·2% | 1·7% | Measured | Measured | 717 600 | 2 665 500 | 1 972 500 | ||
| Latvia | 1 943 000 | |||||||||||
| Lithuania | 2 823 000 | 0·6% | 1·0% | 2·6% | 10·3% | Imputed from BD | Imputed from BD | 73 900 | 289 800 | 214 500 | ||
| Luxembourg | 395 000 | 0·1% | 0·1% | 0·4% | 0·6% | Imputed from BD | Imputed from BD | 1700 | 2500 | 1800 | ||
| Malta | 342 000 | |||||||||||
| Netherlands | 13 553 000 | 0·1% | 0·02% | 0·1% | 0·4% | 0·3% | 0·2% | Measured | Measured | 13 600 | 54 200 | 40 100 |
| Norway | 3 862 000 | 0·03% | 0·03% | 0·1% | 0·4% | Imputed from BD | Imputed from BD | 4400 | 13 600 | 10 000 | ||
| Poland | 32 389 000 | 0·5% | 0·2% | 1·9% | 2·0% | 1·9% | Imputed from BD | Measured | 659 800 | 615 400 | 455 400 | |
| Portugal | 9 076 000 | 0·1% | 0·2% | 0·4% | 1·7% | Imputed from BD | Imputed from BD | 36 900 | 157 000 | 116 100 | ||
| Romania | 18 157 000 | 3·7% | 0·9% | 5·6% | 3·5% | 15·8% | 9·2% | Measured | Measured | 1 016 800 | 635 500 | 470 300 |
| Slovakia | 4 536 000 | 0·1% | 0·1% | 0·6% | 0·6% | 0·5% | Measured | Imputed from BD | 27 200 | 24 000 | 17 700 | |
| Slovenia | 1 733 000 | 0·1% | 0·03% | 0·4% | 0·4% | Imputed from BD | Imputed from BD | 7500 | 6100 | 4500 | ||
| Spain | 37 814 000 | 0·2% | 0·1% | 1·0% | 2·0% | 0·7% | 1·4% | Measured | Measured | 378 100 | 756 300 | 559 600 |
| Sweden | 7 641 000 | 0·05% | 0·1% | 0·2% | 0·4% | 0·2% | 0·6% | Measured | Measured | 15 300 | 30 600 | 22 600 |
| Switzerland | 6 335 000 | 0·2% | 0·1% | 0·7% | 0·6% | Imputed from BD | Imputed from BD | 44 800 | 40 600 | 30 000 | ||
| United Kingdom | 50 210 000 | 0·04% | 0·04% | 0·7% | 0·2% | 0·4% | Imputed from BD | Measured | 86 400 | 351 500 | 260 100 | |
| Countries without HbsAg | 2 534 000 | 0·6% | Estimated from median prevalence | 15 200 | ||||||||
| Anti-HCV | 2 534 000 | 1·2% | Estimated from median prevalence | 29 100 | 21 600 | |||||||
| Total (rounded to nearest 1000) | 4 487 000 | 7 387 900 | 5 467 000 | |||||||||
| Total Europe 732 137 000 | 13 308 000 | 20 274 000 | 15 003 000 | |||||||||
| 1·8% | 2·8% | 2·0% | ||||||||||
BD, Blood donors; FYR Macedonia, Former Yugoslav Republic of Macedonia; Anti-HCV, antibodies to the hpatitis C virus; EU/EFTA, European Union and European Free Trade Association area.
Estimated using median of the national ratios of the general population prevalence to prevalence in blood donors.
Fig. 1.
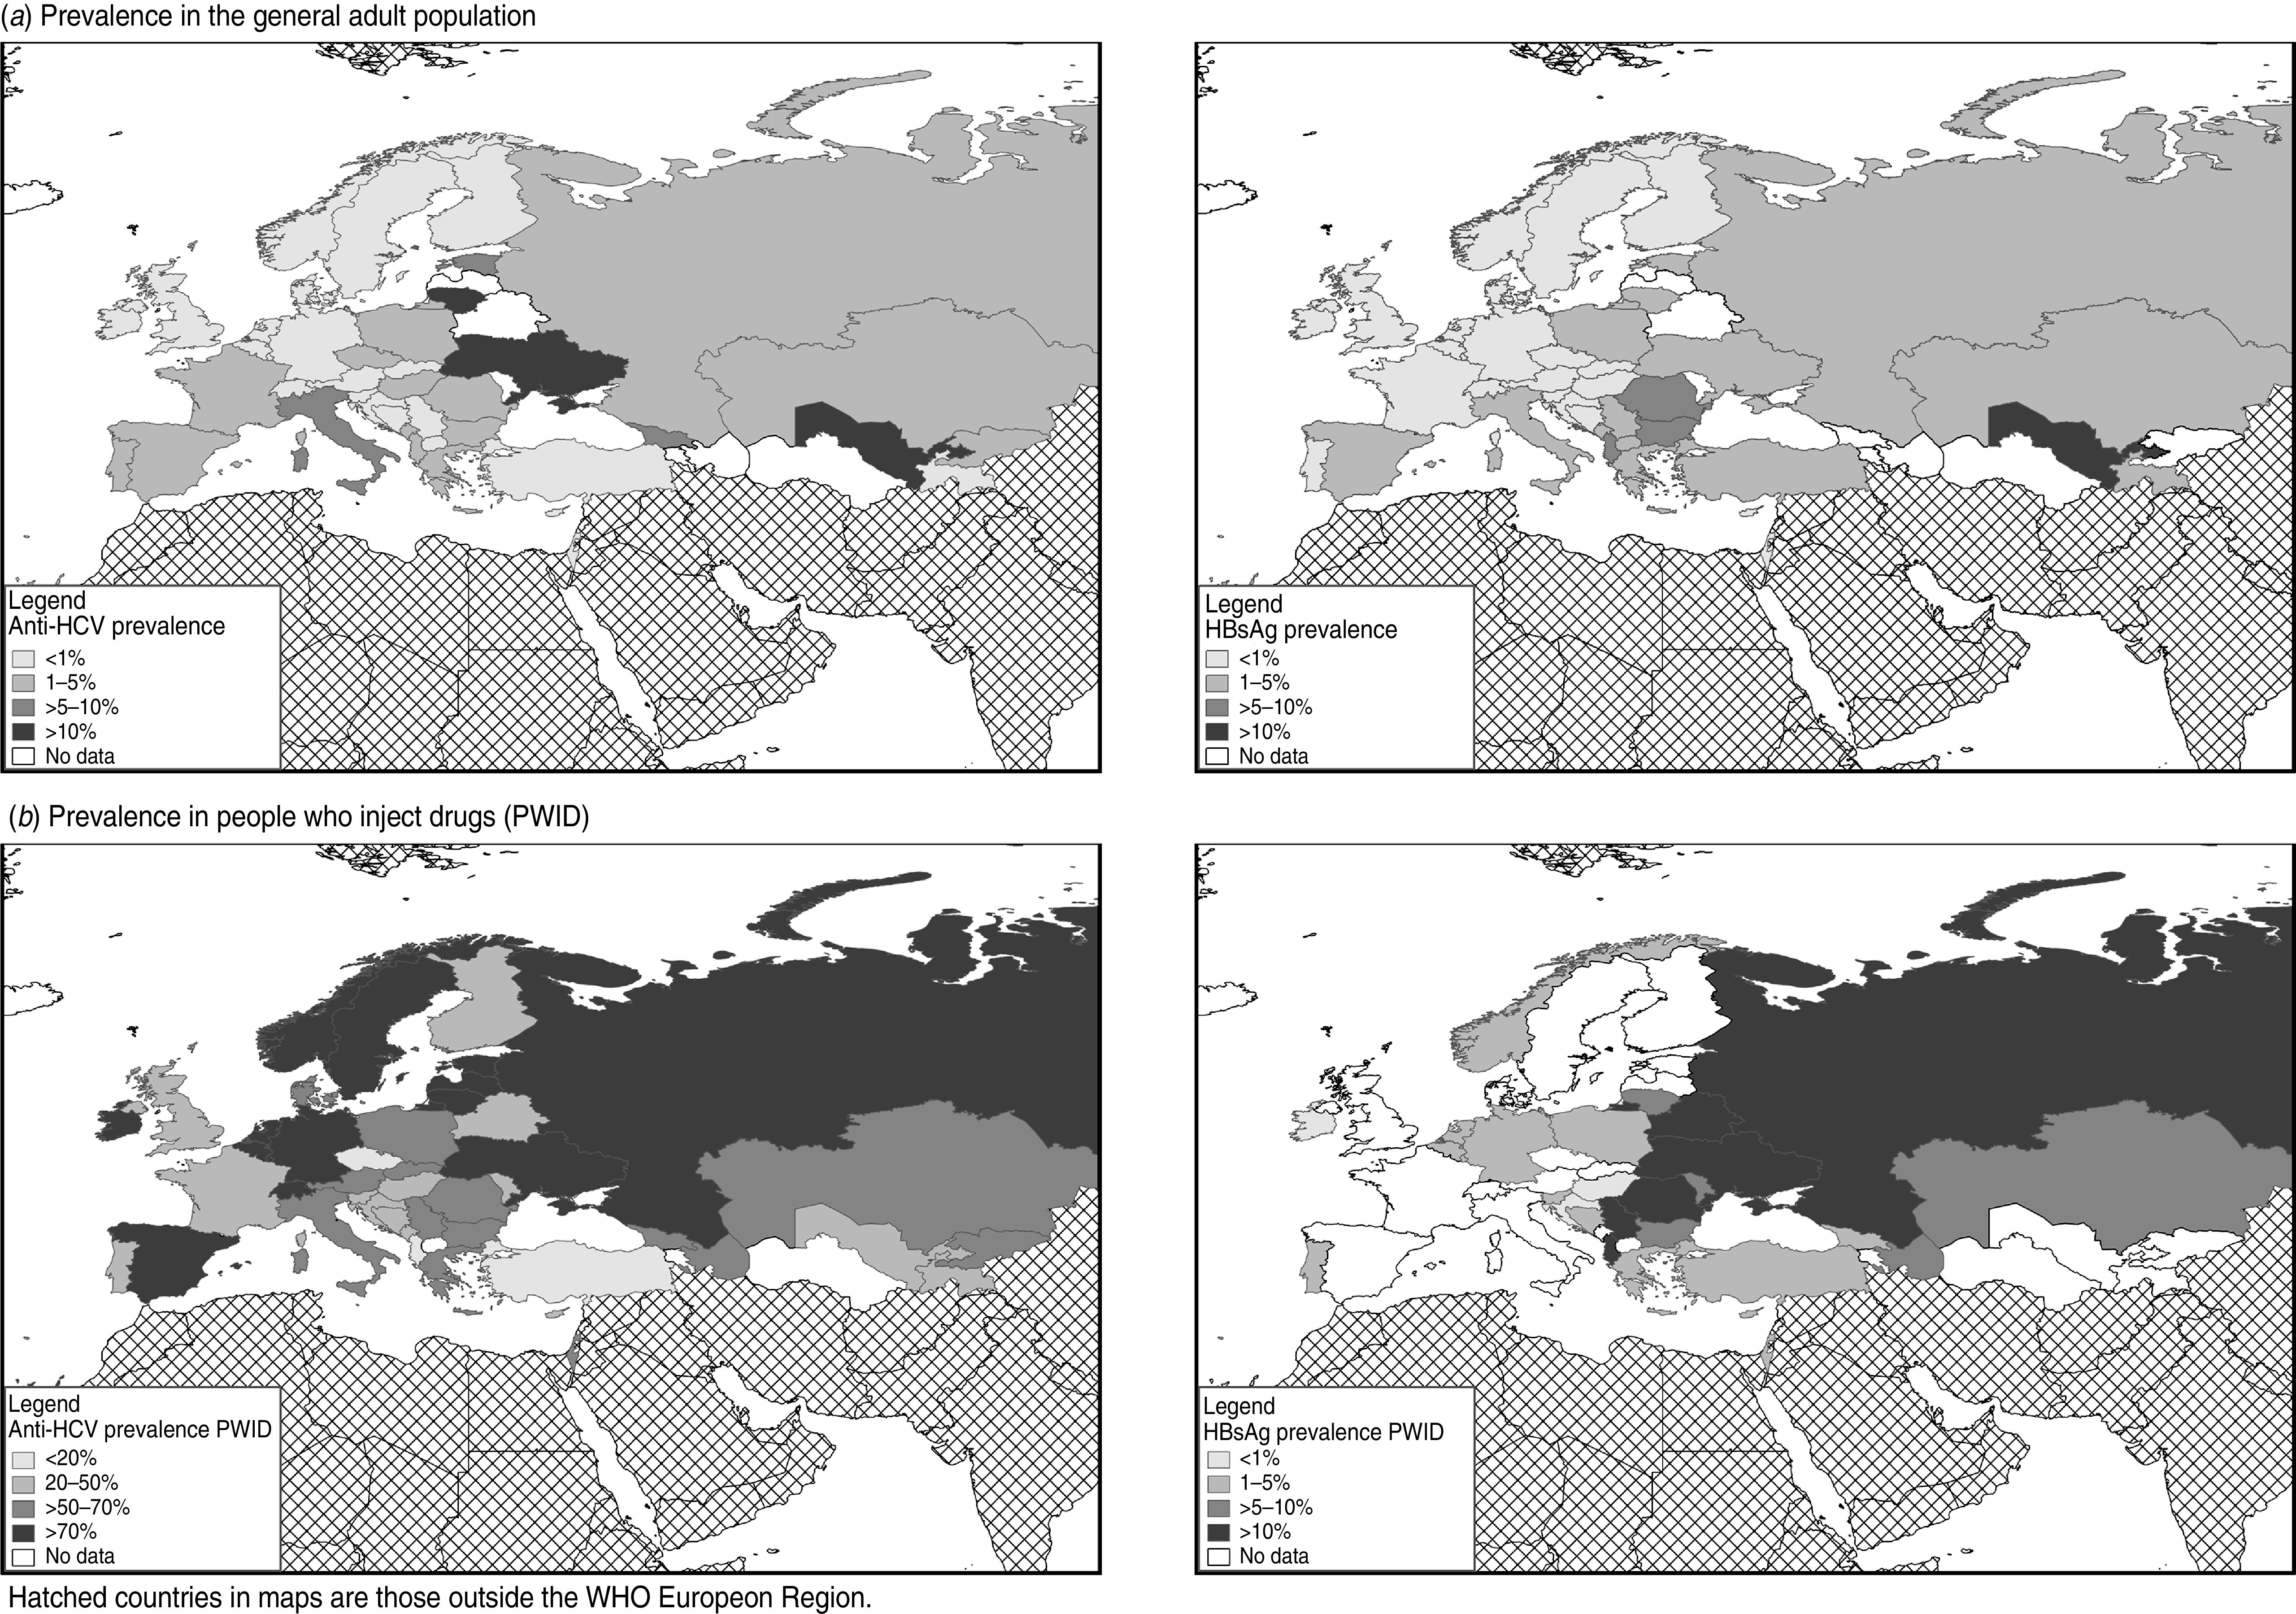
Prevalence of antibodies to hepatitis C virus (anti-HCV) and hepatitis B surface antigen (HBsAg) in (a) the general adult population; (b) people who inject drugs (PWID) in the WHO European region, by country. Hatched areas on maps indicate countries outside the WHO European Region.
Ten countries (50%) had measured the anti-HCV prevalence in groups representing the general population (20 studies: nine recruited from the general population, six pregnant women, five other groups), with two-thirds of these studies covering one city/area (Table 1). Twelve countries (60%) had measured anti-HCV prevalence in blood donors (18 studies, 39% recruited from one city/area, Table 1). Together these measures covered 15 countries (75%). The study anti-HCV prevalences ranged from 0·03% (blood donors, Bosnia & Herzegovina) to 13% (general population, Uzbekistan, Supplementary Table S1). The selected country estimates (Table 3, Fig. 1) ranged from 0·5% to 13% for the general population (median 2·3%, mean 4·3%) and from 0·03% to 6·4% for blood donors (median 0·46%, mean 1·3%). The selected general population prevalence was higher than the selected blood-donor prevalence in six of the seven countries with measures of both (Table 3), the median of the ratio between these was 2·1 (range 0·17–9·2, mean 3·0).
Prevalence: PWID
Fourteen (70%) countries had measured HBsAg prevalence and 17 (85%) anti-HCV prevalence in PWID (Table 1). In total 54 studies were identified, including 30 that had recruited from community settings; eight from needle and syringe programmes, low-threshold facilities, harm reduction, or outreach services; three from addiction treatment settings; four through other service types; and five through mixed settings (setting was unclear in four, see Supplementary Table S2). The mean sample size was 650 (range 60–4860, median 319). Twenty-two studies had measured HBsAg (38% recruited in one city/area, Table 1) and 53 studies anti-HCV prevalence (53% recruited in one city/area, Table 1). The study HBsAg prevalences ranged from 0% to 34%, and the anti-HCV prevalences from 5·3% to 95% (Supplementary Table S2). The selected country prevalence estimates (Table 4, Fig. 1) ranged from 0·8% to 31% for HBsAg (median 6·8%, mean 9·2%) and from 5·3% to 73% for anti-HCV (median 46%, mean 46%).
Table 4.
Estimates of number of current hepatitis B and C infections in the WHO European Region: EU/EFTA and non-EU/EFTA comparisons
| Adult population | (%) | Current HBV | (%) | Current HCV | (%) | |
|---|---|---|---|---|---|---|
| EU/EFTA* | 427 615 000 | (58) | 4 487 000 | (34) | 5 467 000 | (36) |
| Non EU/EFTA† | 304 522 000 | (42) | 8 821 000 | (66) | 9 536 000 | (64) |
| WHO European Region | 732 137 000 | (100) | 13 308 000 | (100) | 15 003 000 | (100) |
EU/EFTA, European Union and European Free Trade Association area.
Twenty-seven EU Member States: Austria, Belgium, Bulgaria, Cyprus, Czech Republic, Denmark, Estonia, Finland, France, Germany, Greece, Hungary, Ireland, Italy, Latvia, Lithuania, Luxembourg, Malta, The Netherlands, Poland, Portugal, Romania, Slovakia, Slovenia, Spain, Sweden, United Kingdom.
Four EEA/EFTA countries: Norway, Iceland, Liechtenstein, Switzerland.
Albania, Armenia, Azerbaijan, Belarus, Bosnia & Herzegovina, Croatia, Georgia, Israel, Kazakhstan, Kyrgyzstan, Montenegro, Republic of Moldova, Russian Federation, Serbia (incl. Kosovo), Tajikistan, The former Yugoslav Republic of Macedonia, Turkey, Turkmenistan, Ukraine.
Prevalence: MSM
Thirteen studies were found that had measured the prevalence of either HBsAg or anti-HCV in MSM (Supplementary Table S3). The samples sizes ranged from 61–741 (mean 235, median 157), and the majority had recruited MSM from community settings (11, 85%). Eight (40%) countries had undertaken a single study that had measured the HBsAg prevalence in MSM (five recruited from one city/area, Table 1). The prevalences ranged from 0% to 18% (Supplementary Table S3) with a median of 6·4% (mean 6·9%). Eleven studies (from 10 countries, 50%) reported anti-HCV prevalence in MSM (five recruited from one city/area, Table 1). The median of study anti-HCV prevalence was 4·2% (mean 7·8%, range 0–16%, Supplementary Table S3).
Prevalence: sex workers
Seventeen studies (Supplementary Table S4) had measured the prevalence of either HBsAg or anti-HCV in sex workers: samples sizes ranged from 138–2249 (mean 591, median 315). Almost half of the studies (eight, 47%) recruited sex workers from community settings, with four recruiting through services (23%) and two (12%) from both community settings and services (setting unclear for three, Supplementary Table S4). Six studies, from five countries (25%), reported an HBsAg prevalence in sex workers (two recruited from one city/area, Table 1); prevalence ranged from 2% to 18% (Supplementary Table S4), the median was 2·9% (mean 6·1%). Seventeen studies from 12 countries (60%), reported an anti-HCV prevalence in sex workers (seven recruited from one city/area, Table 1); prevalences ranged from 2·4% to 40% (median 11%, mean 14%).
Imputation of general population prevalence from blood donors
General population prevalence estimates were imputed from the blood-donor prevalence using the median ratio of the general population to the blood-donor prevalence derived from those countries with both (Table 3). Applying this ratio to the blood-donor prevalence in those countries from which it was derived, gave a median difference between the countries measured and the imputed general population prevalence of 0·004% for HBsAg (range −3·3% to 6·2%, mean 0·6%) and −0·02% for anti-HCV (range −5·4% to 9·3%, mean 0·7%). This variability indicates that a country prevalence imputed this way should be treated with caution.
Simple estimates of total numbers infected
The selected and imputed prevalences obtained here were applied to population data to produce simple estimates of the numbers infected. These estimates indicate that of the 304·5 million adults living outside the EU/EFTA area 8·8 million (2·9%) have HBsAg and 9·5 million (3·1%) have HCV RNA (Table 3). Comparable estimates for the EU/EFTA countries obtained by applying the same method to published data [7] (Table 3, Fig. 1; the median ratio between the selected general population and the selected blood-donor prevalence used in the imputations was 4·3 for HBsAg and 11 for anti-HCV). These indicated that of the 427·6 million adults in the EU/EFTA countries 4·5 million (1·0%) have HBsAg and 5·5 million (1·3%) have HCV RNA (Table 3). These levels are respectively around one-third and one half of the levels estimated for the area outside the EU/EFTA. Combining these simple estimates indicates that of the 732·1 million adults in the WHO European Region 13·3 million (1·8%) have HBsAg and 15·0 million (2·0%) have HCV RNA; with two-thirds of those living with each infection outside the EU/EFTA area (Table 4).
Simple estimates of total number of infected PWID
The selected and imputed estimates of prevalence in PWID were used to derive simple estimates of the number of current PWID living with HBV and HCV infection outside the EU/EFTA. Considering the wide range in the estimated prevalences of injecting drug use (0·077–3·6%) and in the prevalences of the two infections in PWID (see above) the imputed data should be viewed with great caution. These estimates indicate that of the estimated 3·2 million current PWID outside the EU/EFTA 0·7 million (21%) have HBsAg and 1·5 milion (47%) have HCV RNA (Table 5).
Table 5.
Simple estimates of the number of people who inject drugs with hepatitis B surface antigen (HBsAg) and hepatitis C virus (HCV) in WHO European Region
| Country | Population aged ⩾15 yr in 2008 | Estimated number of current PWID* | Prevalence | Estimated numbers with infection (rounded to nearest 100) | |||||
|---|---|---|---|---|---|---|---|---|---|
| Number | Prevalence | Imputed from median prevalence | HBsAg | Anti-HCV | HBsAg | Anti-HCV | Chronic HCV | ||
| Those outside EU/EFTA | |||||||||
| Albania | 2 389 000 | 10 000 | 15% | 13% | 1500 | 1300 | 900 | ||
| Armenia | 2 431 000 | 2000 | 0·08% | ||||||
| Azerbaijan | 6 549 000 | 300 000 | 4·58% | 5·9% | 54% | 17 700 | 162 700 | 120 400 | |
| Belarus | 8 228 000 | 6308 | 0·08% | 13% | 39% | 800 | 2500 | 1800 | |
| Bosnia and Herzegovina | 3 170 000 | 5500 | 0·17% | 2·7% | 38% | 100 | 2100 | 1500 | |
| Croatia | 3 760 000 | 16 740 | 0·45% | 0·8% | 46% | 100 | 7700 | 5700 | |
| Georgia | 3 575 000 | 127 833 | 3·58% | 2·9% | 67% | 3700 | 85 600 | 63 400 | |
| Israel | 5 077 000 | 21 000 | 4·3% | 62% | 900 | 13 000 | 9600 | ||
| Kazakhstan | 11 796 000 | 100 000 | 0·85% | 7·9% | 60% | 7900 | 60 000 | 44 400 | |
| Kyrgyzstan | 3 790 000 | 25 000 | 0·66% | 54% | 13 600 | 10 000 | |||
| Montenegro | 498 000 | 2000 | 38% | 800 | 600 | ||||
| Republic of Moldova | 3 016 000 | 3810 | 0·13% | 6·8% | 43% | 300 | 1600 | 1200 | |
| Russian Federation | 120 185 000 | 1 825 000 | 1·52% | 31% | 73% | 565 800 | 1 332 300 | 985 900 | |
| Serbia | 8 068 000 | 18 000 | 0·22% | 15% | 52% | 2600 | 9400 | 6900 | |
| Tajikistan | 4 239 000 | 17 000 | 0·40% | 33% | 5500 | 4100 | |||
| FYR Macedonia | 1 674 000 | 2691 | 0·16% | ||||||
| Turkey | 53 958 000 | 226 000 | 2·9% | 5·3% | 6600 | 12 000 | 8900 | ||
| Turkmenistan | 3 531 000 | 14 000 | |||||||
| Ukraine | 39 554 000 | 375 000 | 0·95% | 12% | 71% | 44 000 | 266 300 | 197 000 | |
| Uzbekistan | 19 034 000 | 80 000 | 0·42% | 36% | 28 800 | 21 300 | |||
| Median prevalence of injecting drug use | 0·4% | ||||||||
| Countries without HBsAg estimated using median prevalence | 142 691 | 6·8% | 9700 | ||||||
| Countries without anti-HCV estimated using median prevalence | 18 691 | 46% | 8600 | 6400 | |||||
| Total (rounded to nearest 1000) | 662 000 | 2 014 000 | 1 490 000 | ||||||
| Those in UE/EFTA | |||||||||
| Austria2 | 7 087 000 | 17 500 | 0·25% | 53% | 9300 | 6900 | |||
| Belgium4 | 8 790 000 | 25 800 | 0·29% | 3·7% | 74% | 1000 | 19 100 | 14 100 | |
| Bulgaria5 | 6 606 000 | 20 250 | 0·31% | 5·5% | 58% | 1100 | 11 700 | 8700 | |
| Cyprus1 | 707 000 | 446 | 0·06% | 3·5% | 36% | 20 | 200 | 100 | |
| Czech Republic1 | 8 875 000 | 31 200 | 0·35% | 12% | 3700 | 2700 | |||
| Denmark1 | 4 476 000 | 12 754 | 0·28% | 53% | 6700 | 5000 | |||
| Estonia4 | 1 140 000 | 13 801 | 1·21% | 90% | 12 400 | 9200 | |||
| Finland3 | 4 403 000 | 15 650 | 0·36% | 42% | 6600 | 4900 | |||
| France3 | 50 870 000 | 122 000 | 0·24% | 45% | 54 900 | 40 600 | |||
| Germany5 | 70 748 000 | 94 250 | 0·13% | 2·0% | 75% | 1900 | 70 700 | 52 300 | |
| Greece2 | 9 578 000 | 8148 | 0·09% | 2·5% | 50% | 200 | 4100 | 3000 | |
| Hungary1 | 8 511 000 | 3941 | 0·05% | 0·5% | 23% | 20 | 900 | 700 | |
| Iceland | 249 000 | 600 | |||||||
| Ireland5 | 3 506 000 | 6289 | 0·18% | 0·4% | 72% | 30 | 4500 | 3400 | |
| Italy1 | 51 260 000 | 326 000 | 0·64% | 59% | 193 000 | 142 800 | |||
| Latvia5 | 1 943 000 | 5500 | 74% | 4100 | 3000 | ||||
| Lithuania4 | 2 823 000 | 5123 | 0·18% | 5·9% | 73% | 300 | 3700 | 2800 | |
| Luxembourg1 | 395 000 | 1482 | 0·38% | 3·9% | 81% | 100 | 1200 | 900 | |
| Malta1 | 342 000 | 900 | 33% | 300 | 200 | ||||
| Netherlands4 | 13 553 000 | 3115 | 0·02% | 3·0% | 77% | 100 | 2400 | 1800 | |
| Norway1 | 3 862 000 | 10 032 | 0·26% | 1·2% | 74% | 100 | 7400 | 5500 | |
| Poland4 | 32 389 000 | 88 000 | 4·6% | 59% | 4000 | 51 900 | 38 400 | ||
| Portugal2 | 9 076 000 | 16 425 | 0·18% | 5·0% | 46% | 800 | 7600 | 5600 | |
| Romania5 | 18 157 000 | 49 000 | 10% | 64% | 5000 | 31 400 | 23 200 | ||
| Slovakia5 | 4 536 000 | 18 841 | 0·42% | 50% | 9400 | 7000 | |||
| Slovenia1 | 1 733 000 | 7310 | 0·42% | 3·4% | 22% | 200 | 1600 | 1200 | |
| Spain3 | 37 814 000 | 83 972 | 0·22% | 73% | 61 600 | 45 500 | |||
| Sweden5 | 7 641 000 | 29 513 | 0·39% | 88% | 26 000 | 19 300 | |||
| Switzerland1 | 6 335 000 | 31 653 | 0·50% | 78% | 24 700 | 18 300 | |||
| United Kingdom4 | 50 210 000 | 142 650 | 0·28% | 46% | 65 600 | 48 600 | |||
| Median prevalence of injecting drug use | 0·3% | ||||||||
| Countries without HBsAg estimated using median prevalence | 852 534 | 3·5% | 29 800 | ||||||
| Countries without anti-HCV estimated using median prevalence | 600 | 59% | 400 | 300 | |||||
| Total (rounded to nearest 1000) | 45 000 | 697 000 | 516 000 | ||||||
| Total Europe (rounded to nearest 1000) | 706 000 | 2 711 000 | 2 006 000 | ||||||
FYR, The Former Yugoslav Republic of Macedonia; Anti-HCV, antibodies to the hepatitis C virus; EU/EFTA, European Union and European Free Trade Association area; EU/EFTA HBsAg and anti-HCV data from EMCDDA website plus a literature search for Switzerland and Iceland (1 National study; 2 weighted mean of national studies; 3 multi-city; 4 weighted mean from city/sub-region studies; 5 one city/region.)
Mathers et al. [26], plus data for Bosnia & Herzegovina, Croatia, Czech Republic, Cyprus, Estonia, Greece, Luxembourg, Macedonia, Portugal, Sweden, and United Kingdom from EMCDDA website; and data for Serbia from the Republic of Serbia UNGASS Country Progress Report on AIDS 2010.
Comparable estimates for current PWID living in EU/EFTA countries were derived from published data [27] by applying the same method (Table 5, Fig. 1). These estimates for EU/EFTA should be viewed cautiously, as due to the substantial variability in the prevalences (injecting drug use: 0·06–1·2%, median 0·28%, mean 0·31%; HBsAg: 0·3–10%, median 3·5%, mean 3·7%; anti-HCV: 12–88%, median 59%, mean 58%) the imputed data used here are likely to be subject to much uncertainty. The estimation process indicates that of the estimated 1·2 million current PWID in the EU/EFTA area 45000 (3·7%) have HBsAg and 0·5 million (43%) have HCV RNA (Table 5). The proportion with anti-HCV is comparable with the level outside of the EU/EFTA; however, the proportion with HBsAg is much lower (Table 4). Combining these estimates indicates that in current PWID (estimated 4·5 million) across the WHO European Region 0·7 million (15%) have HBsAg and 2·0 million (44%) have HCV RNA (Table 5).
DISCUSSION
Our simple estimates suggest that almost 1/50 adults in the WHO European Region have HBV infection and a similar proportion chronic HCV. Outside of the EU/EFTA area prevalence was around three times higher for HBsAg and over twice as high for HCV RNA. Prevalence of these infections was highest in PWID (15% and 44%, respectively). Although the estimates here need to be viewed with caution, they do suggest a sizable burden due to these two viral infections in the Region, particularly outside the EU/EFTA area.
First, it is important to consider the limitations of this study. The prevalence data on HBsAg and anti-HCV were obtained from literature searches, while grey literature was included, it is possible studies will still have been missed particularly if they have recently been undertaken, reported in languages other than Russian or English, or unpublished. Second, measures of the prevalence of HBsAg and anti-HCV were not identified in all populations or in all countries. In many countries no national studies had been undertaken, thus local and regional data were assumed to be reflective of the whole country. Small studies (n < 100) and those where population was not specifically or clearly defined were excluded; however, we did not asses the methodological quality of the studies, in part because data available was often limited. The studies used a range of designs and thus the robustness of the resulting data is likely to be variable. Where no measure of prevalence was found, simple imputation approaches were applied. Considering these limitations it is important that the findings are viewed cautiously. Even so, the extensive nature of searches undertaken in this assessment mean that it is likely to provide as robust an estimation as is currently practical at the regional level.
In the WHO European Region outside the EU/EFTA, the measured HBsAg and anti-HCV prevalences were highest in PWID, but infection was also common in the general population (3·8% and 2·3%, respectively), MSM (8·7% and 4·2%, respectively), and in sex workers (3·3% and 11%, respectively). There was substantial variation between countries, while prevalence of these infections in PWID was high in most countries; Uzbekistan had a prevalence of 13% for both infections in the general population. The general population HCV prevalence estimate was also elevated in the Ukraine and Georgia, and in Albania the general population HBsAg prevalence estimate was elevated. While these differences might be related to the methodologies used in the studies, they warrant further investigation.
For the general population, PWID and MSM prevalences were higher than in the EU/EFTA area [7], although comparable data for EU/EFTA was very limited for MSM. The ECDC review [7] found only two studies from the EU/EFTA countries that had measured HBsAg in MSM [4% Sweden 1993–1997, and <1% UK (Scotland) 1993–2003] and one study that had measured anti-HCV [1·3% Amsterdam (The Netherlands) 2003], indicating a need for further studies of prevalence for MSM and other transmission risk populations. For sex workers data on the prevalence of these infections has not been reviewed for the EU/EFTA area, but considering the elevated prevalence found here this is needed. In the countries outside the EU/EFTA, MSM have a higher prevalence of both HBsAg and anti-HCV than the general population, and sex workers had higher anti-HCV prevalence. The high anti-HCV prevalence in MSM and sex workers possibly reflects an overlap with the PWID population [8]. The higher prevalences of both infections in MSM is a concern considering the evolving epidemic of HIV in this group in parts of central and eastern Europe [28].
The ratios between the general population estimates and the blood-donor estimates were higher for the EU/EFTA area compared to outside (almost three times higher for HBsAg and about five times higher for anti-HCV). The reasons for this difference are unclear, but it could for example, be due to more success in excluding those who have been at risk of infection from blood donation in the EU/EFTA countries, or be a reflection of the higher prevalence of these infections in the general population outside the EU/EFTA area. This difference needs further investigation.
The estimates of the numbers infected simply applied prevalence to population data; with the prevalences derived from studies using a range of methodologies and imputed for countries with no data (the majority lacked a general population HBsAg estimate). There is some corroboration for the estimates obtained from comparison with published national estimates for HCV. In Italy a modelling approach estimated 2·1 million people chronically infected with HCV in 2000 and 1·9 million in 2005 [29] compared to the 2·0 million estimated here. In the UK, modelling approaches suggest that around 200 000 people are living with chronic HCV infection [30, 31], while the simple UK estimate here (n = 260 100) is higher it is within the confidence range.
For the PWID estimates there is some corroboration from the UK, where 66 000 current PWID were estimated as HCV-infected in England and Wales [30] compared to the simple UK estimate here of 48 600 – though the study had estimated a larger injecting population than the one used here. The estimates of the number of infected PWID obtained here will be particularly uncertain, as estimates of infection prevalence are being simply applied to estimates of the number of current PWID. Both of these are difficult to measure due to the illicit and marginalized nature of injecting drug use, and are thus are likely to be subject to much uncertainty. The estimated number of PWID should thus be used very cautiously. In the UK almost as many former PWID were estimated to have HCV as current PWID [30]. The estimates obtained here relate to number of infected current PWID, but there will also be many former PWID that will have been infected. It is thus likely that many of the infections in the region not in current PWID will be in former PWID.
A previous estimate had suggested that 14 million people were living with chronic HBV [32] in the WHO European Region, although the method used for this estimate is not given, it provides some corroboration for the 13·3 million estimated here. In the 1990s, it was estimated from national prevalence data, that there were 8·9 million people living with HCV [4] in the WHO European Region (prevalence 1·0%), our estimate suggest that HCV infection might have increased over time to 15 million (prevalence 2·0%). If so, this might reflect transmission in PWID, particularly in the east of the Region, where there has been a recent and accelerating epidemic of HIV in PWID [33].
Viral hepatitis has been recognized as a global public health problem and a World Health Assembly Resolution [34] has called on Member States to take action to strengthen preventive and control measures. Our findings indicate a large pool of individuals infected with HBV and HCV in the WHO European Region, and so the potential for further transmission. The WHO's recent Framework for Global Action to prevent and control viral hepatitis [1] describes the work needed. Interventions to prevent transmission [2, 9, 35], including information on safer sex, condom distribution, needle and syringe programmes, and strict infection control practices in healthcare and other settings, need to be maintained and expanded as appropriate. HBV can be prevented through vaccination, national policies should be reviewed regularly, and in those countries with universal vaccination programmes targeted vaccination of high-risk groups should be considered, as recommended by WHO [36]. Both HBV and HCV can, to varying degrees, be successfully treated. Easy access to diagnostic testing is an important entry point for accessing both prevention and treatment programmes, and in higher prevalence countries targeted screening programmes should be considered for those at greatest risk. Other measures can also reduce the transmission of viral hepatitis, such as, ensuring a safe blood supply.
This study provides useful data for policy makers on the scale of HBV and HCV infection in the region. Policy makers need consider the extent of these diseases when planning health services in order to ensure that appropriate interventions [35–37] are provided on a sufficient scale to reduce the burden arising from these two preventable infections.
These findings indicate that there may be over 13 million adults living with HBV and 15 million with HCV in the WHO European Region – indicating a large burden for treatment and care. The prevalence of these infections appears to be higher outside the EU/EFTA, with these countries (mainly in eastern Europe and central Asia) accounting for 66% of those with HBsAg and 64% of those with HCV RNA, yet only 42% of the European Region's adult population (Table 4). Efforts to prevent, diagnose and treat these infections need to be maintained and improved. Surveillance of the seroprevalence of these infections and related risk behaviours in the affected populations is needed to monitor trends and allow assessment of the impact of interventions.
Supplementary Material
Supplementary information supplied by authors.
ACKNOWLEDGEMENTS
This work was funded by the World Health Organization Regional Office for Europe. The authors thank Dr Lucy Platt for her assistance with the literature in Russian.
Supplementary material
For supplementary material accompanying this paper visit https://doi.org/10.1017/S0950268813000940.
click here to view supplementary material
DECLARATION OF INTEREST
None.
REFERENCES
- 1.WHO. Prevention and control of viral hepatitis infection: frame work for global action 2012. Geneva: WHO, 2012. (www.who.int/csr/disease/hepatitis/GHP_framework.pdf). Accessed 14 December 2012. [Google Scholar]
- 2.Lavanchy D. Hepatitis B virus epidemiology, disease burden, treatment, and current and emerging prevention and control measures. Journal of Viral Hepatitis 2004; 11: 97–107. [DOI] [PubMed] [Google Scholar]
- 3.Goldstein ST, et al. A mathematical model to estimate global hepatitis B disease burden and vaccination impact. International Journal of Epidemiology 2005; 34: 1329–39. [DOI] [PubMed] [Google Scholar]
- 4.World Health Organization. Hepatitis C – global prevalence (update). Weekly Epidemiological Record 1999; 74: 425–27.10645164 [Google Scholar]
- 5.WHO Executive Board. Viral hepatitis. Report by the Secretariat. EB126/15. Geneva: WHO; 12 November 2009: http://apps.who.int/gb/ebwha/pdf_files/EB126/B126_15-en.pdf.
- 6.Perz JF, et al. The contributions of hepatitis B virus and hepatitis C virus infections to cirrhosis and primary liver cancer worldwide. Journal of Hepatology 2006; 45: 529–538. [DOI] [PubMed] [Google Scholar]
- 7.European Centre for Disease Prevention and Control. Hepatitis B and C in the EU neighbourhood: prevalence, burden of disease and screening policies. Stockholm: ECDC; September 2010 (www.ecdc.europa.eu/en/publications/Publications/TER_100914_Hep_B_C%20_EU_neighbourhood.pdf).
- 8.Platt L, et al. The HIV epidemics of Europe: vulnerability and response. World Bank (in press).
- 9.Lauer GM, Walker BD. Hepatitis C virus infection. New England Journal of Medicine 2001; 345: 41–52. [DOI] [PubMed] [Google Scholar]
- 10.Munir S, et al. Hepatitis C treatment: current and future perspectives. Virology Journal 2010; 7: 296. [DOI] [PMC free article] [PubMed] [Google Scholar]
- 11.Lee WM. Medical progress: hepatitis B virus infection. New England Journal of Medicine 1997; 337: 1733–1745. [DOI] [PubMed] [Google Scholar]
- 12.Hagan H, Des Jarlais DC. HIV and HCV Infection among Injecting Drug Users. Mount Sinai Journal of Medicine 2000; 67: 423–428. [PubMed] [Google Scholar]
- 13.Matthews GV, et al. Patterns and characteristics of hepatitis C transmission clusters among HIV-positive and HIV-negative individuals in the Australian Trial in Acute Hepatitis C. Clinical Infectious Diseases 2011; 52: 803–811. [DOI] [PMC free article] [PubMed] [Google Scholar]
- 14.Lauer GM, Walker BD. Hepatitis C virus infection. New England Journal of Medicine 2001; 345: 41–52. [DOI] [PubMed] [Google Scholar]
- 15.Sorrell MF, et al. National Institutes of Health Consensus Development Conference Statement: Management of Hepatitis B. Annals of Internal Medicine 2009; 150: 104–110. [DOI] [PubMed] [Google Scholar]
- 16.National Institutes of Health. Consensus development conference statement: management of hepatitis C: 2002–10–12 June, 2002. Hepatology 2002; 36: S3–20. [DOI] [PubMed] [Google Scholar]
- 17.European Association for the Study of the Liver. EASL clinical practice guidelines: management of chronic hepatitis B. Journal of Hepatology 2009; 50: 227–242. [DOI] [PubMed] [Google Scholar]
- 18.Ghany MG, et al. Diagnosis, management, and treatment of hepatitis C: an update. Hepatology 2009; 49: 1335–1374. [DOI] [PMC free article] [PubMed] [Google Scholar]
- 19.Vickerman P, Martin N, Hickman M. Can Hepatitis C virus treatment be used as a prevention strategy? Additional model projections for Australia and elsewhere. Drug and Alcohol Dependence 2011; 113: 83–85. [DOI] [PubMed] [Google Scholar]
- 20.Seeff LB. Natural history of chronic hepatitis C. Hepatology 2002; 36 (Suppl. 1): S35–S46. [DOI] [PubMed] [Google Scholar]
- 21.Toy M, et al. Potential impact of long-term nucleoside therapy on the mortality and morbidity of active chronic hepatitis B. Hepatology 2009; 50: 743–751. [DOI] [PubMed] [Google Scholar]
- 22.Hutton DW, et al. Cost-effectiveness of screening and vaccinating Asian and Pacific Islander adults for hepatitis B. Annals of Internal Medicine 2007; 147: 460–469. [DOI] [PubMed] [Google Scholar]
- 23.Directorate for the Quality of Medicines and Health Care of the Council of Europe. The collection, testing and use of blood and blood components in Europe: 2006 Report. Council of Europe Publishing, Strasbourg, 2010. [Google Scholar]
- 24.World Health Organization. World Health Statistics 2010. Geneva, World Health Organization, 2010. [Google Scholar]
- 25.Micallef JM, Kaldor JM, Dore GJ. Spontaneous viral clearance following acute hepatitis C infection: a systematic review of longitudinal studies. Journal of Viral Hepatitis 2006; 13: 34–41. [DOI] [PubMed] [Google Scholar]
- 26.Mathers B, et al. Global epidemiology of injecting drug use and HIV among people who inject drugs: a systematic review. Lancet 2008; 372: 1733–1745. [DOI] [PubMed] [Google Scholar]
- 27.EMCDDA. Statistical Bulletin 2010 (www.emcdda.europa.eu/stats10/pdu). Accessed 6 May 2011.
- 28.Bozicevic I, et al. HIV epidemics among men who have sex with men in central and eastern Europe. Sexually Transmitted Infections 2009; 85: 336–342. [DOI] [PubMed] [Google Scholar]
- 29.Mariano A, et al. Estimating the incidence, prevalence and clinical burden of hepatitis C over time in Italy. Scandinavian Journal of Infectious Diseases 2009; 41: 689–699. [DOI] [PubMed] [Google Scholar]
- 30.Harris R, et al. Hepatitis C prevalence in England remains low and varies by ethnicity: an updated evidence synthesis. European Journal of Public Health 2012; 22: 187–192. [DOI] [PubMed] [Google Scholar]
- 31.Scottish Government. Hepatitis C Action Plan for Scotland: Phase II (May 2008–March 2011). Edinburgh: Scottish Government, May 2008 (www.scotland.gov.uk/Resource/Doc/222750/0059978.pdf). Accessed 8 December 2011. [Google Scholar]
- 32.European Hepatitis B Expert Group. European orientation towards the better management of hepatitis in Europe. Recommendations of the Hepatitis B expert group, 2008. (www.elpa-info.org/tl_files/elpa_downloads/hep_b.pdf). Accessed 14 December 2012. [Google Scholar]
- 33.Jolley E, et al. HIV among people who inject drugs in Central and Eastern Europe and Central Asia: a systematic review with implications for policy. British Medical Journal. Published online: 18 October 2012. doi: 10.1136/bmjopen-2012-001465. [DOI] [PMC free article] [PubMed] [Google Scholar]
- 34.WHA. Sixty-third World Health Assembly: viral hepatitis. WHA63.18. Geneva: WHO, 21 May 2010 (http://apps.who.int/gb/ebwha/pdf_files/WHA63/A63_R18-en.pdf). Accessed 14 December 2012. [Google Scholar]
- 35.Brook G, Soriano V, Bergin C. European guideline for the management of hepatitis B and C virus infections, 2010. International Journal of STD & AIDS 2010; 21: 669–678. [DOI] [PubMed] [Google Scholar]
- 36.WHO. Hepatitis B vaccines. WHO position paper. Weekly Epidemiological Record 2009; 84, 405–420.19817017 [Google Scholar]
- 37.WHO Regional Office for Europe. European Action Plan for HIV/AIDS 2012–2015. Copenhagen, WHO Regional Office for Europe, 2011. (www.euro.who.int/en/what-we-do/health-topics/communicable-diseases/hivaids/publications/2011/european-action-plan-for-hivaids-20122015). Accessed 8 December 2011. [Google Scholar]
Associated Data
This section collects any data citations, data availability statements, or supplementary materials included in this article.
Supplementary Materials
Supplementary information supplied by authors.
For supplementary material accompanying this paper visit https://doi.org/10.1017/S0950268813000940.
click here to view supplementary material