Abstract
We have examined the formation of environmentally persistent free radicals (EPFRs) from phenol over alumina and titania using both powder and single-crystal samples. Electron paramagnetic resonance (EPR) studies of phenol adsorbed on metal oxide powders indicates radical formation on both titania and alumina, with both oxides forming one faster-decaying species (lifetime on the order of 50-100 hours) and one slower-decayng species (lifetimes on the order of 1000 hours or more). Electron energy loss spectroscopy (EELS) measurements comparing physisorbed phenol on single-crystal TiO2(110) to phenoxyl radicals on the same substrate indicate distinct changes in the π-π* transitions from phenol after radical formation. The identical shifts are observed from EELS studies of phenoxyl radicals on ultrathin alumina grown on NiAl(110), indicating that this shift in the π-π* transition may be taken as a general hallmark of phenoxyl radical formation.
I. INTRODUCTION
Recent experimental evidence has demonstrated the formation of environmentally persistent free radicals (EPFRs) associated with airborne particulate matter generated in combustion reactions. Laboratory studies have demonstrated the formation of EPFRs from substituted benzene precursors on systems such Cu(II) oxide and Fe(III) oxide supported on silica used as model fly ash, with half-lives of hours to days under ambient conditions [1,2], and virtually indefinite lifetimes under vacuum. Ab initio calculations attribute this stability and low reactivity to resonance stabilization including both carbon- and oxygen-centered radical structures [3]. Evidence of EPFRs has been found in soil samples from a Superfund wood treating site [4], and it has been demonstrated that EPFRs derived from the reaction of 2-monochlorophenol (2-MCP) on CuO/silica particles can form reactive oxygen species in aqueous solutions [5,6]. These EPFR-containing particles in turn have been demonstrated to lead to oxidative stress and increased cell death in both animal [7] and human [8] tissues.
Precursors such as phenol, 2-MCP, catechol, 1,2-dichlorobenzene, and other substituted benzenes have been proposed to form EPFRs over metal oxides at elevated temperatures (375-775 K) by a mechanism involving initial physisorption, elimination of H2O or HCl to chemisorb to the metal ion, and electron transfer from the precursor to the metal oxide resulting in the reduction of the metal accompanied by EPFR formation [1]. The formation of EPFRs from several aromatic precursors has been experimentally shown through electron paramagnetic resonance (EPR) spectroscopy on both CuO [1] and Fe2O3 [2] particles supported on silica. The EPR spectra of the dosed precursors show three common features – an F-center formed in the metal oxide after electron transfer from the precursor, and either a phenoxyl-type or semiquinone-type radical (see Fig. 1 for a generic mechanism of phenoxyl radical formation). As further evidence of this proposed mechanism, Cu K-edge XANES spectroscopy of 2-MCP, chlorobenzene, and 1,2-dichlorobenzene adsorbed on micron-sized CuO supported on silica directly shows the reduction of Cu(II)O to a mixture of Cu(II), Cu(I), and small amounts of Cu(0) after exposure to these precursors at elevated temperature [9].
FIG. 1.

Schematic of radical formation from phenol adsorbed on a generic metal oxide.
In this study, we used electron paramagnetic resonance (EPR) spectroscopy and electron energy loss spectroscopy (EELS) to investigate the mechanisms of EPFR formation from aromatic precursors on the surface of other well-characterized metal oxides of interest, specifically TiO2 and Al2O3. Alumina is, along with silica, the highest concentration species in complex combustion systems [10-12], making it a system of interest along with copper oxides and other transition metal oxides. EPR studies clearly demonstrate the formation of EPFRs on these systems, while EELS studies on single-crystal alumina and TiO2 guide a more fundamental understanding of the changes in the electronic structure and morphology of both the metal oxide and the adsorbed molecule. The combination of techniques leads us toward a more detailed atomic-scale picture of the radical formation.
II. EXPERIMENTAL METHODS
A. Electron Paramagnetic Resonance Spectroscopy
All EPR measurements were performed using a Bruker EMX-2.0/2.7 EPR spectrometer with dual cavities, X-band, 100 kHz, and microwave frequency, 9.53 GHz. The spectra were obtained at room temperature. The typical operating parameters were: microwave power 1 mW, modulation amplitude 4 G, sweep width 200 G, time constant 40.960 ms, and sweep time 167.7 s.
The particulate samples ( -alumina and titania) were exposed to the vapors of phenol using a custom-made vacuum exposure system. The system consisted of a vacuum gauge, dosing vial port, equilibration chamber, and 2 reactors. Prior to adsorption, each sample was oxidized in air in situ at 725 K. Vapors of the molecular adsorbates were introduced into the equilibration chamber at the desired pressure (~10 Torr), and the particles were exposed to the adsorbate vapors at 505 K for 5 min. Once the exposure was completed, the port and dosing tube were evacuated for 1 h at the dosing temperature and a pressure of 10−2 Torr. The reactor was then sealed under vacuum, and the sample was cooled to room temperature prior to EPR measurements.
To determine the persistency (combination of stability and lack of reactivity) of the EPFRs, kinetic studies were performed. EPFR/particle samples were continuously exposed to room air at ambient temperature, and the EPR signal was measured periodically to determine the radical concentration as a function of time. To determine the concentration of radicals (spins/gram), the area of the EPR absorption peak in each sample was compared to that of a known amount of a DPPH (2,2-diphenyl-1-picrylhydrazyl) standard (1 radical/molecule). Radical decay kinetic experiments in air are based on an assumed reaction with molecular oxygen:
| (1) |
For reaction rate calculations, a first order kinetic expression was used:
| (2) |
where k = K[O2] for excess oxygen conditions (pseudo zero order in oxygen concentration). The 1/e half-life decay is calculated from the first order decay t1/e = 1/k, where k is a slope of the linear regression to the integrated kinetic differential equation
| (3) |
For the purpose of clarity the radical decays were plotted on a semi-logarithmic scale to yield a straight-line fit.
B. Electron Energy Loss Spectroscopy
EELS experiments were performed using single-crystal rutile TiO2(110) from commercial vendors and ultrathin alumina grown by oxidizing single-crystal NiAl(110) using standard methods [13-15]. Experiments were performed in a UHV system with base pressure 10−10 Torr consisting of two chambers connected by a gate valve. The preparation chamber contained a sputter gun, leak valves to dose various gases, LEED, and a single-pass cylindrical mirror analyzer with coaxial electron gun for Auger electron spectroscopy measurements. The EELS chamber contained an LK Technologies LK2000 EELS spectrometer. Samples were checked for cleanliness by looking for clean and sharp LEED patterns and ensuring that Auger spectra showed no adventitious carbon or other species.
To dose our chosen EPFR precursor, solid phenol was loaded into Pyrex tubes attached to standard leak valves through a mini-conflat flange and purified by freeze-pump-thaw cycles, after which sublimated vapor was able to be dosed into the chamber. For high pressure (10−3 Torr) dosing, used for exposures of 106 Langmuir or greater (1 L = 10−6 Torr • s), samples were transferred into a separately pumped cell (base pressure ~5×10⁻⁶ Torr) that could be isolated from the main chamber to avoid contaminating the UHV system. The cell was equipped with a sample stage that could be radiantly heated with a nearby glass-enclosed tungsten filament, with temperature measured by a type K thermocouple in contact with the sample stage. When dosing at elevated temperature, samples were first heated under vacuum and maintained at constant temperature for 10 minutes before dosing the desired quantity of gas. After dosing, we transferred the sample back to the main chamber when the pressure in the cell dropped to ~10−5 Torr.
Vibrational and low-level electronic excitations of the clean and prepared surfaces were measured with high-resolution electron energy loss spectroscopy (HREELS) using an LK 2000 spectrometer. Primary beam energies were chosen to be either 7 or 30 eV for recording vibrational spectra and electronic excitations, respectively, with energy resolution of order 8-10 meV for vibrational spectra and ~30 meV for electronic excitations (measured by the width of the elastically scattered electron beam). Experiments were performed in both specular (incident beam angle equal to exiting beam angle) and off-specular (incident beam angle different from exiting beam angle) in order to probe both dipole-active and Raman-active vibrational modes, respectively. Unless otherwise noted, EELS spectra displayed here were normalized to the height of the elastic peak, with offsets added for clarity.
III. RESULTS AND DISCUSSION
A. EPR studies of phenol adsorption on particulate titania and alumina
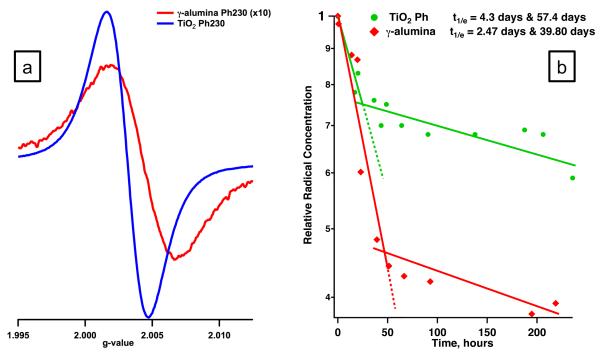
Adsorption of phenol on the surface of both -alumina and titania resulted in formation of surface species with a distinct observable paramagnetic signal (cf. table 1 and Fig. 2). Adsorption of phenol over -alumina produced a paramagnetic signal typical of that observed earlier for transition metal oxides, with a g-value of 2.0043 and peak width of 9.6 gauss. Such signals are typical for surface adsorbed aromatic radicals [1,2]. The broadness of the peak suggested the formation of a combination of more than one type of paramagnetic species. The mechanism of radical formation developed for metal oxides suggests formation of phenoxyl type radicals, in line with observed g-values. In contrast, adsorption of phenol on the titania surface resulted in very narrow signal with a peak width of ~5 gauss indicative of the presence of a single type of radical species with a radical yield ~10 times higher than -alumina. The observed g-value of 2.0032 is characteristic of the radical with an electron present on a carbon atom with a nearby oxygen.
TABLE I.
EPR spectral characteristics of the signal measured upon the exposure to phenol at 505 K.
| Substrate | g- values |
ΔHp-p (Gauss) |
Spins/gram |
|---|---|---|---|
| −alumina | 2.0043 | 9.6 | 7.51 × 10¹⁶ |
| Titania | 2.0032 | 4.92 | 6.00 × 10¹⁷ |
FIG. 2.
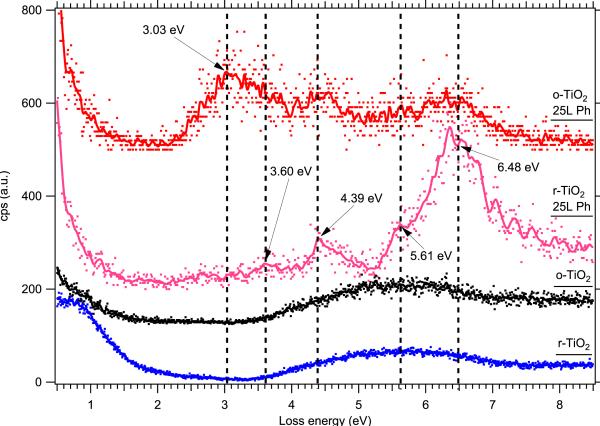
EELS data showing electronic excitations from clean and phenol-covered TiO2(110) single crystals. From bottom to top, we show clean lightly reduced TiO2(110), fully oxidized TiO2(110), 25 L phenol on reduced TiO2(110), and 25 L phenol on oxidized TiO2(110). Phenol dosing, as well as each measurement, was done with the sample held at 90 K. The dots show the raw spectra (normalized to the elastic peak from r-TiO2), and the solid curves show the data smoothed by a binomial algorithm. Vertical dashed lines are guides to the eye.
A closer look at the decay curves of the EPFRs on both surfaces confirms the differences between the adsorption on titania and alumina surfaces. Though no significant peak width or g value change was detected upon the exposure of titania-bound radicals to air, two different decay behaviors were observed with a 1/e half-lives of 4.3 days and 57.4 days. Two explanations are plausible: i) two different radical species with a very similar spectral parameters are present, though with distinguishable decays or ii) two types of surface sites on alumina are responsible for stabilization of radical. Since a relatively low g value was observed, the EPFR signal may have a contribution from a phenyl radical, resulting from the flat interaction of the aromatic ring with the titatnia surface and p -d electron back donation.
Radicals associated with the -alumina surface revealed two separate decay profiles: one with a 1/e half life of only ~2.5 days and a second with a 1/e half-life ~40 days. A correlation between the decay profiles and changes in g values and peak width could be observed. The Hp-p gradually decreased from 9.6 to 8.7 gauss with a simultaneous increase in g-value from 2.0043 to 2.0046. This suggested a low g-value component of the paramagnetic signal was decaying relatively rapidly. The width of the remaining signal suggested a superposition of two species. Based on the shift in the g-value towards 2.0046, the species remaining on the surface were likely phenoxyl and even more persistent o-semiquinone type radicals. Semiquinone radicals result from a reaction between the chemisorbed phenoxyl radical and a surface lattice oxygen atom from the metal oxide [1,2]. Upon electron transfer between the newly formed surface bidentate species and the metal center, a semiquinone radical is formed.
B. EELS studies of phenol adsorption
1. Single-crystal TiO2(110)
In order to determine the changes in electronic structure of adsorbed phenol that indicate radical formation, it is essential to understand the electronic structure of the neutral phenol molecule. Fig. 3 shows the electronic excitations characteristic of phenol adsorbed at low temperature on both partially reduced and fully oxidized TiO2(110) The presence of oxygen vacancies on the clean TiO2 surface is signaled by the loss peak at 0.8 eV (blue spectrum), and these vacancies can be filled, producing a fully stoichiometric TiO2 surface, by dosing ~200 L of O2 at room temperature after sputtering and annealing in vacuum (black spectrum). Surprisingly, after dosing phenol at 90 K, a clear difference between the reduced and oxidized TiO2(110) surfaces is apparent. When phenol is dosed on the reduced surface, shown in the pink spectrum in Fig. 3, we observe loss peaks consistent with those measured for physisorbed benzene on alumina [16] and for phenol in the gas phase [17], which have been assigned to various allowed transitions between molecular orbitals. On the oxidized surface, shown in red, we see a large peak at lower energy (~ 3 eV) which does not appear in the gas phase data from the literature. So while we can be confident that the phenol adsorbed on reduced TiO2(110) at 90 K represents intact physisorbed phenol, the nature of the bonding between phenol and fully oxidized TiO2(110) is not yet understood even at low temperature.
FIG. 3.
(a) EPR spectrum of phenol adsorbed on the surface of -alumina (red) and titania (blue); (b) Semi-log plot of the time decay of EPFRs from alumina (red) and titania (blue).
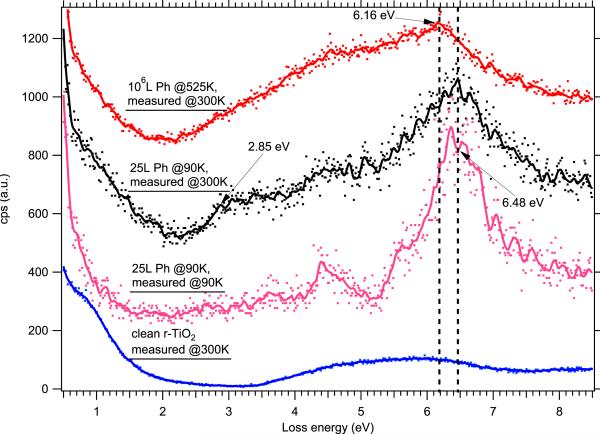
With a spectrum from physisorbed phenol on reduced TiO2(110) as a guide, we can now examine the behavior of phenol deposited under EPFR-forming temperature and pressure conditions to determine any features in the electronic structure that may be hallmarks of the radical species. In Fig. 4, we see few differences between phenol adsorbed at 90 K (pink) and the same sample allowed to warm to room temperature (black). The peak at 6.48 eV is still the most prominent peak in the spectrum (due to a π-π* excitation from phenol), and the others from physisorbed phenol are still apparent, although in the room temperature sample they are convoluted with the usual features from the reduced TiO2(110) – a weak peak due to oxygen vacancies at 0.8 eV and the onset of interband transitions starting at 3.4 eV. We attribute this to the desorption of all but a single layer of phenol when the sample is warmed to room temperature, so that EELS is able to probe features from both the adsorbate and substrate. Interestingly, a peak at about 2.85 eV appears in the room temperature spectrum which is absent from both the spectrum of clean TiO2 and multilayer physisorbed phenol at 90 K. This appears at roughly the same position in energy as the anomalous peak observed from phenol adsorption at 90 K on fully oxidized TiO2(110) in Fig. 3 above, which may indicate some feature of the phenol-TiO2 physisorption that is not shared by the bonding of subsequent phenol multilayers.
FIG. 4.
EELS data showing electronic excitations from phenol adsorbed on lightly reduced TiO2(110) at a variety of dosing and measurement temperatures. From bottom to top, we show clean r-TiO2(110) at 300 K, 25 L phenol on r-TiO2(110) dosed and measured at 90 K, 25 L phenol on r-TiO2(110) dosed at 90 K and allowed to warm to 300 K, and 106 L phenol dosed at 525 K and measured at 300 K. As above, dots show the raw data, and solid curves show the data smoothed by a binomial algorithm. Vertical dashed lines are guides to the eye.
For our purposes, the most important data is the topmost spectrum in Fig. 4 showing the results of 106 L (10−3 Torr, 1000 s) phenol exposed at 525 K. We now do not resolve many distinct peaks, but see a continuum of states starting at approximately 2.2 eV. The distinct peak we can see at 6.18 eV appears to correspond to the most intense allowed transition from the physisorbed phenol, which has been assigned to the 1A1g → 1E1u transition from gas phase data [17], but it is shifted 0.3 eV to lower energy with respect to the same peak measured from physisorbed phenol at both 90 K and 300 K. In combination with the EPR data shown in Fig. 1 from phenol adsorption on particulate titania, it would appear that this shift in the π-π* excitation is the hallmark of the formation of a phenoxyl radical. We do not resolve additional peaks that might be indicative of two different radical species as suggested by Fig. 2(b), but this is consistent with the finding of a single g-value as observed in Fig. 2(a). Density functional calculations to elucidate the differences in molecular orbital structure between the phenol molecule and the phenoxyl radical are an ongoing topic of research.
Examining the low-energy region of the spectra (<1 eV loss energy) in Fig. 4 provides a hint at what may be happening to the titania after the adsorption of phenol. The spectrum from clean r-TiO2(110) shows a loss peak at 0.8 eV characteristic of oxygen vacancies, as mentioned above. The spectrum of multilayer physisorbed phenol at 90 K shows much less intensity in this region, which is consistent with the lack of any observed interband transitions from titania in the spectrum – the EELS probes the multilayer adsorbate but does not “see” the substrate. In both the spectrum from physisorbed phenol at room temperature and the spectrum from 106 L phenol dosed at 525 K, we see substantial intensity in the spectrum below 2 eV. This may be indicative of electron transfer between the adsorbed phenol and titania, with the extra electron occupying the “defect” state that is visible in the clean spectrum.
2. Ultrathin Al2O3 grown on single-crystal NiAl(110)
We have similarly investigated the adsorption behavior of phenol on alumina at high temperature and pressure using EELS. Because bulk alumina is a wide band gap insulator, we prepare a model thin film of alumina by oxidizing a NiAl(110) crystal; using standard methods, this forms a well-ordered alumina film approximately 8 Å thick [13-15], which can be studied using electron spectroscopic methods that require conducting or semiconducting samples. The blue spectra in Fig. 5 show electronic excitations typical of this ultrathin alumina film at room temperature, with a broad loss peak at approximately 1.6 eV due to defects in the film and the onset of allowed interband (band-gap) transitions starting at 7.5 eV. This is practically ideal, as it provides a window in which to observe electronic excitations from phenol, which typically lie in the region from 3 – 7 eV. It is apparent from Fig. 5a that, after dosing 106 L phenol at 525 K as we did on TiO2(110), we observe electronic losses in the alumina band gap region.
FIG. 5.
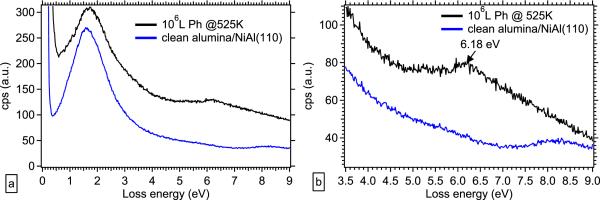
(a) EELS data showing electronic excitations on clean alumina/NiAl(110) measured at 300 K(blue, bottom) and 106 L phenol adsorbed on alumina/NiAl(110) at 525 K and measured at 300 K (black, top); (b) close-up of region from 3.5 – 9 eV in (a).
If we examine the appropriate energy region in more detail (Fig. 5b), we observe the existence of a loss peak at 6.18 eV after the adsorption of 106 L phenol at 525 K, which agrees with the shifted π-π* transition seen in the identical exposure of phenol on TiO2(110) in Fig. 4 above. We see also that the allowed interband transitions from the alumina thin film are no longer visible in the dosed sample, though whether this indicates an alteration in the alumina film itself or merely that it has been completely covered by phenol is not clear from these spectra alone. This new loss peak at 6.18 eV may again be attributed to the presence of a phenoxyl radical. We do not clearly resolve additional peaks that might indicate the additional presence of the o-semiquinone radical indicated by the EPR spectra presented in Fig. 1, but this must be taken as a null result rather than a statement that no additional radical species are present. The lower radical yield over alumina shown in Fig. 1 and Table 1 may explain our inability to resolve the presence of two unique species using EELS.
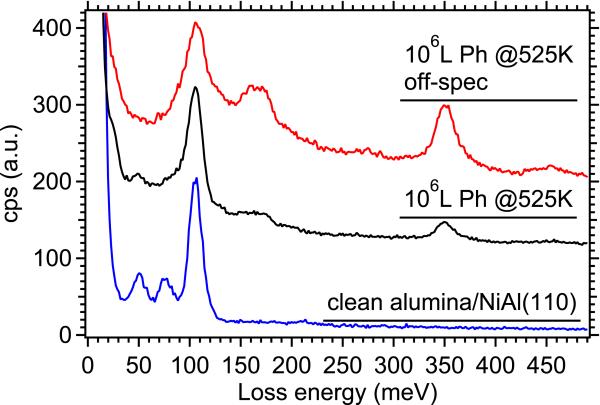
If we choose a lower incident beam energy and examine only the energy losses from 0-500 meV, we can resolve energy losses due to vibrational modes of both the substrate and any adsorbates. The blue spectrum in Fig. 6 shows the vibrational losses from the clean alumina thin film, with strong surface phonon loss peaks at 50, 80, and 103 meV typical of the alumina formed by oxidation of NiAl(110) [13]. After dosing 106 L phenol at 525 K (black spectrum), we see new features appear – several overlapping unresolved peaks between 60-100 meV, several overlapping peaks between 150-200 meV, and a strong peak at 350 meV. Using reference IR absorption data from liquid phenol, we assign the new peaks to the out-of-plane ring C-C bend and out-of-plane C-H bend (60-100 meV), the C-O stretch (~150 meV), the C-C ring stretch (several unresolved peaks between 170-200 meV), and the aromatic C-H stretch (strong peak at 350 meV)[18]. An off-specular scan (red spectrum) shows enhanced intensity in several of the peaks, particularly the C-H stretch and the peaks between 160-200 meV, as well as a small broad peak centered at 450 meV which is usually indicative of an O-H stretch. The enhanced intensity in the peaks previously observed to be dipole-active indicates a tilt of the phenyl ring. The O-H stretching observed in the off-specular spectrum is likely due to slight surface contamination over the timescale of the experiment, as each spectrum takes approximately 12 hours to record in order to achieve an acceptable signal to noise ratio. The absence of a strong O-H peak in the on-specular data (which was taken earliest, while the sample was presumably less contaminated) supports the proposed mechanism discussed earlier, showing chemisorption of the phenol through its hydroxyl substituent.
FIG. 6.
Vibrational EELS spectra of clean alumina/NiAl(110) (blue) and adsorption of 106 L phenol on alumina/NiAl(110) at 525 K, showing both on-specular (black) and off-specular (red) geometry. In this figure, spectra have been normalized to the height of the peak at 103 meV to more clearly show the relative intensity of vibrational peaks. All measurements were taken at room temperature.
IV. CONCLUSION
Correlating EELS measurements of electronic and vibrational structure with EPR determinations of radical species present on titania and alumina allow us to elucidate previously undetermined features of the phenoxyl radicals formed on these two oxides. With reference to the spectrum of electronic excitations from unperturbed phenol molecules physisorbed on TiO2(110) at 90 K, we have shown a distinct shift of 0.3 eV toward lower energy in the most prominent π-π* excitation from phenol after adsorption at 525 K, which is the temperature regime shown in the EPR experiments to form high yields of phenoxyl radicals over both TiO2 and alumina. Given that we observe a peak at the same energy in the spectrum from phenol adsorbed at 525 K on alumina, we take this to be indicative of a unique change in the electronic structure of the phenoxyl radical versus the intact phenol molecule. EELS measurements alone do not permit us to determine the new molecular orbital structure of the phenoxyl radical, but the measurement of the shifted π-π* transition provides a starting point for density functional calculations. Additional confirmation of chemisorption and radical formation comes from the vibrational EELS measurements of phenol on alumina, which show vibrational features of the phenol molecule save for the O-H stretching mode, which is only observed very weakly as a result of slight sample contamination, thus providing additional evidence in support of the generic mechanism of chemisorption through H2O elimination. Neither the EPR nor the EELS measurements unambiguously point to the reduction of either metal oxide after radical formation, although there is some indication in the EELS data from phenol adsorbed on TiO2 of the electrons transferred to the metal oxide from the phenol occupying the commonly observed “defect” state. Photoelectron spectroscopy measurements that probe the core level electronic structure of the alumina and titania before and after phenoxyl radical formation should determine the oxidation state of the metal ion after the chemisorption of the radical.
EPR studies of phenol adsorption on titania and alumina show radical formation at 505 K
EELS of phenol/TiO2(110) at 90 K show π-π* transitions from intact molecule
EELS of phenol/TiO2(110) and phenol/alumina adsorbed at 525 K show shift in π-π*
Shifted π-π* on single crystal corresponds to radical formation conditions in EPR
ACKNOWLEDGEMENTS
We acknowledge support from the National Institute of Environmental Health Sciences Superfund Research Program grant number P42 ES013648-03. PTS and NDK acknowledge partial support through the National Science Foundation under the NSF EPSCoR Cooperative Agreement No. EPS-1003897 and its REU component, with additional support from the Louisiana Board of Regents.
Footnotes
Publisher's Disclaimer: This is a PDF file of an unedited manuscript that has been accepted for publication. As a service to our customers we are providing this early version of the manuscript. The manuscript will undergo copyediting, typesetting, and review of the resulting proof before it is published in its final citable form. Please note that during the production process errors may be discovered which could affect the content, and all legal disclaimers that apply to the journal pertain.
REFERENCES
- [1].Lomnicki S, Truong H, Vejerano E, Dellinger B. Environ. Sci. Technol. 2008;42:4982. doi: 10.1021/es071708h. [DOI] [PubMed] [Google Scholar]
- [2].Vejerano E, Lomnicki S, Dellinger B. Environ. Sci. Technol. 2011;45:589. doi: 10.1021/es102841s. [DOI] [PubMed] [Google Scholar]
- [3].McFerrin CA, Hall RW, Dellinger B. Journal of Molecular Structure: THEOCHEM. 2008;848:16. [Google Scholar]
- [4].dela Cruz ALN, Gehling W, Lomnicki S, Cook R, Dellinger B. Environ. Sci. Technol. 2011;45:6356. doi: 10.1021/es2012947. [DOI] [PMC free article] [PubMed] [Google Scholar]
- [5].Khachatryan L, Vejerano E, Lomnicki S, Dellinger B. Environ. Sci. Technol. 2011;45:8559. doi: 10.1021/es201309c. [DOI] [PMC free article] [PubMed] [Google Scholar]
- [6].Khachatryan L, Dellinger B. Environ. Sci. Technol. 2011;45:9232. doi: 10.1021/es201702q. [DOI] [PMC free article] [PubMed] [Google Scholar]
- [7].Fahmy B, Ding L, You D, Lomnicki S, Dellinger B, Cormier SA. Environmental Toxicology and Pharmacology. 2010;29:173. doi: 10.1016/j.etap.2009.12.007. [DOI] [PMC free article] [PubMed] [Google Scholar]
- [8].Balakrishna S, Lomnicki S, McAvey KM, Cole RB, Dellinger B, Cormier SA. Particle and Fibre Toxicology. 2009;6:11. doi: 10.1186/1743-8977-6-11. [DOI] [PMC free article] [PubMed] [Google Scholar]
- [9].Alderman SL, Farquar GR, Poliakoff ED, Dellinger B. Environ. Sci. Technol. 2005;39:7396. doi: 10.1021/es050063n. [DOI] [PubMed] [Google Scholar]
- [10].Takasuga T, Makino T, Tsubota K, Takeda N. Chemosphere. 2000;40:1003. doi: 10.1016/s0045-6535(99)00345-8. [DOI] [PubMed] [Google Scholar]
- [11].Seames WS. Fuel Processing Technology. 2003;81:109. [Google Scholar]
- [12].Cains PW, McCausland LJ, Fernandes AR, Dyke P. Environ. Sci. Technol. 1997;31:776. [Google Scholar]
- [13].Jaeger RM, Kuhlenbeck H, Freund H-J, Wuttig M, Hoffmann W, Franchy R, Ibach H. Surface Science. 1991;259:235. [Google Scholar]
- [14].Yoshitake M, Mebarki B, Lay T. Surface Science. 2002;511:L313. [Google Scholar]
- [15].Song W, Yoshitake M. Applied Surface Science. 2005;241:164. [Google Scholar]
- [16].Street SC, Guo Q, Xu C, Goodman DW. J. Phys. Chem. 1996;100:17599. [Google Scholar]
- [17].Ari T, Güven H, Ecevit N. Journal of Electron Spectroscopy and Related Phenomena. 1995;73:13. [Google Scholar]
- [18].Silverstein RM, Bassler GC, Morrill TC. Spectrometric Identification of Organic Compounds. 5th ed John Wiley & Sons, Inc; New York: 1991. [Google Scholar]


