

Abstract
This simulator study evaluated the effects of augmented reality (AR) cues designed to direct the attention of experienced drivers to roadside hazards. Twenty-seven healthy middle-aged licensed drivers with a range of attention capacity participated in a 54 mile (1.5 hour) drive in an interactive fixed-base driving simulator. Each participant received AR cues to potential roadside hazards in six simulated straight (9 mile long) rural roadway segments. Drivers were evaluated on response time for detecting a potentially hazardous event, detection accuracy for target (hazard) and non-target objects, and headway with respect to the hazards. Results showed no negative outcomes associated with interference. AR cues did not impair perception of non-target objects, including for drivers with lower attentional capacity. Results showed near significant response time benefits for AR cued hazards. AR cueing increased response rate for detecting pedestrians and warning signs but not vehicles. AR system false alarms and misses did not impair driver responses to potential hazards.
Keywords: Highlighting Cues, Augmented Reality, Driver Distraction, Driver Inattention, Driving
1. Introduction
Safe automobile driving requires drivers to process large amounts of dynamic information under time pressure. However, drivers can attend to only a small percentage of visual stimuli at once. Some objects are easily noticed (i.e., conspicuous) whereas others require more time and effort. Failure to notice less conspicuous objects could result in a serious injury or fatality. Highlighting cues may provide a promising countermeasure to reduce such adverse events. Jonides (1980) found a “dynamic blinking” cue used for highlighting to be effective at attracting attention. Fisher and Tan (1989) found that subjects located a target faster in highlighted displays than in displays with no highlighting. Yeh and Wickens (2001) showed that cueing aided target detection in an aviation visual search task. They found target detection accuracy was enhanced when the object cued was not conspicuous.
Head-up display (HUD) technology has the potential to increase attention to cued elements without adversely affecting attentional resources and reducing the ability to respond to environmental information outside the focus of attention. This advantage may relate to a greater degree of conformal symbology in HUD displays. Conformal symbology links elements of the display image to elements in the far domain and relates to the extent that the display serves as a virtual analog of the far domain elements (Naish, 1964). Lauber, Bray, Harrison, Hemingway, and Scott (1982) and Wickens and Long (1995) found that HUD advantages were enhanced when symbology was conformal. Conformal displays may reduce the tendency to neglect information in the world while attending to the HUD (Caird, Horrey, & Edwards, 2001; Tufano, 1997).
One strategy that emphasizes using HUD technology to present conformal information is augmented reality (AR). AR refers to the combining of real and artificial stimuli, with the aim to improve human performance (Azuma, 1997; Azuma, Baillot, Behringer, Feiner, Julier, & MacIntyre, 2001). This typically involves overlaying computer-generated graphics so that they appear to be embedded in the real world (Kearney, Rizzo, & Severson, 2007). The augmentation may highlight important objects or regions. A limitation of HUD technology is the potential for clutter that may interfere with other items in the panorama (Ververs & Wickens, 1998). Attentional mechanisms may cause HUD images to interfere with attending to objects that would have otherwise been detected. A pilot study showed that static visual cues increased response times (RTs) for detecting hazards due to obstruction (Schall, Rusch, Lee, Vecera, & Rizzo, 2010), possibly due to the non-conformal nature of the static cue, and to the low complexity and cognitive demands of the driving scenarios.
AR technology may serve as a safety countermeasure for drivers with visual attention impairments. Vision is important to driving and driver safety worsens with visual attentional decline. Attentional decline due to advancing age can reduce the useful field of view (UFOV), construed as the portion of the visual field in which information can be acquired during a single glimpse without head or eye movements. UFOV decline increases driver visual search time (Underwood, Crundall, & Chapman, 2002), vehicle stopping distances, and crashes (Myers, Ball, Kalina, Roth, Goode, 2000; Owsley, Ball, McGwin, Sloane, Roenker, White, & Overley, 1998; Rogé & Pébayle, 2009).
On-board driver assist applications may improve the ability to perceive and react to roadway hazards in drivers with age related visual information processing impairments (Ho, Reed, & Spence, 2007; Scott & Gray, 2008). By directing driver attention, these systems may produce safety benefits such as reduced RT to hazardous situations (Ho & Spence, 2005; Scott & Gray, 2008) and reduced collision involvement (Kramer, Cassavaugh, Horrey, Becic, & Mayhugh, 2007; Lee, McGehee, Brown, & Reyes, 2002).
The effectiveness of in-car alerts in directing driver attention to a potential hazard depends on how sensory cues and other salient information capture attention at a particular object or location and context. Some research suggests that a highly salient item (e.g., a red item in a field of green items) will capture attention even when this salient item is never a potential target and, therefore, irrelevant to the task at hand (Theeuwes, 1991, 1992; see Theeuwes, 2010, for a review). Other findings, however, indicate that such attentional capture only occurs for items that are task relevant; attentional capture is contingent on observer goals (Folk, Remington, & Johnston, 1992). Further, attentional capture is reduced under dual-task situations (Boot, Brockmole, & Simons, 2005) and in visually complex displays (Cosman & Vecera, 2009, 2010), two results that suggest that in-car alerts might do little to summon drivers’ attention because driving involves multitasking and searching complex visual scenes.
The primary goal of this study was to determine the costs and benefits of dynamic conformal AR cues to alert experienced drivers to potential roadway hazards. We predicted that these AR cues would not interfere with the perception of non-target objects or with driver performance, including in drivers with reduced attentional abilities. We hypothesized that alerts would help to direct attention to potential hazards. Further, we expected that these benefits should be greatest for those with a higher degree of attentional impairment, as defined by UFOV scores.
2. Method
2.1 Participants
Twenty-seven healthy middle-aged drivers (Mean=45 years, SD=6; males=13, females=14) participated in the study. All participants possessed a valid US driver’s license and were without neurological disease. UFOV scores were gathered through a computerized test that was administered on a touchscreen PC (Edwards et al., 2005) with four tests: 1) processing speed, 2) divided attention, 3) selective attention, and 4) selective attention with a simultaneous same/different discrimination at fixation. A total UFOV score was calculated from addition of the four UFOV subtests. UFOV scores on each subtest represent the threshold in milliseconds at which the individual correctly responds to 75% of the trials (Ball & Owsley, 1992). All participants had normal or corrected to normal vision (determined through near and far visual acuity and contrast sensitivity tests).
On average, participants had 29.1 years (SD=6.3) of driving experience. Fifteen percent reported that they drove 1-50 miles per week, 19 percent reported 51-100 miles per week, 33 percent reported 101-150 miles per week, and 33 percent reported over 150 miles per week. Concerning the number of days driven per week, 7 percent reported that they typically drove 2-3 days per week, 19 reported 4-5 days per week, and 74 reported 6-7 days a week. The average UFOV score was 323.9 (SD=132.8, min=142, max=638), from the normal to mildly impaired range, as would be expected in a group of healthy middle-aged drivers.
2.2 Experimental design
The experiment followed a two-way factorial design with cueing as a within-subject independent variable. Subjects participated in three pairs of driving scenarios. Each pair consisted of an uncued scenario followed by a cued scenario (Figure 1). We refer to these pairs as instances (1, 2, or 3; the second independent variable) from this point forward.
Fig. 1.

Illustrates the presentation order of driving scenarios and how they map on to instances.
The three cued scenarios had different levels of cue accuracy, either: 1) 0% false alarms (FAs) and 0% misses (no cue), 2) 15% FAs, 0% misses, or 3) 15% misses, 0% FAs. The presentation order of cued conditions was between participants. The uncued conditions were not counterbalanced to allow assessment of effects of increasing cue-related training. The road geometry (i.e., landscape, road width, etc.) was similar for all conditions.
To distinguish between cueing and acclimation effects, we analyzed cueing, instance, and the interaction between these factors. A main effect of instance would suggest acclimation whereas main and interaction effects with cueing would indicate costs and benefits of the cues. Of note, trust of in-vehicle technology is linked to warning system reliability and sensitivity settings (Lee & See, 2004). High FA rates associated with high sensitivity can reduce driver trust in the alerting system and annoy the driver, leading to failure to benefit from the warnings and overall increase in driver errors (Ben-Yaacov, Maltz, & Shinar, 2002; Bliss & Acton, 2003; Dingus, McGehee, Manakkal, & Jahns, 1997; Maltz & Shinar, 2004; Wilson, 1996). Reliability of 70% may be a critical crossover point for performance; no automation may be better than automation that is less than 70% reliable (Wickens & Dixon, 2007). This study included false positive AR cues and misses, and system reliability was never less that 85%.
2.3 Apparatus
This study was conducted using the Simulator for Interdisciplinary Research in Ergonomics and Neuroscience (SIREN). This simulator has a four-channel, 150° forward view, and 50° rear view (Lees, Cosman, Fricke, Lee, et al., 2010). An Intel® Pentium® D processor-based PC was used to run the task software. The screen was located in front of a 1994 GM Saturn simulator cab. Two Monsoon flat panel speakers (8.5 × 4.5 inches), mounted on the far left and right of the vehicle dashboard, were used to present instructions from the researchers. Instructions and scenario questions were presented from the speakers at 83 dBA.
2.4 Driving task and display
The primary task involved driving while responding to various targets presented alongside six straight rural roadways (Table 1). Drivers were instructed to respond to potential hazards (pedestrians, vehicles, and warning signs) by flashing their high beams. Targets were not presented as sudden hazards and were never obscured (e.g., by objects in the foreground) unless the driver was “tailgaiting” behind a lead vehicle. Tailgating and obstruction were minimized through a speed control mechanism (described later). Cue presence and reliability (no cues, reliable cues, cues that missed targets, cues with FAs) varied across scenarios. The FAs only occurred when no target or secondary object was displayed and mimicked activity of an oversensitive sensor (e.g., that detects minor debris blowing across the road). Participants occasionally encountered secondary objects presented on the roadside opposite to the primary targets: commercial, recreational, or associated with construction (Table 1). These secondary objects were not classified as hazardous and were not cued.
Table 1.
Description of Targets/Secondary Objects and Categorical Definitions
| Object | Type | Target Object | Secondary Object |
|---|---|---|---|
|
| |||
| Pedestrian | Male | X | |
| Pedestrian | Female | X | |
|
| |||
| Vehicle | Car | X | |
| Vehicle | Truck | X | |
|
| |||
| Warning Sign | Pedestrian | X | |
| Warning Sign | Deer | X | |
|
| |||
| Commercial | Phone Booth | X | |
| Commercial | Dumpster | X | |
|
| |||
| Construction | Construction Trailer | X | |
| Construction | Barrel | X | |
|
| |||
| Recreational Sign | Rest Area | X | |
| Recreational Sign | Recreational Activity | X | |
The cue was presented as a rhombus shape of broken lines that gradually connected to form a closed rhombus (Figure 2). The size, length, and direction of tilt associated with the rhombus elements signaled the position and distance of the primary target. This cue design provided information to the driver without obstructing the target. The converging broken lines conveyed motion. The yellow color communicated a warning rather than an immediate threat. The cue’s visual angle range was the same for all targets: 0.7 degrees at the onset of the cue to 16.73 degrees at the point at which the vehicle passed the cue. The cue was always centered on the target with the base positioned at the same height as the target.
Fig 2.

Illustrates: A) an uncued scenario and B) a cued scenario (with tilted and broken lines).
For cued conditions, the target was highlighted when the driver was within 350 meters of the primary target. The cue was visible between 11 to 13 seconds while the driver was traveling between 96.6 and 112.7 kilometers per hour (60 and 70 mph). The cue was graded over eight levels (every 43.75 m), becoming more opaque and a more fully enclosed rhombus as the participant approached the target. The grading was designed to direct the participant’s attention to the target at every level with increasing opaqueness and to generate abrupt onsets associated with motion.
2.5 Procedure
Each participant received an explanation of the purpose of the study and provided consent. Prior to the drive, participants received instructions on how to operate the vehicle and were allowed to adjust the seat, steering wheel, and mirrors for comfort. Each driver participated in one uncued practice session and one cued practice session prior to starting formal testing scenarios.
In both cued and uncued conditions, participants were instructed to flash their high beams as soon as they could recognize the gender of the pedestrian, if a vehicle was a car or truck, or if a warning was a pedestrian or deer crossing warning sign. Before the first scenario, the participants reviewed a set of images to familiarize themselves with the objects and vocabulary used to label each.
Immediately after the driver flashed the high beams, the target was hidden behind a white box to prevent the driver from identifying the object too soon. As the participant passed by the target, the target and secondary objects disappeared and a recorded question was asked about the presence or absence of a target or secondary object.
A lead vehicle following task made the experience more representative of typical driving situations and engaged drivers so that the targets would be more difficult to perceive, accentuating the potential benefits of cueing. This required drivers to maintain a three to five second headway from a lead vehicle whose speed fluctuated between 96.6 and 112.7 kilometers per hour. The velocity settings were randomized and changed approximately every half mile. If the driver got too close, a message appeared at the bottom of the screen that read, “Too Close” (Figure 2). If the driver got too far behind, a message appeared that read “Not Close Enough” and a following vehicle honked.
The six sections of rural two-lane highway were each approximately nine miles in length (approximately nine minutes in driving time). These were presented with variations on the cue’s reliability. Participants completed the sections in an alternating fashion (back and forth between uncued and cued sections; Figure 1).
Target and secondary objects were always positioned immediately alongside the road (Figure 2). Approximate time to complete each trial depended on velocity and target type. On average, there was 0.5 mile (30 seconds) between each trial. Each object type was counterbalanced to be included on the left or right with an equal distribution on each side. Table 1 lists and defines all the objects. There were 18 events where each event included a target and secondary object question. Of the 18 events, 12 included a secondary object along with the target. The presence of a secondary object was randomized to make it unpredictable.
2.6 Independent and dependent variables
Independent variables included age, gender, UFOV score, condition, and instance. Driving performance was evaluated with the following dependent measures:
2.6.1 Outcomes associated with interference
We predicted that AR cues would not interfere with the perception of non-target objects or with driver performance. Interference was measured through two outcome measures including: question accuracy and headway variation.
Accuracy of responses to questions: The number of times (frequency) a participant correctly identified target and secondary objects in response to questions presented during each scenario.
Headway variation: A summed frequency of the number of times a participant’s headway was less than two or greater than four seconds while the target distance was less than 400 meters.
Attentional ability was examined within each outcome category by investigating main and interaction effects between individual measures and continuous UFOV scores for all drivers. We evaluated the possibility AR cuing might cause more interference for drivers with lower UFOV scores. This would be reflected by lower scores for secondary object questions in the AR cued hazard perception trials relative to uncued trials.
Data on change in lane position and acceleration variation were also collected. No major significant effects were realized and are not presented in this paper. This finding was most likely due to the straight roadway (i.e., no curves).
2.6.2 Outcomes associated with directing attention (through cueing)
We hypothesized that alerts would help to direct attention to potential hazards. Directing attention was measured through two outcome measures: response rate and reaction time.
3. Response rate measured by count: The frequency in which a participant accurately used the high beams when identifying target objects.
4. Reaction time measured by time to target (TTT): The time (sec) from the target when the participant activated the high beams.
We hypothesized that the AR visual cues would increase response rates and TTTs. Larger TTTs indicated a participant responded to the target object sooner. We expected that these benefits should be greatest for those with a higher degree of attentional impairment, as defined by UFOV scores.
3. Results
3.1 Analysis
Likelihood-based methods were used to fit linear mixed models to the data. These models tested for differences between cueing, instance (order of presentation), an interaction between instance and cueing, age (continuous), gender, UFOV score (continuous), and for interactions between UFOV score with cueing and instance. Follow up Bonferroni-adjusted pair-wise tests were conducted among the three groups for the instance variable.
Preliminary analysis showed that cueing accuracy (i.e., FA/miss rate) had no effect as there were no differences among cued conditions. Therefore, cueing was analyzed in general terms with two levels (uncued or cued). Instance was also analyzed in general terms where instance 1 consisted of the first set of uncued and cued scenarios, instance 2 consisted of the second set of uncued and cued scenarios, and instance 3 consisted of the third set of uncued and cued scenarios.
Slopes and standard errors were estimated for covariates (e.g., UFOV), along with linear combinations of slopes when an interaction between covariates and factors was significant. Predicted estimates for the lowest (<=209) and highest (>=384) UFOV scores were plotted to illustrate two-way interactions between UFOV and instance.
We fit our models using SAS Proc Mixed, assuming a compound symmetry correlation structure, which is a type of spherical correlation pattern. This assumption implies that within-subject correlations are unaffected by the elapsed time between observations. Since the time frame for each subject was a single visit, we anticipated that this was a reasonable approximation. As a sensitivity analysis, we double-checked our significant results under the Toeplitz (banded) correlations structure, which allows the correlations to change as a function of the time elapsed. Since the results were very similar, we present only the compound symmetry results, except when indicated otherwise.
3.2 Outcomes associated with interference
There was no main effect of cueing (F(1,117) = 0.10, p>0.05; uncued 95% CI [16.87, 17.44], cued 95% CI [17.07, 17.64]; d= −1.401) nor was there an interaction effect between cueing and instance for question accuracy (all p>0.05). On average, participants answered 17.26 (0.14) questions correctly for both uncued and cued scenarios. The 95% confidence interval (CI) for the main effect of cueing on the question accuracy outcome (uncued minus cued) was −0.47 to 0.08. These findings suggest that there was no interference associated with the cue’s presence (i.e., clutter). Thus there were no negative outcomes (costs) on the perception of non-target objects external to targets.
There was a nearly significant effect showing that participants with the poorest UFOV scores tended to answer fewer questions correctly (F(1,22)=3.89, p=0.06; slope = −0.002, SE =0.001). There was a −0.38 to 0.01 confidence interval for a 100 unit increase in UFOV. These findings were even stronger in the interaction between UFOV and instance, where a negative relationship was found for the first uncued/cued scenarios (F(2,117)=4.66, p=0.01; Table 2 and Figure 3A). The negative relationship found for these first uncued/cued scenarios was stronger than that found in the second and third uncued/cued scenarios. There was no interaction of cueing and UFOV that would have suggested interference with the perception of non-target objects associated with reduced attentional abilities.
Table 2.
Estimated slopes, slope comparisons, standard errors and comparison results for UFOV × Instance1 for Question Accuracy, Pedestrian Count, and Pedestrian TTT
|
Question
Accuracy |
Pedestrian
Count |
Pedestrian TTT | |||||||
|---|---|---|---|---|---|---|---|---|---|
| Slope(SE) | 95% CI | P | Slope(SE) | 95% CI | P | Slope(SE) | 95% CI | P | |
| Instance 1 | −.004(.001) | −0.647,−0.162 | .002 | −.002(.001) | −0.375,−0.108 | .001 | .001(.002) | −0.294,0.457 | .662 |
| Instance 2 | −.001(.001) | −0.380,0.106 | .262 | −.000(.001) | −0.153,0.115 | .777 | −.003(.002) | −0.660,0.093 | .134 |
| Instance 3 | −.000(.001) | −0.269,0.217 | .832 | .000(.001) | −0.093,0.175 | .544 | −.001(.002) | −0.493,0.260 | .532 |
| Instance 1 – Instance 2 | −.003(.001) | −0.520,−0.015 | .038 | −.002(.001) | −0.411,−0.034 | .021 | .004(.001) | 0.109,0.621 | .006 |
| Instance 1 – Instance 3 | −.004(.001) | −0.631, −0.126 | .004 | −.003(.001) | −0.471,−0.094 | .004 | .002(.001) | −0.058,0.454 | .129 |
| Instance 2 – Instance 3 | −.001(.001) | −0.365,0.142 | .385 | −.001(.001) | −0.249,0.128 | .527 | −.002(.001) | −0.423,0.089 | .199 |
Effects of UFOV, stratified by instance, with pairwise comparisons of slopes across instance. Confidence intervals are based upon a 100 unit increase in UFOV.
Fig 3.
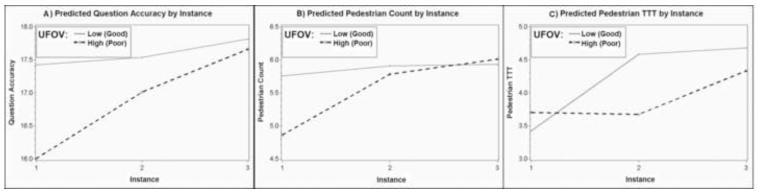
Predicted UFOV estimates for: A) Question Accuracy, B) Pedestrian Count, and C) Pedestrian Time to Target (TTT).
Table 3 presents the results from a linear mixed model comparing headway variation for the three target categories. For age (Table 3), headway variation was poorest for the oldest participants in all target categories: pedestrians (slope = 0.003, SE =0.001, 95% CI [0.000, 0.005]), vehicles (slope = 0.003, SE =0.001, 95% CI [0.001, 0.006]), and warning signs (slope = 0.005, SE=0.002, 95% CI [0.001, 0.009]).
Table 3.
Mixed Effects for Pedestrian Headway Variation (HV), Vehicle HV, Warning Sign HV
| Numerator | Denominator |
Pedestrian
HV |
Vehicle HV |
Warning Sign
HV |
||||
|---|---|---|---|---|---|---|---|---|
| Effect |
Degrees of
Freedom |
Degrees of
Freedom |
F | P | F | P | F | P |
| Cueing | 1 | 116 | 0.04 | 0.85 | 1.32 | 0.25 | 0.45 | 0.50 |
| Instance | 2 | 116 | 0.22 | 0.80 | 3.11 | 0.05 | 2.22 | 0.11 |
| Cueing*Instance | 2 | 117 | 0.41 | 0.66 | 14.90 | <0.01 | 3.19 | 0.04 |
| Age | 1 | 23 | 4.62 | 0.04 | 6.69 | 0.02 | 6.47 | 0.02 |
| Gender | 1 | 22 | 0.15 | 0.71 | 3.15 | 0.09 | 0.03 | 0.87 |
| UFOV | 1 | 22 | 0.04 | 0.84 | 0.22 | 0.65 | 0.09 | 0.77 |
| UFOV*Cueing | 1 | 116 | 0.02 | 0.89 | 0.09 | 0.77 | 0.15 | 0.69 |
| UFOV*Instance | 2 | 116 | 0.36 | 0.70 | 0.66 | 0.52 | 0.06 | 0.94 |
A borderline significant main effect of instance was found for headway variation while approaching a target vehicle (p=0.05); however, the analysis based on the Toeplitz correlation structure was not significant (p=0.07). A significant interaction between instance and cueing was found for headway variation while approaching vehicles (p<0.01) and warning signs (p=0.04). While approaching vehicles participants failed to maintain 3-5 seconds headway more frequently in the first instance of the uncued scenario (Mean=0.19, SE=0.01, 95% CI [0.166, 0.224]) than all other scenarios (Mean=0.01, SE=0.02, 95% CI [.009, .040], d= 14.632; p<0.05). There were no significant differences between the first cued scenario and all later scenarios that would suggest interference with driver performance associated with headway variation while approaching pedestrians or vehicles. For warning signs, drivers failed to maintain 3-5 seconds headway more frequently in the first instance of the uncued scenario (Mean=0.11, SE=0.02, 95% CI [0.075, 0.137]) than all other scenarios (Mean=0.02, SE=0.02, 95% CI [−0.002, 0.043], d= 6.253; p<0.05) except the first cued scenario (Mean=0.06, SE=0.02, 95% CI [0.025, 0.089], d= 3.073).
3.3 Outcomes associated with directing attention
3.3.1 Response rate (Count)
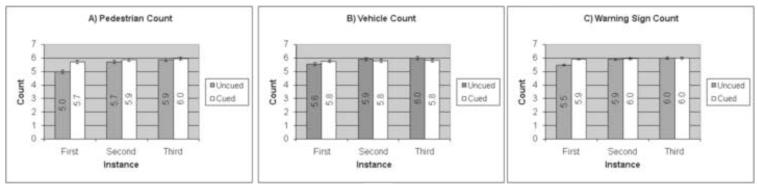
Cueing provided a benefit that diminished with exposure for pedestrian count (uncued instance one 95% CI [4.750, 5.217], all later uncued/cued instances 95% CI [5.707, 5.934], d= −9.064; p=0.03) and warning signs (uncued instance one 95% CI [5.348, 5.630], all later uncued/cued instances 95% CI [5.889, 6.028], d= −8.412; p<0.01) (Table 4). Figure 4 presents means and standard errors of each condition. In characterizing these findings by age, pedestrian count was smaller for older participants than for younger participants (F(1,23)=12.79, p<0.01; slope = −0.034, SE =0.009, 95% CI [−0.053, −0.014]).
Table 4.
Mixed Effects for Response Rate: Pedestrian Count, Vehicle Count, Warning Sign Count
| Numerator | Denominator |
Pedestrian
Count |
Vehicle Count |
Warning Sign
Count |
||||
|---|---|---|---|---|---|---|---|---|
| Effect |
Degrees of
Freedom |
Degrees of
Freedom |
F | P | F | P | F | P |
| Cueing | 1 | 116 | 0.00 | 0.95 | 0.16 | 0.69 | 0.10 | 0.75 |
| Instance | 2 | 116 | 0.57 | 0.57 | 0.72 | 0.49 | 0.08 | 0.92 |
| Cueing*Instance | 2 | 117 | 3.75 | 0.03 | 1.73 | 0.18 | 5.20 | <0.01 |
| Age | 1 | 23 | 12.79 | <0.01 | 0.15 | 0.70 | 2.25 | 0.15 |
| Gender | 1 | 23 | 0.87 | 0.36 | 0.49 | 0.49 | 1.56 | 0.22 |
| UFOV | 1 | 23 | 3.46 | 0.08 | 2.44 | 0.13 | 0.22 | 0.65 |
| UFOV*Cueing | 1 | 116 | 1.82 | 0.18 | 0.29 | 0.59 | 2.01 | 0.16 |
| UFOV*Instance | 2 | 116 | 4.90 | <0.01 | 0.48 | 0.62 | 0.80 | 0.45 |
Fig. 4.
Shows a comparison of A) Pedestrian Count, B) Vehicle Count, and C) Warning Sign Count in cued versus uncued scenarios across all instances.
For pedestrian count, participants with the poorest UFOV scores detected fewer pedestrians in the first instance of scenarios (Table 4 and Figure 3B). The negative relationship for the first scenario was stronger than in the later scenarios (Table 2).
3.3.2 Reaction time (Time to Target)
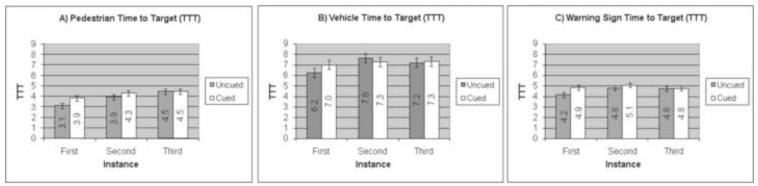
Table 5 presents the results from a linear mixed model comparing time to target (TTTs) for the three target categories. Pedestrian TTT for the first instance of scenarios (Mean=3.48, SE=0.23, 95% CI [2.994, 3.947]) was less than the TTT for all later instances (Mean=4.30, SE=0.23, 95% CI [3.835, 4.742], d= −3.599; p<0.05). Warning sign TTT for the first instance of scenarios (Mean=4.51, SE=0.21, 95% CI [4.094, 4.935]) was less than the TTT for the second instance of scenarios (Mean=4.94, SE=0.21, 95% CI [4.514, 5.365], d= −2.046; p<0.01). There were consistent near significant interaction effects of cueing and instance on all TTT responses (F(2,117)=2.95, p=0.06), which occurred for all specific targets in pedestrian, vehicle, and warning sign TTTs (all p<=0.10) (Table 5). Figure 5 presents means and standard errors of each condition.
Table 5.
Mixed Effects for Pedestrian TTT, Vehicle TTT, Warning Sign TTT
| Numerator | Denominator |
Pedestrian
TTT |
Vehicle TTT |
Warning Sign
TTT |
||||
|---|---|---|---|---|---|---|---|---|
| Effect |
Degrees of
Freedom |
Degrees of
Freedom |
F | P | F | P | F | P |
| Cueing | 1 | 116 | 0.06 | 0.80 | 0.23 | 0.63 | 2.96 | 0.09 |
| Instance | 2 | 116 | 9.88 | <0.01 | 2.25 | 0.11 | 5.57 | <0.01 |
| Cueing*Instance | 2 | 117 | 2.31 | 0.10 | 2.61 | 0.08 | 2.74 | 0.07 |
| Age | 1 | 23 | 0.84 | 0.37 | 2.07 | 0.16 | 2.78 | 0.11 |
| Gender | 1 | 23 | 1.58 | 0.22 | 2.43 | 0.13 | 1.19 | 0.29 |
| UFOV | 1 | 23 | 0.40 | 0.53 | 0.37 | 0.55 | 0.16 | 0.70 |
| UFOV*Cueing | 1 | 116 | 0.70 | 0.41 | 0.02 | 0.88 | 0.47 | 0.49 |
| UFOV*Instance | 2 | 116 | 4.00 | 0.02 | 1.08 | 0.34 | 2.92 | 0.06 |
Fig. 5.
Shows a comparison of A) Pedestrian TTT, B) Vehicle TTT, and C) Warning Sign TTT in cued versus uncued scenarios across all instances.
There was a main effect of instance on the overall average of TTT (F(2,116)=7.94, p<0.01) and a nearly significant interaction between instance and UFOV(F(2,116)=2.94, p=0.06; see Table 2 for CIs in all categories). Pedestrian TTT was smallest for participants with the poorest UFOV scores for the first instance of scenarios (slope =−0.004, SE =0.001, p=.006). Further, there were a number of negative relationships with UFOV scores where the effects on the first instance were stronger than those found with the second and third instances. These results show that adaptation was slower for participants with lower UFOV scores. The effect of UFOV on pedestrian TTT (Table 5 and Figure 3C) was more negative for the first instance of scenarios than for the second instance of scenarios.
4. Discussion
This study investigated potential costs and benefits of using dynamic conformal AR cues to direct the attention of healthy middle-aged drivers to potential roadway hazards. The results revealed no costs associated with interference. AR cues improved response rate and showed near significant effects that suggest improvement in response times relative to uncued conditions, as predicted. A secondary objective was to investigate the effects of AR cues with respect to attentional abilities (measured by UFOV). AR cues did not cause interference for drivers with lower attentional capacity. There was no indication that the cues would result in any added benefits for these drivers relative to individuals with high attentional abilities.
4.1 Costs associated with interference
There were no significant effects associated with cueing for question accuracy, regarding perception of secondary objects, which suggests that cueing was not causing interference. Because the mean difference and the confidence interval were small we think there is a good argument that the data support this argument. Based on the confidence interval, the largest likely positive effect of cueing was less than half a point (0.47) on an 18-point scale. Further, on average, headway variation was better for all later scenarios that followed the first uncued scenario. Because these findings involved an interaction with cueing it is hard to rule out that cue-related training might have helped participants to offload some of the cognitive demands associated with detecting targets. Further, subsequent to collecting data for the current study, we replicated the same overall pattern of findings in another study that investigated older driver performance (Schall et al, under review), suggesting that this pattern is unlikely to be an artifact of the small sample size.
A pilot test study showed that static visual cues can increase drivers’ RTs for detecting hazards by obstructing objects (Schall et al., 2010). Static cues involved enclosed non-changing opaque rhombus shapes. These features made it complicated to discriminate information about the targets in which they highlighted. In contrast, dynamic cues (comparable to the cues used in this study) which were tested in comparison to the static cues did not appear to produce any negative masking effects. A shortcoming of the Schall et al. study was the lack of complexity of the driving scenarios. The low complexity of the scenarios produced a ceiling effect, inasmuch as the hazards were easily perceived and the alerts were superfluous for the driver. The current study examined added complexity that was more representative of actual roadways. Simulators must place drivers in situations which represent enough complexity as would be found in the real-world to accurately assess whether cueing would have a benefit. Based on drivers’ limited attentional capacity, cueing is likely to provide a benefit when drivers must perform more than one driving-related task. If cueing were to interfere with attention to the roadway we might have observed poorer performance in headway variation in cued scenarios relative to uncued scenarios.
4.2 Benefits associated with directing attention
Cueing, instance, and an interaction of the two factors were analyzed to differentiate between effects due to cue-related training versus acclimation. Differences found with a main effect on instance were suggestive of acclimation and differences found with an interaction between cueing and instance were suggestive of effects related to the cueing. Differences in response rate showed that drivers tended to respond to one to two more targets in all scenarios that followed the first uncued scenario. Further, the TTT provided evidence that the AR cues may reduce drivers’ response time. A near significant effect for overall TTT suggests drivers responded 800 ms more quickly in all scenarios that followed the first uncued scenario. These findings provide support for potential benefits and show that changes in performance occurred as a result of cue-related training that carried over to later uncued conditions.
4.3 Limitations
A limitation on findings associated with question accuracy (perception of secondary objects) was that secondary objects were always positioned in a fixed position immediately alongside the road. Given a design that included objects in a variety of positions across a wider field of view, there may have been more variability. Another limiting factor on question accuracy was the chosen rural environment. In a study of driver distraction Lee, Caven, Haake, and Brown (2001) found impairment (increased RT) depended on scene complexity. While no greater benefit was observed for those with UFOV impairment in this study, such a benefit might be seen with more complex driving scenes. Likewise, more complex HUD imagery might interfere with attention to the road.
In cases where response rate benefits were only found for pedestrians and warning signs we identified two limiting factors in detecting targets. First, consistent with Yeh and Wickens (2001), cue salience played a role in the ability of a participant to detect targets. In comparison to vehicles, pedestrians and warning signs were more difficult to see (because of less color contrast) and thus easier to miss. The cue helped to ensure that drivers perceived targets. Second, target visibility played a role in the ability of a participant to perceive targets. Most vehicles were visible before the cue appeared. In some cases participants responded to them even before the cue appeared. This level of visibility caused vehicles to be more conspicuous than pedestrians and warning signs and thus unlikely that they would be missed. Thus we conclude that cues were not as beneficial at drawing attention to them relative to pedestrians and warning signs.
Cueing was found to provide a benefit early (i.e., immediately after the first uncued scenario), but not later (i.e., after all other scenarios). Whether this is due to cue-related training or simply acclimation to the scenario that would have happened without cueing is an argument that merits discussion. Differences were found for the main effect of instance for pedestrian and warning sign TTT. These results may suggest acclimation. Results associated with cue-related training and TTT may have been limited because targets were frequent and not unexpected (i.e., vigilance effects). Borowsky, Shinar, and Oron-Gilad (2010) found differences in drivers’ ability to detect unseen hazards in critical contexts such as a child that might into the street from between parked cars versus hazards that were less imminent. If the targets in this study had been presented in a way that would have made them more difficult to perceive (e.g., a pedestrian hidden by a vehicle) we may have realized a greater benefit for the AR cueing.
The population tested in this study involved healthy middle-aged drivers who rarely exhibit major UFOV loss. UFOV decrements increase with age. The drivers in this study had a range of attentional abilities, although none could be characterized as highly “at risk” based on their UFOV scores. Notwithstanding, we found that individuals with poorer UFOV responded less frequently to targets and less accurately to questions than those individuals with better UFOV scores. These influences were present in relationship to instance, but not for cueing. There was no indication that the cues would be any more beneficial as a countermeasure for individuals with low attentional abilities relative to individuals with high attentional abilities. Given a wider range of UFOV scores, we might have observed more significant differences to support the benefits of such a countermeasure.
4.4 Conclusions
AR cues may offer a promising means to improve driver safety, potentially reducing response time and increasing hazard detection likelihood. We found no evidence that the AR cues interfered with the perception of non-target cues in the periphery or with driver performance. We did not find any significant negative costs related to the cue’s presence (e.g., interference) in general or associated with individuals with UFOV impairment.
These findings suggests that AR cueing merits further investigation. Future studies would benefit from larger sample sizes, as our somewhat modest sample raised the possibility that some of the factors that were non-significant may have had some effects that we were unable to detect. Future studies might also apply a between-subject study design (i.e., one group receiving all both cued and uncued scenarios and one group receiving only uncued scenarios) that would provide stronger support for distinguishing benefits from cue-related training versus acclimation.
Research Highlights.
Carefully designed augmented reality (AR) cueing will not cause interference
AR cueing can potentially improve response time
AR cueing can help increase response rate
Automation with minimal false alarms and misses will not impair driver responses
AR cueing can help drivers with low attentional capacity
Acknowledgments
The funding for this study was made possible by Grants from the National Institute on Aging through the National Institute of Health (NIH R01AG026027) and from support provided through the Iowa Injury Prevention Research Center and Iowa Center for Research by Undergraduates.
Footnotes
Preliminary results from this study were also presented at the 90th Annual Meeting of the Transportation Research Board.
Publisher's Disclaimer: This is a PDF file of an unedited manuscript that has been accepted for publication. As a service to our customers we are providing this early version of the manuscript. The manuscript will undergo copyediting, typesetting, and review of the resulting proof before it is published in its final citable form. Please note that during the production process errors may be discovered which could affect the content, and all legal disclaimers that apply to the journal pertain.
Contributor Information
Michelle L. Rusch, University of Iowa College of Medicine, Department of Neurology Department of Mechanical and Industrial Engineering 200 Hawkins Drive Iowa City, IA 52242.
Mark C. Schall, Jr., University of Iowa College of Medicine, Department of Neurology Department of Mechanical and Industrial Engineering 200 Hawkins Drive Iowa City, IA 52242 Phone: (319) 356-2240 Fax: (319) 384-7199 mark-schall@uiowa.edu
Patrick Gavin, University of Iowa College of Medicine, Department of Neurology Department of Mechanical and Industrial Engineering 200 Hawkins Drive Iowa City, IA 52242 Phone: (319) 356-2240 Fax: (319) 384-7199 patrick-gavin@uiowa.edu.
John D. Lee, University of Wisconsin-Madison Department of Industrial and Systems Engineering 1513 University Avenue, 3007 Mechanical Engineering Madison, WI 53706-1572 Phone: (608) 890-3168 jdlee@engr.wisc.edu
Jeffrey D. Dawson, University of Iowa Department of Biostatistics 105 River Street, S-145 CPHB Iowa City, IA 52242 Phone: (319) 384-1510 jeffrey-dawson@uiowa.edu
Shaun Vecera, University of Iowa Department of Psychology E125 Seashore Hall Iowa City, IA 52242 Phone: (319) 335-0839 shaun-vecera@uiowa.edu.
Matthew Rizzo, University of Iowa College of Medicine, Department of Neurology 200 Hawkins Drive Iowa City, IA 52242 Phone: (319) 356-8748 Fax: (319) 384-7199 matthew-rizzo@uiowa.edu.
References
- Azuma R. A survey of augmented reality. Teleoperators and Virtual Environments. 1997;6(4):355–385. [Google Scholar]
- Azuma R, Baillot Y, Behringer R, Feiner S, Julier S, MacIntyre B. Recent advances in augmented reality. IEEE Computer Graphics and Applications. 2001;21(6):34–47. [Google Scholar]
- Ball K, Owsley C. The Useful Field of View Test: A new technique for evaluating age-related declines in visual function. Journal of the American Optometric Association. 1992;64:71–79. [PubMed] [Google Scholar]
- Bliss JP, Acton SA. Alarm mistrust in automobiles: How collision alarm reliability affects driving. Applied Ergonomics. 2003;34(6):499–509. doi: 10.1016/j.apergo.2003.07.003. [DOI] [PubMed] [Google Scholar]
- Borowsky A, Shinar D, Oron-Gilad T. Age, skill, and hazard perception in driving. Accident; Analysis and Prevention. 2010;42(4):1240–1249. doi: 10.1016/j.aap.2010.02.001. [DOI] [PubMed] [Google Scholar]
- Caird JK, Horrey WJ, Edwards CJ. Effects of conformal and non-conformal vision enhancement systems on older driver performance. Transportation Research Record. 2001;1759:38–45. [Google Scholar]
- Cosman JD, Vecera SP. Perceptual load modulates attentional capture by abrupt onsets. Psychonomic Bulletin & Review. 2009;16:404–410. doi: 10.3758/PBR.16.2.404. [DOI] [PubMed] [Google Scholar]
- Cosman JD, Vecera SP. Attentional capture by motion onsets is modulated by perceptual load. Attention, Perception, & Psychophysics. 2010;72:2096–2105. doi: 10.3758/bf03196686. [DOI] [PubMed] [Google Scholar]
- Dingus TA, Mcgehee DV, Manakkal N, Jahns SK, Carney C, Hankey JM. Human factors field evaluation of automotive headway maintenance/collision warning devices. Human Factors. 1997;39(2):216–229. doi: 10.1518/001872097778543930. [DOI] [PubMed] [Google Scholar]
- Edwards JD, Vance DE, Wadley VG, Cissell GM, Roenker DL, Ball KK. Reliability and validity of useful field of view test scores as administered by personal computer. Journal of Clinical and Experimental Neuropsychology. 2005;27:529–543. doi: 10.1080/13803390490515432. [DOI] [PubMed] [Google Scholar]
- Fisher DL, Tan KC. Visual displays: The highlighting paradox. Human Factors. 1989;31(1):17–30. doi: 10.1177/001872088903100102. [DOI] [PubMed] [Google Scholar]
- Folk CL, Remington RW, Johnston JC. Involuntary covert orienting is contingent on attentional control settings. Journal of Experimental Psychology: Human Perception and Performance. 1992;18:1030–1044. [PubMed] [Google Scholar]
- Hills BL. Vision, visibility, and perception in driving. Perception. 1980;9(2):183–216. doi: 10.1068/p090183. [DOI] [PubMed] [Google Scholar]
- Ho C, Reed N, Spence C. Multisensory in-car warning signals for collision avoidance. Human Factors. 2007;49(6):1107–1114. doi: 10.1518/001872007X249965. [DOI] [PubMed] [Google Scholar]
- Ho C, Spence C. Assessing the effectiveness of various auditory cues in capturing a driver’s visual attention. Journal of Experimental Psychology.Applied. 2005;11(3):157–174. doi: 10.1037/1076-898X.11.3.157. [DOI] [PubMed] [Google Scholar]
- Jonides J. Voluntary versus automatic control over the mind’s eye’s movement. In: Long JB, Baddeley AD, editors. Attention and performance IX. Erlbaum; Hillsdale, NJ: 1980. pp. 187–203. [Google Scholar]
- Kearney JK, Rizzo M, Severson J. Virtual reality and neuroergonomics. In: Parasuraman R, Rizzo M, editors. Neuroergonomics: The brain at work. Oxford University Press; New York, NY: 2007. pp. 253–274. [Google Scholar]
- Kramer AF, Cassavaugh N, Horrey WJ, Becic E, Mayhugh JL. Influence of age and proximity warning devices on collision avoidance in simulated driving. Human Factors. 2007;49(5):935–949. doi: 10.1518/001872007X230271. [DOI] [PubMed] [Google Scholar]
- Lauber JK, Bray RS, Harrison RL, Hemingway JC, Scott BC. An operational evaluation of head up displays for civil transport operations. NASA/FAA phase 3 report. NASA Ames Research Center; Moffett Field, CA: 1982. No. A-8477; HUD-16; NAS 1.60:1815; NASA-TP-1815) [Google Scholar]
- Lee JD, See KA. Trust in technology: Designing for appropriate reliance. Human Factors. 2004;46(1):50–80. doi: 10.1518/hfes.46.1.50_30392. [DOI] [PubMed] [Google Scholar]
- Lee JD, McGehee DV, Brown TL, Reyes ML. Collision warning timing, driver distraction, and driver response to imminent rear-end collisions in a high-fidelity driving simulator. Human Factors. 2002;44(2):314–334. doi: 10.1518/0018720024497844. [DOI] [PubMed] [Google Scholar]
- Lee JD, Caven B, Haake S, Brown TL. Speechbased interaction with in-vehicle computers: The effect of speech-based e-mail on drivers’ attention to the roadway. Human Factors. 2001;43:631–640. doi: 10.1518/001872001775870340. [DOI] [PubMed] [Google Scholar]
- Lees MN, Cosman JD, Fricke N, Lee JD, Rizzo M. Translating cognitive neuroscience to the driver’s operational environment: a neuroergonomics approach. American Journal of Psychology. 2010;123(4):391–411. doi: 10.5406/amerjpsyc.123.4.0391. [DOI] [PMC free article] [PubMed] [Google Scholar]
- Liu Y. Effects of using head-up display in automobile context on attention demand and driving performance. Displays. 2003;24(4-5):157–165. [Google Scholar]
- Maltz M, Shinar D. Imperfect in-vehicle collision avoidance warning systems can aid drivers. Human Factors. 2004;46(2):357–366. doi: 10.1518/hfes.46.2.357.37348. [DOI] [PubMed] [Google Scholar]
- Matsukura M, Brockmole JR, Boot WR, Henderson JM. Oculomotor capture during real-world scene viewing depends on cognitive load. Vision Research. 2011;51(6):546–552. doi: 10.1016/j.visres.2011.01.014. [DOI] [PubMed] [Google Scholar]
- Myers RS, Ball KK, Kalina TD, Roth DL, Goode KT. Relation of useful field of view and other screening tests to on-road driving performance. Perceptual and Motor Skills. 2000;91(1):279–290. doi: 10.2466/pms.2000.91.1.279. [DOI] [PubMed] [Google Scholar]
- Naish JM. Combination of information in superimposed visual fields. Nature. 1964;202:641–646. doi: 10.1038/202641a0. [DOI] [PubMed] [Google Scholar]
- Owsley C, Ball K, McGwin G, Jr, Sloane ME, Roenker DL, White MF, Overley ET. Visual processing impairment and risk of motor vehicle crash among older adults. JAMA : The Journal of the American Medical Association. 1998;279(14):1083–1088. doi: 10.1001/jama.279.14.1083. [DOI] [PubMed] [Google Scholar]
- Rogé J, Pébayle T. Deterioration of the useful visual field with ageing during simulated driving in traffic and its possible consequences for road safety. Safety Science. 2009;47(9):1271–1276. [Google Scholar]
- Schall MC, Jr., Rusch ML, Lee JD, Dawson JD, Thomas G, Aksan N, Rizzo M. Augmented reality cues and elderly driver hazard perception. Human Factors. doi: 10.1177/0018720812462029. (under review) [DOI] [PMC free article] [PubMed] [Google Scholar]
- Schall M, Jr., Rusch M, Lee J, Vecera S, Rizzo M. Attraction without distraction: Effects of augmented reality cues on driver hazard perception. Journal of Vision. 2010;10(7):236–236. [Google Scholar]
- Scott JJ, Gray R. A comparison of tactile, visual, and auditory warnings for rear-end collision prevention in simulated driving. Human Factors. 2008;50(2):264–275. doi: 10.1518/001872008X250674. [DOI] [PubMed] [Google Scholar]
- Theeuwes J. Exogenous and endogenous control of attention: The effects of visual onsets and offsets. Perception & Psychophysics. 1991;49:83–90. doi: 10.3758/bf03211619. [DOI] [PubMed] [Google Scholar]
- Theeuwes J. Perceptual selectivity for color and form. Perception and Psychophysics. 1992;51:599–606. doi: 10.3758/bf03211656. [DOI] [PubMed] [Google Scholar]
- Theeuwes J. Top–down and bottom–up control of visual selection. Acta Psychologica. 2010;135(2):77–99. doi: 10.1016/j.actpsy.2010.02.006. [DOI] [PubMed] [Google Scholar]
- Tufano DR. Automotive HUDs: The Overlooked Safety Issues. Human Factors. 1997;39(2):303–311. doi: 10.1518/001872097778543840. [DOI] [PubMed] [Google Scholar]
- Underwood G, Crundall D, Chapman P. Selective searching while driving: The role of experience in hazard detection and general surveillance. Ergonomics. 2002;45(1):1–12. doi: 10.1080/00140130110110610. [DOI] [PubMed] [Google Scholar]
- Ververs PM, Wickens CD. Head-up displays: Effects of clutter, display intensity, and display location on pilot performance. The International Journal of Aviation Psychology. 1998;8(4):377–403. doi: 10.1207/s15327108ijap0804_4. [DOI] [PubMed] [Google Scholar]
- Walter R, Boot WR, Brockmole JR, Simons DJ. Attention capture is modulated in dual-task situations. Psychonomic Bulletin & Review. 2005;12(4):662–668. doi: 10.3758/bf03196755. [DOI] [PubMed] [Google Scholar]
- Wickens CD, Dixon SR. The benefits of imperfect diagnostic automation: A synthesis of the literature. [The benefits of imperfect diagnostic automation: a synthesis of the literature] Theoretical Issues in Ergonomics Science. 2007;8(3):201–212. [Google Scholar]
- Wickens CD, Long J. Object versus space-based models of visual attention: Implications for the design of head-up displays. Journal of Experimental Psychology: Applied. 1995;1(3):179–193. [Google Scholar]
- Wilson T. IVHS countermeasures for rear-end collisions. Peer Review of the National Highway Traffic Safety Administration Program. 1996:19–26. [Google Scholar]
- Yeh M, Wickens CD. Display signaling in augmented reality: Effects of cue reliability and image realism on attention allocation and trust calibration. Human Factors. 2001;43(3):355–365. doi: 10.1518/001872001775898269. [DOI] [PubMed] [Google Scholar]