

Abstract
The grading system for pancreatic neuroendocrine tumors (PanNETs) adopted in 2010 by the World Health Organization (WHO) mandates the use of both mitotic rate and Ki67/MIB-1 index in defining the proliferative rate and assigning the grade. In cases when these measures are not concordant for grade, it is recommended to assign the higher grade, but specific data justifying this approach do not exist. Thus, we counted mitotic figures and immunolabeled, using the Ki67 antibody, 297 WHO mitotic grade 1 and 2 PanNETs surgically resected at a single institution. We quantified the Ki67 proliferative index by marking at least 500 cells in “hot spots” and by using digital image analysis software to count each marked positive/negative cell and then compared the results with histologic features and overall survival. Of 264 WHO mitotic grade 1 PanNETs, 33% were WHO grade 2 by Ki67 proliferative index. Compared with concordant grade 1 tumors, grade-discordant tumors were more likely to have metastases to lymph node (56% vs. 34%) (P < 0.01) and to distant sites (46% vs. 12%) (P < 0.01). Discordant mitotic grade 1 PanNETs also showed statistically significantly more infiltrative growth patterns, perineural invasion, and small vessel invasion. Overall survival was significantly different (P < 0.01), with discordant mitotic grade 1 tumors showing a median survival of 12 years compared with 16.7 years for concordant grade 1 tumors. Conversely, mitotic grade 1/Ki67 grade 2 PanNETs showed few significant differences from tumors that were mitotic grade 2 and either Ki67 grade 1 or 2. Our data demonstrate that mitotic rate and Ki67-based grades of PanNETs are often discordant, and when the Ki67 grade is greater than the mitotic grade, clinical outcomes and histopathologic features are significantly worse than concordant grade 1 tumors. Patients with discordant mitotic grade 1/Ki67 grade 2 tumors have shorter overall survival and larger tumors with more metastases and more aggressive histologic features. These data strongly suggest that Ki67 labeling be performed on all PanNETs in addition to mitotic rate determination to define more accurately tumor grade and prognosis.
Keywords: pancreatic neuroendocrine tumor, pancreas, pancreatic cancer, pancreatic endocrine neoplasm, islet cell tumor, Ki67, neuroendocrine tumor, gastroenteropancreatic neuroendocrine tumor, endocrine neoplasm
Pancreatic neuroendocrine tumors (PanNETs), although less common than pancreatic ductal adenocarcinoma, are associated with poor clinical outcomes, with a 10-year overall survival of 45%.1–3 PanNETs occur most frequently in adults between 40 and 60 years of age and display no sex predilection.4 According to the World Health Organization (WHO) 2010 Classification of Tumors of the Digestive System, PanNETs may be placed into three grades on the basis of mitotic count and the Ki67 proliferative index: G1: mitotic count of <2 per 10 high-power fields (hpf) and <3% Ki67 index; G2: mitotic count of 2 to 20/10 hpf or 3% to 20% Ki67 index; G3: mitotic count of >20/10 hpf or >20% Ki67 index.1 The G1 and G2 PanNETs are regarded to be well-differentiated, whereas G3 neoplasms are poorly differentiated (high-grade) neuroendocrine carcinomas (small cell carcinoma and large cell neuroendocrine carcinoma). This grading system was based on a growing body of evidence linking proliferation rate with patient outcome. Standardization of grading has helped clinicians prognosticate outcome for their patients and is central to the design of clinical trials of new therapeutic agents.5,6
The best method to calculate the Ki67-labeling index remains controversial, as does the relative value of counting mitoses versus Ki67 labeling in determining the proliferative index.7,8 A number of recent studies have evaluated different methods to count Ki67-positive cells in PanNETs. It has been recommended to count 500 to 2000 cells in the regions of the tumor with the highest labeling rate (hot spots), and the use of digital image analysis may be superior to the commonly used “eyeballed estimation” method.8 When the mitotic rate and Ki67 index indicate different grades, it is recommended to assign the higher grade, but studies have not systematically assessed whether the outcome of these “discordant” tumors more closely parallels the mitotic rate or the Ki67 index. Yet, with the recent introduction of effective targeted therapies such as the mTOR pathway inhibitor everolimus and the multiple tyrosine kinase inhibitor sunitinib, accurate prognostication is potentially more important than ever.
The purpose of this study was to compare two parameters for determining the proliferation index, counting mitoses and Ki67 immunolabeling, in a large single-institution series of surgically resected PanNETs by examining the histopathologic features and survival outcomes of PanNETs with concordant and discordant Ki67 and mitotic grades.
Materials and Methods
Appropriate institutional approval was obtained for this study.
We reviewed the Surgical Pathology files of the Johns Hopkins Hospital Department of Pathology for patients with pancreatic resections with a final diagnosis of PanNET from 1984 to 2009. This query yielded 361 cases with slides available for review. Available pathology reports and medical records were reviewed to obtain clinical data (distant metastases present at the time of resection, functionality, and associated genetic syndromes) (Tables 1 and 2). The slides were then reviewed for various histologic features: perineural, small vessel, and large vessel invasion, the presence of necrosis, and growth pattern (circumscribed vs. infiltrative [growth into the surrounding normal pancreas]). On the basis of mitotic rate, 297 cases were determined to be either G1 or G2 (see details in Table 2 and Fig. 1). All grades were assigned according to 2010 WHO recommendations. We determined mitotic rate by randomly counting 50hpf (×400, field diameter 0.55 mm2) and obtaining an average per 10hpf. In 31 of the 297 cases, insufficient tissue was available on slides to scan through 50 fields. We counted a minimum of 10 fields in these cases.
Table 1. Clinical Characteristics at Resection.
| Group | 1 | 2 | 3 | 4 | ||||||
|---|---|---|---|---|---|---|---|---|---|---|
| Mitotic Grade | 1 | 1 | 2 | 2 | ||||||
| Ki67 Grade | 1 | 2 | 1 | 2 | ||||||
| Cases | 165 | 99 | 8 | 25 | ||||||
| Group Comparisons | P (1 vs. 2) | P (1 vs. 3) | P (1 vs. 4) | P (2 vs. 3) | P (2 vs. 4) | P (3 vs. 4) | ||||
| Age (y), median (range)* | 53 (18-88) | 57 (27-87) | 54 (41-76) | 50 (17-93) | 0.030 | 0.56 | 0.56 | 0.74 | 0.57 | 0.58 |
| Sex† | ||||||||||
| Male | 77 | 49 | 3 | 12 | 0.70 | 0.73 | 1 | 0.72 | 1 | 0.70 |
| Female | 88 | 50 | 5 | 13 | ||||||
| Overall survival postresection (y), median‡ | 16.7 | 12.0 | 7.4 | 8.4 | < 0.01 | <0.01 | < 0.01 | 0.20 | 0.13 | 0.87 |
| DSS postresection (y), median‡║ | NA§ | 12.9 | 7.4 | 8.6 | < 0.01 | <0.01 | < 0.01 | 0.034 | 0.095 | 0.96 |
| Functional | ||||||||||
| Insulin | 23 | 6 | 0 | 0 | ||||||
| VIP | 4 | 2 | 0 | 0 | ||||||
| Gastrin | 3 | 0 | 0 | 0 | ||||||
| Glucagon | 1 | 0 | 0 | 0 | ||||||
| Pancreatic polypeptide | 1 | 0 | 0 | 0 | ||||||
| Total, n (%)† | 32/137 (23) | 8/78 (10) | 0/4 (0) | 0/19 (0) | 0.018 | 0.57 | 0.014 | 1 | 0.35 | 1 |
| Syndromic | ||||||||||
| MEN-1 | 15 | 1 | 0 | 1 | ||||||
| VHL | 1 | 2 | 0 | 0 | ||||||
| FAP | 1 | 0 | 0 | 0 | ||||||
| Total, n (%)† | 17/129 (13) | 3/78 (3.8) | 0/4 (0) | 1/19 (5.3) | 0.030 | 1 | 0.47 | 1 | 1 | 1 |
| Location | ||||||||||
| Head/uncinate | 68 | 52 | 3 | 16 | 0.32 | 1 | 0.059 | 0.72 | 0.28 | 0.42 |
| Body/tail | 97 | 58 | 5 | 10 | ||||||
| Focality | ||||||||||
| Unifocal | 145 | 93 | 8 | 23 | 0.14 | 0.60 | 0.74 | 1 | 0.66 | 1 |
| Multifocal | 20 | 6 | 0 | 2 |
P-value calculated by paired Wilcoxon test.
P-value calculated by Fisher exact test.
P-value calculated by log rank test.
Median survival not applicable as >50% of patients were alive or died from unrelated causes at time of study (Fig. 1).
From each group, cases were excluded for which the cause of death could not be ascertained: 2 from group 1, 4 from group 2, and 5 from group 4.
DSS indicates disease-specific survival; FAP, familial adenomatous polyposis; MEN-1, multiple endocrine neoplasia-1; VIP, vasoactive intestinal polypeptide; VHL, von Hippel-Lindau.
Table 2. Histopathologic Features.
| Group | 1 | 2 | 3 | 4 | ||||||
|---|---|---|---|---|---|---|---|---|---|---|
| Mitotic Grade | 1 | 1 | 2 | 2 | ||||||
| Ki67 Grade | 1 | 2 | 1 | 2 | ||||||
| Cases | 165 | 99 | 8 | 25 | ||||||
| Group Comparisons | P (1 vs. 2) | P (1 vs. 3) | P (1 vs. 4) | P (2 vs. 3) | P (2 vs. 4) | P (3 vs. 4) | ||||
| Size (cm), median (range)* | 2.2 (0.5-24.0) | 3.5 (0.8-27.0) | 3.0 (1.5-13.0) | 4.3 (1.5-15.0) | 0.014 | 0.36 | 0.012 | 1 | 0.47 | 0.36 |
| Lymph node metastasis, n (%)† | 44/140 (31) | 54/94 (57) | 4/8 (50) | 18/25 (72) | <0.01 | 0.27 | <0.01 | 0.72 | 0.25 | 0.39 |
| Distant metastasis, n (%)† | 12/103 (12) | 24/58 (41) | 1/5 (20) | 11/17 (65) | <0.01 | 0.48 | <0.01 | 0.64 | 0.11 | 0.14 |
| Infiltrative growth, n (%)† | 36/165 (22) | 48/99 (48) | 6/8 (75) | 18/25 (72) | <0.01 | <0.01 | <0.01 | 0.27 | 0.044 | 1 |
| Perineural invasion, n (%)† | 31/165 (19) | 39/99 (39) | 4/8 (50) | 12/25 (48) | <0.01 | 0.054 | <0.01 | 0.71 | 0.50 | 1 |
| Small vessel invasion, n (%)† | 27/164 (16) | 46/98 (47) | 7/8 (88) | 11/25 (44) | <0.01 | <0.01 | <0.01 | 0.060 | 1 | 0.046 |
| Large vessel invasion, n (%)† | 10/165 (6) | 11/99 (11) | 0/8 (0) | 2/25 (8) | 0.16 | 1 | 0.67 | 1 | 1 | 1 |
| Necrosis, n (%)† | 17/164 (10) | 16/99 (16) | 3/8 (38) | 10/24 (42) | 0.18 | 0.052 | <0.01 | 0.15 | 0.011 | 1 |
P-value calculated by paired Wilcoxon test.
P-value calculated by Fisher exact test.
Figure 1.
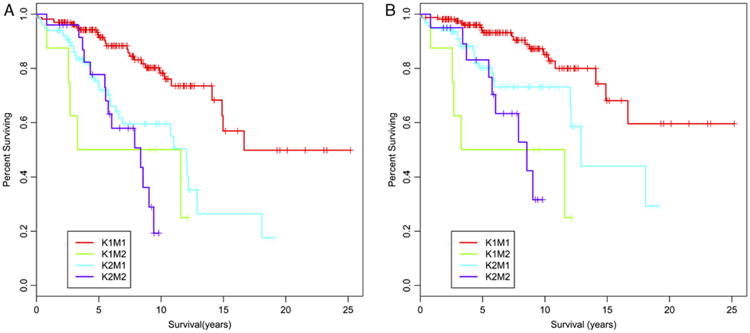
PanNETs that are G2 by either Ki67 index or mitotic rate show decreased overall survival and DSS compared with G1 tumors. Kaplan-Meier curves demonstrating the overall survival (A) and DSS (B) for each of the 4 groups of PanNETs in our study are shown: K1M1, Ki67 and mitotic G1; K1M2, Ki67 G1/mitotic G2; K2M1, Ki67 G2/mitotic G1; K2M2, Ki67 and mitotic G2. The P-values comparing the set of curves, calculated by a log rank test, are found in Table 1.
Representative formalin-fixed paraffin-embedded tissue blocks were selected from each case. A section of each block was immunolabeled for Ki67 using standard automated immunohistochemistry using the Ventana Benchmark XT system. The positive control for Ki67 was surgically resected human tonsil. The Ki67-labeling index was measured manually using custom software written in ImageJ (Wayne Rasband, NIH, Bethesda, MD) to assist in performing the nuclear counts. Five images were acquired per case at a total magnification of ×400 using a Q-Color3 digital camera (Olympus, Center Valley, PA) on an Olympus B-50 microscope (Center Valley, PA). Fields were selected that represented the highest density of Ki67-positive cells (hot spots). Using an ImageJ macro, each image was presented to the user, who then labeled each Ki67-positive nucleus with a color marker by clicking on it with the mouse. Each Ki67-negative nucleus was labeled using a marker of a different color. Non-neoplastic nuclei in the image were not labeled. At least 500 positive and negative markers in each image were automatically counted and a labeling index calculated: % Ki67 = (positive nuclei/[positive nuclei + negative nuclei]). All Ki67 counts were performed using computer assistance by one of our authors (L.J.M.). Another author (C.S.) verified the accuracy of the counts on a subset of cases.
The use of image analysis for measurement of the Ki67 index can result in cases having a fractional percentage, and some fall between the percentage thresholds cited in the WHO and European Neuroendocrine Tumor Society classification to distinguish G1 (≤2%) from G2 (≥3%). In this study, we rounded fractional percentages to the nearest whole number, so cases with a Ki67 index of 2.5% to 2.9% were graded as G2, and those <2.5% were considered G1. Other authors have retained all cases <3% in the G1 category.8 Had we utilized this approach, 11 G2 tumors would have been classified as G1, making the proportion of all mitotic G1 PanNETs with a G2 Ki67 index 33%, instead of the 37% we report. However, placing these 11 cases in the G1 concordant group would not have significantly altered the conclusions of our study (data not shown).
Overall survival data were obtained from hospital records and the United States Social Security Death Index. Causes of death for determining disease-specific survival (DSS) were obtained from the National Death Index (National Center for Health Statistics, Hyattsville, MD), supplemented with medical chart review in cases for which a specific cause of death was not available in the National Death Index. All statistical analyses were performed using R (R Foundation for Statistical Computing, Vienna, Austria). Histologic patterns and demographic data were compared using the Fisher exact test (for qualitative data) or a paired Wilcoxon test (for quantitative data). Survival data were compared using Kaplan-Meier curves and log rank tests as well as Cox proportional hazard models.
Results
Of the 361 PanNETs in our institutional database that were resected between 1984 and 2009, 297 had a mitotic rate of <20 mitoses/10hpf, corresponding to a WHO grade of 1 or 2. Of the 264 mitotic G1 tumors, 99 (37%) were G2 by Ki67 index. Of the 33 mitotic G2 tumors, 8 (24%) were G1 by Ki67 index. To determine whether these discordances were clinically significant, we evaluated several histopathologic features in each case (summarized in Table 2) and compared the larger discordant group (mitotic G1/Ki67 G2) with the concordant G1 and G2 groups.
Of the 99 mitotic G1/Ki67 G2 tumors, 54 (57%) had lymph node metastases, compared with 44 of 140 (31%) tumors that were G1 by both mitotic rate and Ki67 index (P < 0.01). Similarly, of cases in which information on distant metastases was available at the time of resection, 24 of 58 (41%) mitotic G1/Ki67 G2 tumors had known distant metastases, compared with only 12 of 103 (12%) mitotic G1/Ki67 G1 tumors (P < 0.01). In addition, of the mitotic G1 tumors, those that were Ki67 G2 were statistically significantly more likely to have perineural (39/99 [39%] vs. 36/165 [22%]) and small vessel/lymphatic (46/98 [47%] vs. 27/164 [16%]) invasion than concordant G1 tumors (P < 0.01 in each case). An infiltrative growth pattern was also more likely in the mitotic G1/Ki67 G2 tumors (48/99 [48%] vs. 36/165 [22%]) (P < 0.01). Large vessel invasion and necrosis were not significantly different between these two groups of tumors.
In addition, tumors with discordant mitotic and Ki67 grades showed differing clinical characteristics (Tables 1 and 2). The mitotic G1/Ki67 G2 tumors were significantly larger (median size 3.5 vs. 2.2 cm) (P = 0.014) and were found in younger patients (median age 53 vs. 57 y at resection) (P = 0.030). Of the 137 concordant mitotic and Ki67 G1 tumors with medical records available, 37 were functional: 23 insulinomas, 4 VIPomas, 3 gastrinomas, 1 glucagonoma, and 1 pancreatic polypeptide-secreting tumor. In 5 cases, patients with multiple endocrine neoplasia syndrome type 1 (MEN-1) syndrome had gastrinomas of the duodenum and separate gastrinnegative (by immunohistochemical labeling) PanNETs. Of 78 mitotic G1/Ki67 G2 tumors, 8 were functional: 6 insulinomas and 2 VIPomas. Comparing these two groups, the Ki67 G2 tumors were significantly less likely to be functional (P = 0.018).
We also compared the numbers of cases in which the PanNETs were associated with genetic syndromes: of the 129 mitotic and Ki67 G1 tumors with records available, 15 had known MEN-1, 1 had known von Hippel-Lindau syndrome, and 1 had known familial adenomatous polyposis. Significantly fewer mitotic G1/Ki67 G2 tumors were associated with genetic syndromes: of 78 tumors, 1 had known MEN-1, and 2 had known von Hippel-Lindau syndrome (P = 0.030). There was no significant difference between these two groups in terms of numbers (focality) of tumors or the location of the tumor(s) within the pancreas (Table 1).
We also compared the mitotic G1/Ki67 G2 PanNETs with those that were mitotic G2 and either Ki67 G1 or G2. We noted few significant differences: compared with grade-discordant tumors, concordant mitotic G2/Ki67 G2 tumors were more likely to have necrosis (10/24 [42%] vs. 16/99 [16%]) (P = 0.014) and an infiltrative growth pattern (18/25 [72%] vs. 48/99 [48%]) (P = 0.044), but were not significantly different in size, age at resection, numbers of lymph node or distant metastases, perineural invasion, or small or large vessel invasion. There were 8 cases in which the mitotic rate was G2 while the Ki67 index was G1. These cases showed no statistically significant histopathologic differences from those with mitotic G1 and Ki67 G2 but were more likely to show small vessel invasion (7 of 8 cases) than tumors that were G2 by both Ki67 index and mitotic rate. No clinical characteristics were significantly different among these three groups of tumors (Table 1).
Among mitotic G1 cases, those with Ki67 G2 had a significantly decreased overall survival (median survival 12.0 y), compared with 16.7 years for mitotic and Ki67 G1 (P < 0.01) (Fig. 1). We could not detect a significant difference in overall survival between the mitotic G1/Ki67 G2 tumors and those that were mitotic and Ki67 G2 (Table 1). To control for deaths unrelated to the patients' PanNETs, we also determined DSS in all cases for which a cause of death could be ascertained. Consistent with the overall survival data, mitotic G1/Ki67 G2 tumors had a significantly shorter DSS (12.9 y) than concordant G1 tumors, in which the median DSS has not yet been reached (P < 0.01), and there was no significant difference in DSS between mitotic G1/Ki67 G2 tumors and those that were G2 by both methods. However, we did find a significantly shorter DSS in the 8 cases that were mitotic G2/Ki67 G1 (7.4 y) than the cases that were mitotic G1/Ki67 G2 (12.9 y) (P = 0.034). The significance of this finding is unclear given the small number of cases in the former group.
Finally, we further assessed whether Ki67-based grading is an independent predictor of overall survival apart from tumor stage. Consistent with the Kaplan-Meier curves in Figure 1, a Cox proportional hazards model shows that mitotic G1/Ki67 G2 PanNETs have a significantly increased hazard ratio (HR) (3.31; 95% confidence interval [CI], 1.65-6.66; P < 0.01) compared with mitotic G1/Ki67 G1. When controlled for tumor stage (stage I-II vs. III-IV) determined by the 2010 WHO Classification, the HR remains significant (2.25; 95% CI, 1.07-4.7; P = 0.032). When controlled for stage in the same manner, DSS between the same two groups showed an increased HR (2.30), but it did not reach statistical significance (95% CI, 0.88-6.03; P = 0.091).
Discussion
In this study, we provide multiple lines of evidence to show that mitotic rate and Ki67 proliferative index both add to the accurate grading of well-differentiated PanNETs. In our series, over one third of cases that would be WHO G1 by mitotic rate grading alone (<2 mitotic figures/10hpf) are WHO G2 by Ki67 index (≥3%). These grade-discordant tumors are larger and manifest significantly more aggressive histopathologic features (more lymph node and distant metastases, infiltrative growth pattern, and perineural and small vessel/lymphatic invasion). They also are less likely to be functional tumors. In addition to these features, they also show significantly worse overall and DSS from time of resection.
Ki67 and mitotic rate grading methods were also discordant in PanNETs that are WHO G2 by mitotic rate: 8 of the 33 mitotic G2 tumors were G1 by Ki67 proliferative index. We were unable to detect any significant histopathologic or clinical differences because of this discordance, but our ability to detect differences is limited by the small number of cases.
We also observed few significant differences between tumors that were mitotic G1/Ki67 G2 and tumors that were mitotic G2, with the mitotic G2 tumors only showing significantly more infiltrative growth and necrosis but not any of our other parameters. This argues strongly that WHO G2 tumors by either grading method behave similarly, but in order to detect all G2 tumors, the proliferative index is best determined by Ki67 immunolabeling.
A major question that is not addressed by our study is how best to determine the Ki67 proliferative index. Despite the inclusion of the Ki67 index as a method of grading in the 2010 WHO consensus, the most accurate method to calculate it remains controversial.7,9 Important aspects in determining the Ki67-labeling index include which parts of a tumor to assess and how best to assess them.
Within individual PanNETs, there may be marked variability in Ki67 positivity.7,10,11 This extends even to PanNETs metastatic to the liver, where needle biopsies have been shown to undersample G2 areas in Ki67-heterogenous tumors, leading to the potential for undergrading.11 Because of this heterogeneity, the growing consensus has been to calculate the Ki67 index in resection specimens by counting in areas of highest proliferative activity (hot spots). The European Neuroendocrine Tumor Society proposed counting 2000 cells manually at “hot spots.”12 Concerned that this level of manual counting is impractical, a more recent consensus paper recommended a less rigorous method in which multiple “hot spot” regions are counted and the average percentage reported.7 In practice, however, owing to the demands of clinical practice, this group considered an “eyeballed” estimate adequate.7
A major caveat to “eyeballing” Ki67 indices is the potential for interobserver and intraobserver variability, given that the critical distinction in grading is between 2% and 3% positive cells. Recently, a group of 18 pathologists were asked to “eyeball” Ki67 indices on a series of photographed PanNETs and showed marked interobserver and intraobserver variability in their assessments, which would have resulted in a substantial amount of misgrading when compared with a gold standard of digital image analysis.8 Even more concerning is that this variability was most pronounced in the 2% to 5% range, around the cutoff for grading a tumor as G2.
To eliminate the time-consuming nature of manual counting, digital imaging methods have been developed to determine the percentage of positive cells in immunohistochemically labeled specimens. These methods were pioneered for the scoring of HER2 status in breast cancer specimens but have been extended to PanNETs.8,9,13–15 In particular, Tang et al8 demonstrated excellent correlation between digital image analysis and a 2000 cell manual count, with an intraclass correlation of 0.98, which strongly suggests that image analysis may replace manual counting in routine practice. Moreover, another recent study used a series of PanNETs to compare mitotic index with two methods of Ki67 digital imaging: counting a single “hot spot” field versus a random count of 10 consecutive microscopic fields.9 The authors found, as would be expected, that counting “hot spots” digitally consistently produced a higher Ki67 proliferative index than the counting of a random set of 10 consecutive fields. More importantly, they discovered that counting 10 consecutive fields produced closer agreement with the mitotic index, with concordant grading in 39 of 45 (87%) cases compared with only 17 of 45 (38%) cases with “hot spot” counting.9 However, another recent study compared outcomes of patients wherein grade was assigned using digital image analysis and either the highest Ki67 percentage area on a slide (the “hottest” spot) or the mean percentage and found better stratification of overall survival using the highest percentage method.11
As opposed to a purely manual or digital imaging, we used a manual counting method augmented by a digital image of multiple “hot spot” fields and a computer program that marked individual positive and negative cells on the image as they were counted. Using this technique, we were able to exclude lymphocytes, endothelial cells, and stromal cells from the count, ensuring a more accurate and precise determination of the Ki67 proliferative index. Our method is essentially identical to the manual counting method used by Tang et al,8 in which hard copies of digital images were counted by hand, suggesting a similarly strong correlation with digital image analysis. Consistent with Goodell et al's9 comparison of mitotic index with digital imaging–based counts, we also found a significant discordance between grade as determined by mitotic index and that determined by Ki67 proliferative index. However, our discordance rate with “hot spot” counting was less (37% compared with 62%). Two factors may account for this discrepancy: by manually counting, we may have been more successful at subtracting out lymphocytes and endothelial cells; we also took the average of 5 “hot spot” fields as opposed to the one highest area in the study by Goodell and colleagues. Although correcting for non-neoplastic cells may be inherently difficult in a digital algorithm, perhaps by evaluating >1 area of increased proliferative activity the results obtained using the method published by Goodell and colleagues would be more concordant with our results.
Our results clearly demonstrate that in PanNETs in which the Ki67 proliferative index results in a higher grade than the mitotic index, the tumors have more aggressive histopathologic features and have a worse overall survival than do tumors with concordant low-grade Ki67 index and mitotic counts. In addition, we could detect few significant differences between PanNETs that were G2 by Ki67 index only and those that were G2 by mitotic index. These results are consistent with recently published studies examining the relationship between Ki67 labeling and outcome in patients with PanNETs. In an extensive multivariate statistical analysis of our institutional data set, our colleagues recently found that Ki67 index is the single most important PanNET prognostic factor.16 Other groups have reported similar findings: one study of 24 patients with PanNETs found that a Ki67 index over 10% predicted lymph node metastases and poorer overall survival, and a Ki67 index cutoff of 10% (but not 2% as in the WHO system) was a better predictor of metastases and outcome than was > 2 mitoses/10hpf.17 Similarly, a larger study of 140 patients found that Ki67 staining of > 9% led to a higher likelihood of disease recurrence and poorer overall survival, although mitotic indices were not reported or examined in this study.18 The first study used a manual “hot spot” method to determine the Ki67 index, whereas the second study does not report the method used.17,18 Both studies reported a higher Ki67 cutoff to detect a difference in overall survival compared with our results; in the first study, our much larger number of patients may have led to a greater ability to discern a difference, whereas in the second, a more detailed look at how the Ki67 index was determined would be necessary to examine better the differences between their results and ours.
In addition to showing that, by WHO criteria, a significant minority of mitotic G1 PanNETs are G2 by Ki67 proliferative index, we were also unable to detect many significant differences between tumors that were G2 by Ki67 proliferative index alone and those that were G2 by mitotic rate. With the caveat that we had considerably fewer mitotic G2 cases, leading to a possible inability to detect subtle differences between these tumors and mitotic G1/Ki67 G2 cases, our results suggest that WHO G2 tumors, regardless of the grading method used, have similar histopathologic features and outcomes.
Finally, our studies do not address another underlying issue: why there is discordance between Ki67 and mitotic rate grading in the first place. The two techniques look at somewhat different parameters: the Ki67 proliferative index is the percentage of cells proliferating, whereas the mitotic rate is determined as proliferating cells per unit area (as defined as ×400 microscopic fields). Mitotic rate is therefore influenced by features of individual tumors, such as cell size (larger cells means fewer neoplastic cells per hpf) or quantity of stroma (more stroma means fewer neoplastic cells per hpf), which do not affect the Ki67 index. In addition, the identification of mitotic figures requires morphologic identification, which is subjective and inherently more difficult than counting cells as positive by immunohistochemical labeling, particularly in tumors such as G1 PanNETs, in which mitotic figures are quite rare (0 or 1/10 hpf). The use of a mitosisspecific immunohistochemical stain, such as Ser28-phosphohistone H3 (PHH3), allows for more rapid and objective identification of mitotic figures. However, the grading cutoff values for mitotic rate may have to be adjusted as more mitotic figures are identified with PHH3 than using microscopic evaluation of hematoxylin and eosin-stained sections alone.19–21 Moreover, the Ki67 antigen is present in all phases of the cell cycle (G1, G2, S, and M) but not in resting (G0) cells,22 thus if neoplastic cells have arrested within the cell cycle, Ki67 may still be positive when mitotic figures are absent, producing a discordantly high Ki67 index.
In summary, our results clearly indicate that when there is discordance between tumor grade based on mitotic rate versus that based on Ki67 index, the higher grade more accurately predicts the clinical outcome. More than one third of PanNETs that would have been WHO G1 by mitotic rate alone are increased to G2 by Ki67 index. These grade-discordant PanNETs, for all intents and purposes, are indistinguishable by histopathologic features and overall survival from WHO G2 tumors by mitotic rate. We used a manual counting method of Ki67 index determination that, although precise, may be impractical in a busy practice; our results, however, are compatible with those reported by digital imaging methods that in the future may be more widely available and standardized. Until digital imaging methods are widespread, manual counting of similar “hot spot” fields by printing out digital images, as reported elsewhere, is quite similar to our hybrid counting method and should produce similar results.8 But our data strongly suggest that, regardless of the method used, a determination of the Ki67 index be included in pathology reports on all resected PanNETs in order to more accurately grade these tumors.
Acknowledgments
Source of Funding: R.H.H. is supported by NIH grants P50-CA62924 and P30-CA006973.
Footnotes
Conflicts of Interest: The authors have disclosed that they have no significant relationships with, or financial interest in, any commercial companies pertaining to this article.
References
- 1.Klimstra DS, Arnold R, Capella C, et al. Neuroendocrine neoplasms of the pancreas. In: Bosman F, Carneiro F, Hruban RH, Theise N, editors. WHO Classification of Tumours of the Digestive System. Lyon: IARC Press; 2010. pp. 322–326. [Google Scholar]
- 2.Klöppel G, Rindi G, Anlauf M, et al. Site-specific biology and pathology of gastroenteropancreatic neuroendocrine tumors. Virchows Arch. 2007;451(suppl 1):S9–S27. doi: 10.1007/s00428-007-0461-0. [DOI] [PubMed] [Google Scholar]
- 3.Verbeke CS. Endocrine tumours of the pancreas. Histopathology. 2010;56:669–682. doi: 10.1111/j.1365-2559.2010.03490.x. [DOI] [PubMed] [Google Scholar]
- 4.Capelli P, Martignoni G, Pedica F, et al. Endocrine neoplasms of the pancreas: pathologic and genetic features. Arch Pathol Lab Med. 2009;133:350–364. doi: 10.5858/133.3.350. [DOI] [PubMed] [Google Scholar]
- 5.La Rosa S, Klersy C, Uccella S, et al. Improved histologic and clinicopathologic criteria for prognostic evaluation of pancreatic endocrine tumors. Hum Pathol. 2009;40:30–40. doi: 10.1016/j.humpath.2008.06.005. [DOI] [PubMed] [Google Scholar]
- 6.Ekeblad S, Skogseid B, Dunder K, et al. Prognostic factors and survival in 324 patients with pancreatic endocrine tumor treated at a single institution. Clin Cancer Res. 2008;14:7798–7803. doi: 10.1158/1078-0432.CCR-08-0734. [DOI] [PubMed] [Google Scholar]
- 7.Klimstra DS, Modlin IR, Adsay NV, et al. Pathology reporting of neuroendocrine tumors: application of the Delphic consensus process to the development of a minimum pathology data set. Am J Surg Pathol. 2010;34:300–313. doi: 10.1097/PAS.0b013e3181ce1447. [DOI] [PubMed] [Google Scholar]
- 8.Tang LH, Gonen M, Hedvat C, et al. Objective quantification of the ki67 proliferative index in neuroendocrine tumors of the gastroenteropancreatic system: a comparison of digital image analysis with manual methods. Am J Surg Pathol. 2012;36:1761–1770. doi: 10.1097/PAS.0b013e318263207c. [DOI] [PubMed] [Google Scholar]
- 9.Goodell PP, Krasinskas AM, Davison JM, et al. Comparison of methods for proliferative index analysis for grading pancreatic well-differentiated neuroendocrine tumors. Am J Clin Pathol. 2012;137:576–582. doi: 10.1309/AJCP92UCXPJMMSDU. [DOI] [PubMed] [Google Scholar]
- 10.Couvelard A, Deschamps L, Ravaud P, et al. Heterogeneity of tumor prognostic markers: a reproducibility study applied to liver metastases of pancreatic endocrine tumors. Mod Pathol. 2009;22:273–281. doi: 10.1038/modpathol.2008.177. [DOI] [PubMed] [Google Scholar]
- 11.Yang Z, Tang LH, Klimstra DS. Effect of tumor heterogeneity on the assessment of Ki67 labeling index in well-differentiated neuroendocrine tumors metastatic to the liver: implications for prognostic stratification. Am J Surg Pathol. 2011;35:853–860. doi: 10.1097/PAS.0b013e31821a0696. [DOI] [PubMed] [Google Scholar]
- 12.Rindi G, Klöppel G, Alhman H, et al. TNM staging of foregut (neuro)endocrine tumors: a consensus proposal including a grading system. Virchows Arch. 2006;449:395–401. doi: 10.1007/s00428-006-0250-1. [DOI] [PMC free article] [PubMed] [Google Scholar]
- 13.Wang S, Saboorian MH, Frenkel EP, et al. Assessment of HER-2/neu status in breast cancer. Automated Cellular Imaging System (ACIS)-assisted quantitation of immunohistochemical assay achieves high accuracy in comparison with fluorescence in situ hybridization assay as the standard. Am J Clin Pathol. 2001;116:495–503. doi: 10.1309/TMUW-G4WB-LXJ2-FUDN. [DOI] [PubMed] [Google Scholar]
- 14.Minot DM, Kipp BR, Root RM, et al. Automated cellular imaging system III for assessing HER2 status in breast cancer specimens: development of a standardized scoring method that correlates with FISH. Am J Clin Pathol. 2009;132:133–138. doi: 10.1309/AJCPJV0SKAF2PCMY. [DOI] [PubMed] [Google Scholar]
- 15.Dhall D, Frishberg DP, Galliano G, et al. Interobserver variability in assessing Ki-67 proliferative index in gastrointestinal well-differentiated neuroendocrine neoplasms. Mod Pathol. 2009;22:116A. [Google Scholar]
- 16.Ellison TA, Wolfgang CL, Shi C, et al. A single institution's 26-year experience with nonfunctional pancreatic neuroendocrine tumors: a validation of current staging systems and a new prognostic nomogram. Ann Surg. 2013 doi: 10.1097/SLA.0b013e31828f3174. Epub ahead of print. [DOI] [PMC free article] [PubMed] [Google Scholar]
- 17.Lowe K, Khithani A, Liu E, et al. Ki-67 labeling: a more sensitive indicator of malignant phenotype than mitotic count or tumor size? J Surg Oncol. 2012;106:724–727. doi: 10.1002/jso.23124. [DOI] [PubMed] [Google Scholar]
- 18.Hamilton NA, Liu TC, Cavatiao A, et al. Ki-67 predicts disease recurrence and poor prognosis in pancreatic neuroendocrine neoplasms. Surgery. 2012;152:107–113. doi: 10.1016/j.surg.2012.02.011. [DOI] [PMC free article] [PubMed] [Google Scholar]
- 19.Kim YJ, Ketter R, Steudel WI, et al. Prognostic significance of the mitotic index using the mitosis marker anti-phosphohistone H3 in meningiomas. Am J Clin Pathol. 2007;128:118–125. doi: 10.1309/HXUNAG34B3CEFDU8. [DOI] [PubMed] [Google Scholar]
- 20.Tapia C, Kutzner H, Mentzel T, et al. Two mitosis-specific antibodies, MPM-2 and phospho-histone H3 (Ser28), allow rapid and precise determination of mitotic activity. Am J Surg Pathol. 2006;30:83–89. doi: 10.1097/01.pas.0000183572.94140.43. [DOI] [PubMed] [Google Scholar]
- 21.Ladstein RG, Bachmann IM, Straume O, et al. Ki-67 expression is superior to mitotic count and novel proliferation markers PHH3, MCM4 and mitosin as a prognostic factor in thick cutaneous melanoma. BMC Cancer. 2010;10:140. doi: 10.1186/1471-2407-10-140. [DOI] [PMC free article] [PubMed] [Google Scholar]
- 22.Gerdes J, Lemke H, Baisch H, et al. Cell cycle analysis of a cell proliferation-associated human nuclear antigen defined by the monoclonal antibody Ki-67. J Immunol. 1984;133:1710–1715. [PubMed] [Google Scholar]