

Abstract
The hypothalamic arcuate nucleus (ARH) controls rat feeding behavior in part through peptidergic neurons projecting to the hypothalamic paraventricular nucleus (PVH). Hindbrain catecholaminergic (CA) neurons innervate both the PVH and ARH, and ablation of CA afferents to PVH neuroendocrine neurons prevents them from mounting cellular responses to systemic metabolic challenges such as insulin or 2-deoxy-d-glucose (2-DG). Here, we asked whether ablating CA afferents also limits their ARH responses to the same challenges or alters ARH connectivity with the PVH. We examined ARH neurons for three features: (1) CA afferents, visualized by dopamine-β-hydroxylase (DBH)– immunoreactivity; (2) activation by systemic metabolic challenge, as measured by increased numbers of neurons immunoreactive (ir) for phosphorylated ERK1/2 (pERK1/2); and (3) density of PVH-targeted axons immunoreactive for the feeding control peptides Agouti-related peptide and α-melanocyte-stimulating hormone (αMSH). Loss of PVH DBH immunoreactivity resulted in concomitant ARH reductions of DBH-ir and pERK1/2-ir neurons in the medial ARH, where AgRP neurons are enriched. In contrast, pERK1/2 immunoreactivity after systemic metabolic challenge was absent in αMSH-ir ARH neurons. Yet surprisingly, axonal αMSH immunoreactivity in the PVH was markedly increased in CA-ablated animals. These results indicate that (1) intrinsic ARH activity is insufficient to recruit pERK1/2-ir ARH neurons during systemic metabolic challenges (rather, hindbrain-originating CA neurons are required); and (2) rats may compensate for a loss of CA innervation to the ARH and PVH by increased expression of αMSH. These findings highlight the existence of a hierarchical dependence for ARH responses to neural and humoral signals that influence feeding behavior and metabolism.
Since at least the time of Mayer's classic elaborations of his glucostatic hypothesis (1–3), the mediobasal hypothalamus has been hypothesized to play important roles in nutrient sensing and food intake. Studies of the disposition of gold thioglucose (4, 5) and monosodium glutamate (6, 7) have supported the view that, in vivo, glucose and insulin act directly on certain hypothalamic arcuate (ARH) and/or ventromedial hypothalamic neurons or glia to influence their activity (8–10). Moreover, electrophysiological studies from isolated ARH neurons or ARH-containing brain slice preparations show that certain ARH neurons alter their firing rates or levels of intracellular Ca2+ after changes in extracellular concentrations of glucose (11–13). The electrical activity of certain rat ARH neurons can also be modulated by peptides involved in food intake control, such as hypocretin/orexin, ghrelin, and leptin (12, 14). Taken together with findings that ARH neurons have privileged access to cerebrospinal fluid (CSF) and blood compartments (15, 16), it appears likely that ARH nutrient-sensing and feeding control mechanisms in vivo involve the direct actions of circulating insulin, glucose, ghrelin, and leptin on these neurons (16, 17; see discussion in Ref. 13).
ARH neurons receive neural inputs from several brain regions that are likely to be nodes within a large-scale, distributed network that controls autonomic and ingestive functions (18–22). Sources of rat ARH afferents include the anteromedial and principal nuclei of the bed nuclei of the stria terminalis (23–25), the anteroventral periventricular nucleus (26), the dorsomedial hypothalamus (27), and the nucleus of the solitary tract (28). ARH neurons also receive appositions from some of the hypocretin/orexin neurons (29) located in the zona incerta, lateral hypothalamic area, and the dorsomedial hypothalamus (30, 31). Along with these structural data, functional neuroanatomy has established that both the appetitive and consummatory phases of glucoprivic feeding require intact neural inputs originating from hindbrain catecholaminergic (CA) neurons (32, 33). These neurons project to several forebrain sites, including the ARH, where they are crucial for driving glucoprivation-induced gene expression of neuropeptide Y (NPY) and Agouti-related peptide (AgRP) (34, 35), peptides involved in feeding control.
Thus, although ARH neurons are clearly sensitive to peripheral humoral signals, they also receive CA inputs that are critical for both glucoprivation-induced peptidergic gene expression and glucoprivic feeding behavior. Whether neural-derived CA signals have primacy over humoral signals (or vice versa) in driving ARH neural responses to influence cellular activation and behavior in vivo is, therefore, a critical but unresolved question. We now address this question at the level of ARH neuronal activation during systemic metabolic challenges.
Recently we reported that systemic insulin and 2-DG challenges in rats trigger phosphorylation of members of the MAPK family (ERKs 1 and 2) in the hypothalamic paraventricular nucleus (PVH). This response to systemic metabolic challenge was attenuated by lesions of hindbrain-originating CA inputs to the PVH (36). We collected a limited series of tissue sections containing the ARH from the animals used in that study. Here we report the effects of systemic metabolic and multimodal (ie, combined stimulus) challenges on ARH neuronal activation and document the effects of lesioning CA afferents to the PVH on 3 anatomical measures of ARH structure and function: (1) integrity of CA afferents projecting to the ARH; (2) levels of ARH neuronal recruitment after glycemic challenges, as measured by induction of ERK1/2 phosphorylation within ARH neurons; and (3) integrity of ARH-projecting axons to the PVH in intact and lesioned animals.
We show that loss of CA inputs to the PVH also disrupts such inputs to the ARH. This not only leads to marked losses of ARH activational responses to metabolic challenges but also alters ARH connections to the PVH. Collectively, these observations demonstrate that the hindbrain sends coordinated signals to the PVH and ARH. These are required for the ARH to mount intracellular responses to systemic metabolic challenges and maintain normal connectivity with the PVH in vivo. Portions of these data have been presented in preliminary form (37).
Materials and Methods
Subjects, operations, and intravenous challenges
The University of Southern California Institutional Animal Care and Use Committee approved all animal procedures. Because the new data in this study were obtained from the same animals first tested in the study by Khan et al (36), details of all in vivo procedures can be found there. New details are noted briefly here. Adult male Sprague-Dawley rats (Harlan) received bilateral, stereotaxically delivered injections of anti–dopamine-β-hydroxylase (DBH)–saporin or murine IgG–saporin (42 ng/200 nL; Advanced Targeting Systems, Inc) targeting the PVH (stereotaxic coordinates = 1.8 mm posterior to bregma, ±0.4 mm lateral to the midsagittal sinus, and 7.5 mm below the dural surface) (38). After a 5- to 7-day recovery, the rats were then fitted with jugular vein catheters and allowed an additional 5 to 7 days to recover before testing. On the test day, food was removed at least 2 hours before iv delivery of bolus infusions of either 0.9% saline vehicle, 2 U/kg/mL insulin (Regular Iletin II, 100 U/mL stock; Eli Lilly), or 250 mg/kg/mL 2-deoxy-d-glucose (2-DG) (Sigma-Aldrich). In a separate experiment, a subset of naive rats were placed in isoflurane-filled chambers for brief sedation, after which they were injected ip with 3.0 mL of hypertonic (1.5 M) saline and then euthanized in the same chambers 30 minutes later. Immediately before and 30 minutes after systemic treatment, blood was withdrawn from the catheter for plasma glucose and hormone determinations (reported in Ref. 36). Immediately after the second blood withdrawal, rats received 1.0 mL of sodium pentobarbital (50 mg/mL iv) and were perfused transcardially.
Tissue preparation
As detailed by Khan et al (36), rats were perfused first with isotonic saline, followed by at least 300 mL of chilled p-formaldehyde buffered in sodium borate (pH 9.5). The brain was removed from the skull and blocked to separate the forebrain from the hindbrain. Tissue blocks were frozen in supercooled hexane and stored at −80°C until further processing. Forebrains were sectioned into eight 1-in-8 series through the PVH and six 1-in-6 series through the ARH, starting immediately after the last PVH section was cut. In all cases, sections for the PVH and ARH tissue sets were 20 μm in thickness. Hindbrains were sectioned into eight 1-in-8 series beginning through the locus coeruleus and ending at the caudal levels of the nucleus of the solitary tract. All sections were stored in a cryoprotectant solution (50% phosphate buffer, 30% ethylene glycol, and 20% glycerol) at −20°C until further processing.
Multilabel fluorescence immunocytochemistry
Table 1 lists the primary antibodies, secondary antibodies, conjugates, and fluorescence reagents used in this study. Using Tris-buffered saline (TBS) (pH 7.4 at room temperature), sections were rinsed of cryoprotectant (5 rinses for 5 minutes each; 5 × 5) and then were incubated in blocking solution (2% normal donkey serum [catalog no. S30–100ML, lot no. NG1827420; EMD-Millipore] and 0.1% Triton X-100 [catalog no. T8532; Sigma-Aldrich] in TBS) for 2 to 3 hours at room temperature. All antibodies and fluorophores were dissolved to their final concentrations within this blocking solution. Sections were incubated in cocktails of primary antibodies for 16 to 18 hours at 4°C. After additional TBS rinses (5 × 5), sections were incubated with cocktails of secondary antibodies for 6 to 8 hours at room temperature and then rinsed again in TBS (5 × 5). Sections were then reacted with fluorophores for 1 to 2 hours at room temperature; those with ARH labeling were co-reacted with the fluorescent Nissl stain, NeuroTrace 640/660, during this incubation. Secondary antibody-fluorophore conjugates and fluorophore/NeuroTrace solutions were all used under photoprotective conditions (trays were wrapped in aluminum foil). Sections were mounted on Superfrost slides, air-dried, coverslipped with sodium bicarbonate–buffered glycerol, sealed with clear nail polish, and stored at 4°C until further analysis was performed.
Table 1.
Immunocytochemistry Reagents Used in This Study
| Reagenta | Antibody/Conjugate | Host | Type | Source | Catalog No.b | Titerc | Incubation, h, °Cd |
|---|---|---|---|---|---|---|---|
| ARH | |||||||
| 1: Primary | Anti-p44/42 pERK | Rb | Poly IgG | C | 91011 | 1:1000 | 16–18, 4 |
| 1: Secondary | Anti-rabbit IgG | Dk | Biotinylated | J | 711-065-1522 | 1:500 | 6–8, RT |
| 1: Fluorophore | Streptavidin | Alexa 488 | L | S112233 | 1:2000 | 1–2, RT | |
| 2: Primary | Anti-DBH | Ms | Mono IgG | E | MAB3084 | 1:10 000 | 16–18, 4 |
| 2: Secondary | Anti-mouse Cy3 | Dk | IgG | J | 715-165-1505 | 1:500 | 6–8, RT |
| 3: Nissl | NeuroTrace 640/660 | Far red label | L | N214836 | 1:200 | 1–2, RT | |
| 4: Primary | Anti-AgRP (83–132) | Rb | Mono IgG | P | H-003-537 | 1:2000 | 16–18, 4 |
| 4: Secondary | Anti-rabbit Cy3 | Dk | IgG | J | 711-165-1522 | 1:500 | 6–8, RT |
| 5: Primary | Anti-αMSH | Sh | Poly IgG | E | AB50878 | 1:10 000 | 16–18, 4 |
| 5: Secondary | Anti-sheep IgG | Dk | Biotinylated | J | 713-065-1479 | 1:500 | 1–2, RT |
| 5: Fluorophore | Streptavidin | Alexa 488 | L | S112233 | 1:2000 | 1–2, RT | |
| PVH or hindbraine | |||||||
| 6: Primary | Anti-DBH | Ms | Mono IgG | E | MAB3084 | 1:10 000 | 16–18, 4 |
| 6: Secondary | Anti-mouse Cy3 | Dk | IgG | J | 715-165-1505 | 1:500 | 6–8, RT |
| 7: Primary | Anti-AgRP (83–132) | Rb | Mono IgG | P | H-003-537 | 1:2000 | 16–18, 4 |
| 7: Secondary | Anti-rabbit IgG | Dk | Biotinylated | J | 711-065-1522 | 1:500 | 6–8, RT |
| 7: Fluorophore | Streptavidin | Alexa 488 | L | S112233 | 1:2000 | 1–2, RT | |
| 8: Primary | Anti-αMSH | Sh | Poly IgG | E | AB50878 | 1:100 000 | 16–18, 4 |
| 8: Secondary | Anti-sheep Cy5 | Dk | IgG | J | 713-175-14710 | 1:500 | 1–2, RT |
Abbreviations: C, Cell Signaling Technology; Dk, donkey; E, EMD-Millipore; IgG, immunoglobulin G; J, Jackson ImmunoResearch Laboratories; L, Life Technologies; mono, monoclonal; Ms, mouse; P, Phoenix Peptides; poly, polyclonal; Rb, rabbit; RT, room temperature; Sh, sheep.
Reagents used in a common reaction set are grouped by reaction number in the left column. Each number represents a common set of reagents applied to one series of tissue sections.
Superscript letters next to each catalog number refer to the following lot numbers for the batches of reagent used: 1, 19; 2, 92433; 3, 866795; 4, LV1556118; 5, 98890 (this is rat serum adsorbed); 6, 927003; 7, lot number not provided by supplier; 8, 060632908; 9, 69889; 10, 87481.
The dilutions listed are calculated from suppliers' stock. All secondary antibody and conjugate stocks from suppliers were diluted 1:2 in glycerol (ie, 50% glycerol and 50% buffer), and the dilution listed (eg, 1:500) is the final dilution. Thus, we calculated a 1:250 dilution of the 1:2 working stock to obtain the final 1:500 dilution.
The total duration of incubations (in hours) is expressed as a range based on the parameters of reactions run on separate occasions, followed by the temperature at which the incubations proceeded.
For hindbrain sections, only reaction 6 (successive DBH primary and Cy3-conjugated secondary antibody incubations) was performed. For the PVH, reactions 6 to 8 were all performed.
Epifluorescence and confocal microscopy
Tissue sections were first screened using an Axio Imager M2 upright fluorescence microscope (Carl Zeiss, Inc) fitted with filter sets configured for Alexa 488, Cy3, and Cy5 fluorophores. PVH and hindbrain sections were imaged at the University of Southern California using a Zeiss LSM 510 Meta confocal system as described previously (36, 39). ARH sections were scanned using a Zeiss LSM 700 confocal system located within the Cytometry, Screening and Imaging Core Facility of the Border Biomedical Research Center at the University of Texas at El Paso. The laser lines used included 488 nm (Alexa 488), 555 nm (Cy3), and 639 nm (Cy5).
PVH fiber counts
A series of 120 confocal image scans of the triple-labeled PVH were obtained. Immunoreactive signals for α-melanocyte-stimulating hormone (αMSH), Agouti-related peptide (AgRP), and DBH were quantitated using procedures identical to those described in detail for DBH quantitation (36).
ARH cell counts
A total of 4269 confocal images were taken of ARH-containing tissue sections to quantitatively analyze αMSH and AgRP immunoreactivity in the ARH. DBH fibers in the ARH were not quantitated because signal was dramatically lost in lesioned animals such that differences between intact and lesioned cases were self-evident. Quantitation methods were adapted from methods described previously (40). Where appropriate, counts were performed separately by 2 investigators and cross-checked for accuracy.
Phosphorylated ERK1/2 (pERK1/2) quantitation
Confocal images (.lsm formatted files) from both hemispheres were imported into Volocity software (version 6.0, PerkinElmer), and, by consulting the fluorescent Nissl image in the far-red channel, boundaries around the area of the ARH were traced for the other channels. Images were exported from Volocity in .tif format and imported into Adobe Photoshop CS5 (Adobe Systems). A mean count of cells was taken across sections. t tests were conducted to analyze pairwise comparisons of intact/lesioned and various treatment groups, with P < .05 (see Figure 5). One-way ANOVA followed by a Newman-Keuls post hoc test was used to determine differences in the rostrocaudal pERK1/2 activation patterns associated with insulin or 2-DG injections (see Figure 6).
Figure 5.

Number of pERK1/2-ir cells in the ARH across treatments, normalized across the total number of tissue hemisections analyzed. Intact (sham-lesioned) animals treated with systemic 2-DG and insulin challenges have the greatest number of pERK1/2-ir cells in the ARH. Data are expressed as mean numbers of neurons ± SEM. *, P ≤ .05 across lesion type. HS, group receiving a combination of systemic hypertonic saline and isoflurane anesthesia challenges.
Figure 6.
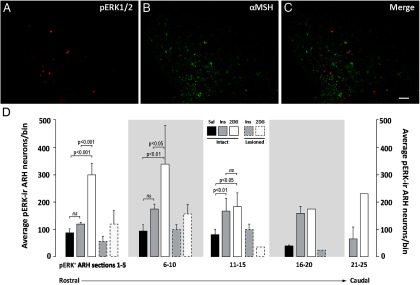
A–C, pERK1/2-ir cells are located in the medial ARH, in neurons that are not immunoreactive to αMSH. Subject no. 08–071. Representative images are shown for pERK1/2 immunoreactivity (A), αMSH immunoreactivity (B), and both sets of immunoreactivity (C) in neurons of the ARH. Scale bar in C corresponds to 100 μm and applies to all panels. D, Rostrocaudal distribution of pERK1/2-ir neurons in the ARH of intact and DSAP-lesioned animals receiving saline (Sal), insulin (Ins), or 2-DG iv challenges. pERK1/2-ir neurons were binned into 1 of 5 groups based on the particular tissue section in which they were counted among the larger rostrocaudal sequence of 25 transverse sections collected for the ARH. Data are expressed as mean cell counts per bin ± SEM. Note the rostrocaudal differences in the levels of activation produced by insulin and 2-DG treatments in terms of numbers of pERK1/2-ir neurons recruited and the uniform distribution of the loss of this activation in DSAP-treated rats. Brackets with P values mark groups showing statistically significant differences in numbers of pERK1/2-ir neurons. ns, not significantly different.
αMSH/AgRP quantitation
Cell counts were obtained in the same manner as described above except that ARH boundary assignments were not necessary, because hypothalamic αMSH- and AgRP-immunoreactive (ir) cell bodies are confined to the ARH within the rostrocaudal range of sections we analyzed. Immunopositive cells for each peptide were therefore considered to be within the ARH. Statistical analyses were conducted in the same manner as for the pERK1/2 analyses, with a value of P < .05.
Results
Eliminating CA innervation of the PVH disrupts CA innervation of the ARH
Figure 1 shows the effects of anti-dopamine-β-hydroxylase-saporin (DSAP) injections into the PVH. As we reported previously (36), DSAP injections markedly reduced the number and intensity of DBH-ir fibers in the PVH in comparison with sham-lesioned (intact) rats (Figure 1, A and B). In addition, new photographic documentation is now presented in support of our anecdotal observation (36) regarding the effect of this treatment on DBH-ir fibers in the ARH of the same animals (Figure 1, C and D). Specifically, DSAP-lesioned rats displayed nearly complete losses of DBH immunoreactivity in the ARH compared with that in intact controls. These data also support similar observations made by other laboratories (32). The losses of DBH-ir fibers in the PVH and ARH in these animals were accompanied by marked losses of DBH-ir cell bodies in several hindbrain regions well documented to be sources of projections to the PVH (41, 42), including the medial subnucleus of the nucleus of the solitary tract, the ventrolateral medulla, and the locus coeruleus (Figure 2, D, E, and F).
Figure 1.

Measures of CA innervation of the PVH (A and B) and ARH (C and D) in sham-lesioned (Intact: A and C) and anti-DBH-saporin–injected (Lesioned: B and D) rats receiving a systemic 2-DG challenge. Tissue from the intact animal (subject no. 08–060) is shown in A and C, whereas tissue from the lesioned animal (subject no. 08–070) is shown in B and D. Outlines indicate regions of interest used to quantify CA innervation, as measured by immunoreactivity against DBH. As reported previously (36) and shown here in B, rats receiving anti-DBH–saporin immunotoxin injections within the PVH displayed significant DBH signal losses in all 3 PVH subregions surveyed: medial parvicellular, dorsal part, dorsal division (mpdd), medial parvicellular, dorsal part, ventral division (mpdv), and periventricular subregion (pv). D, The same rats receiving PVH-directed immunotoxin injections also displayed frank losses of DBH signal in the ARH compared with control, sham-lesioned animals (C). Scale bar in C corresponds to 100 μm and applies to all panels. dp, dorsal parvicellular; mpv, medial parvicellular, ventral part; pm, posterior magnocellular part.
Figure 2.

Validation of PVH-targeted DSAP treatment. Relative to sham-injected (murine IgG–saporin-injected) subjects (A–C), DSAP injections into the PVH were accompanied by frank losses (marked by asterisks) of cell bodies in hindbrain CA neurons (D–F), including regions such as the medial subregion of the nucleus of the solitary tract (mNTS; D), the ventrolateral medulla (VLM; E), and the locus coeruleus (LC; F). All of these regions have known projections to the PVH. Scale bar in E corresponds to 100 μm and applies to panels B and E. Scale bar in F corresponds to 50 μm and applies to panels C and F.
Systemic metabolic and multimodal challenges are associated with activated ARH neurons
We evaluated the effects of systemic metabolic or multimodal challenges on ARH neuronal activation. To do this, we examined pERK1/2 as markers of activation in the ARH. We have shown previously, that pERK1/2 rapidly and reliably tracks intracellular events (19, 36, 39, 43). Within the ARH, we found pERK1/2-ir neurons throughout the ARH after insulin and 2-DG challenges. These activated neurons displayed clear appositions to DBH-ir elements as demonstrated by high-resolution confocal imaging (Figure 3, A and B). Across treatments, pERK1/2-ir neurons, within the Nissl-delimited boundaries we assigned for the ARH (Figure 4H, inset), were counted in intact animals receiving iv injections of saline, 2-DG, or insulin or inhalational isoflurane anesthesia followed by ip injection of hypertonic saline. Subjects receiving insulin or 2-DG displayed robust glycemic fluctuations, as reported in our companion study (see Table 2 of Ref. 36). Compared with intact saline-injected controls (n = 3; Figure 4A), 2-DG (n = 3), insulin (n = 7), and isoflurane anesthesia and hypertonic saline (n = 4) treatments in intact rats were associated with significant increases in the numbers of pERK1/2-ir neurons in the ARH (Figures 4, A, C, E, and G and 5). The greatest number of activated neurons was observed for the 2-DG group, with fewer neurons recruited after insulin and isoflurane anesthesia and hypertonic saline treatments (Figure 5).
Figure 3.

Activated ARH neurons are contacted by DBH-ir appositions. Subject no. 08–060. A, Low-power photomicrograph of DBH-ir fibers (red) within the area where ARH neurons that are activated by glycemic or multimodal challenges are found (green). B, Orthogonal enlargement of the boxed area in A, showing how a red DBH-ir bouton is in apposition with a pERK1/2-ir ARH neuronal cell body (green). Arrows in the main X–Y plane and flanking X–Z and Y–Z planes point to the apposition in 3 dimensions, indicating a true and persisting spatial apposition that is independent of plane of section. Scale bars correspond to 30 μm (A) and 10 μm (B).
Figure 4.

The numbers of pERK1/2-ir neurons in the ARH are attenuated in DSAP-lesioned rats receiving 2-DG or insulin (D and F, respectively) compared with those in intact rats receiving the same treatments (C and E, respectively). In contrast, DSAP lesions did not affect basal pERK1/2 expression after saline injections (B) relative to that in intact saline controls (A), nor did the lesions attenuate the number of neurons displaying pERK1/2-ir following hypertonic saline plus isoflurane anesthesia (compare H to the intact control case in G). Neurons expressing pERK1/2 are more numerous in the ARH of intact rats given 2-DG (C) and insulin (E) treatments relative to those in saline (A) controls and hypertonic saline–injected rats (G). H, inset, representative Nissl-stained section (fluorescent NeuroTrace label) containing the ARH (the outlined area shows an example of an ROI analyzed for cell counts). Scale bar in A corresponds to 100 μm and applies to all panels. Subject numbers: 06–225 (A); 07–046 (B); 07–038 (C); 07–041 (D); 06–235 (E); 06–236 (F); 07–043 (G); 07–040 (H).
Removal of PVH CA afferents selectively attenuates ARH responses to systemic metabolic challenges
We next asked whether the observed loss of CA fibers to the ARH in lesioned rats alters the ERK1/2 activation we observed in intact rats. To address this question, we examined pERK1/2 immunoreactivity in ARH tissue from DSAP-treated rats. Sham-lesioned rats receiving saline (n = 3) displayed low numbers of pERK1/2-ir neurons under basal conditions (Figure 4A). Relative to sham-lesioned rats receiving insulin, 2-DG, or isoflurane anesthesia and hypertonic saline; the numbers of pERK1/2-ir neurons recruited in DSAP-treated rats after 2-DG (n = 3) or insulin (n = 8) treatments but not after isoflurane anesthesia and hypertonic saline (n = 4) were markedly reduced (Figures 4, D, F, and H and 5).
Neuronal activation is triggered primarily in a medial ARH neuronal phenotype
We examined the spatial distribution of the neurons in the ARH that were activated in association with the systemic metabolic challenges we used and the general distribution within which frank losses of this ARH activation occurred after DSAP injections in the PVH. Activated (pERK1/2-ir) neurons were found predominately in the medial ARH near the ependymal border lining the most ventral aspect of the third ventricle (Figures 4, C, E, and G and 6A; see Ref. 44). Although a lack of available tissue precluded us from using the 2 most common methods for examining the distribution of AgRP-containing neurons in this tissue (mRNA detection using in situ hybridization or antibody labeling of accumulated proteins in cell bodies from colchicine-treated animals), we did obtain evidence effectively ruling out the possibility that pERK1/2 colocalizes with αMSH-ir neurons (Figure 6, A–C). Thus, pERK1/2 is induced in ARH neurons that have an as yet unknown phenotype, but its presence within the medial ARH and absence within αMSH-ir neurons is at least consistent with the possibility that systemic metabolic challenges induce this molecule within NPY/AgRP neurons of the medial ARH.
Neuronal activation after systemic insulin or 2-DG injection is differentially triggered or impaired across the full rostrocaudal extent of the medial ARH
With the exception of the most caudal levels of the ARH, for which representative sections for analysis were not available for comparison between rats receiving saline and those receiving insulin or 2-DG, pERK1/2-ir neurons were differentially elevated at various levels of the ARH in animals receiving these challenges relative to saline-injected controls. Specifically, the intact saline group displayed a baseline level of neuronal recruitment that ranged between 45 and 86 neurons in any single binned group of 5 consecutive sections (Figure 6D). Relative to this control group, 2-DG but not insulin maximally increased pERK1/2 in rostrally located ARH neurons (sections 1–5, F2, 16 = 27.78; 2-DG, P < .0001; insulin, not significant; sections 6–10, F2, 16 = 7.376; 2-DG, P < .01; insulin, not significant). In contrast, pERK1/2 recruitment after insulin injection was restricted to the caudal ARH (sections 11–15, F2, 16 = 7.344; 2-DG, P < .05; insulin, P < .01) and was associated with fewer activated neurons (63–177 pERK1/2+ neurons) overall. A more modest increase after 2-DG was also seen at these more caudal levels (Figure 6D). In DSAP-injected animals, losses in the numbers of pERK1/2-ir neurons were evident at all rostrocaudal ARH levels where comparisons were possible (Figure 6D). The most dramatic losses in recruitment relative to those in intact animals occurred for 2-DG–treated animals (up to 84%), with insulin-associated recruitment also reduced by nearly 51% in DSAP-injected rats in relation to controls.
Eliminating CA innervation of the PVH alters AgRP and αMSH innervation of the PVH
Given the dramatic reductions in rapid, short-term ARH neuronal responses to systemic metabolic challenges as a result of PVH DSAP treatment, we asked whether the same treatment produced longer-term effects on ARH neuronal connectivity within the PVH. To address this question, we performed triple-label immunofluorescence studies of PVH sections obtained from intact and DSAP-injected rats to examine the axonal fibers that were immunoreactive for DBH, αMSH, and AgRP. Representative examples of triple-stained material from intact (sham-lesioned) and DSAP-lesioned cases appear in Figure 7, which shows immunostaining for αMSH (Figure 7A) and AgRP (Figure 7B). For these cases, the DBH label in the same PVH sections is shown in Figure 1, A and B, respectively, and the subregions shown in Figure 1B were again quantitatively analyzed for overall αMSH-ir and AgRP-ir signal intensity (mean gray levels [MGLs]), and area occupied by the αMSH and AgRP signal (as a percentage of the analyzed region of interest [ROI]). Contrary to our expectations of significant reductions of these measures for both αMSH and AgRP immunoreactivity in DSAP-injected rats, we found that DSAP treatment was associated with increases in both peptide signals compared with those in intact (sham-lesioned) rats. Specifically, for αMSH immunoreactivity, there were marked, statistically significant increases in both the area occupied by αMSH-ir axons (percentage of ROI) and the signal intensity of each fiber (MGLs; graphs in Figure 7A). These increases extended to all PVH subregions analyzed under both sets of measures. Along similar lines, there were apparent trends toward an increase in AgRP immunoreactivity, but only for the dorsal part of the medial parvicellular dorsal division (Figure 7B); these trends did not achieve statistical significance. We did not observe any apparent differences within the detectable pool of cell bodies stained for either peptide in the ARH (data not shown).
Figure 7.

Alterations in the expression of αMSH-ir and AgRP-ir fibers in the PVH of DSAP-lesioned rats. A, Images in each column show different fluorescent channels from the same tissue section. This was triple-labeled tissue, and the third channel, for DBH, is shown separately in Figure 1 for both columns, respectively (Figure 1, A and B). As shown in the panels and graphs for set A, αMSH expression is increased in lesioned rats relative to that in sham-lesioned controls both in terms of the number of immunoreactive fibers in the PVH (quantitated as a percentage of the total area of the sampled ROI), and also the relative intensity of each immunoreactive element in the PVH (quantitated as the MGL of the sampled ROI). In contrast, although AgRP-ir terminals displayed a trend toward increased expression within certain PVH subdivisions in lesioned rats, these increases were not statistically significant. Data are expressed as mean cell counts ± SEM. ***, P < .0005; **, P < .005; *, P < .05. ns, not statistically significant. Subregional abbreviations for the PVH in the graphs are explained in the legend to Figure 1. Scale bar in B corresponds to 100 μm and applies to all panels.
Discussion
Our principal findings can be summarized as follows: (1) systemic metabolic and multimodal challenges rapidly activate medial ARH neurons along the rostrocaudal extent of the nucleus, some of which receive DBH-ir appositions; (2) denervation of CA afferents to the PVH is accompanied by losses of ARH activation that are selective for insulin or 2-DG challenges; and (3) this denervation also alters the distribution and expression of αMSH-ir and AgRP-ir axons terminating in the PVH, cell bodies for which are present within the ARH. Here, we discuss these findings within the context of how they advance our understanding of communication within nutrient sensing and feeding control networks.
ARH pERK1/2 is a multiresponsive tracker of diverse stimuli
Consistent with our previous observations in the PVH (36), systemic metabolic (insulin and 2-DG) or multimodal (isoflurane anesthesia and hypertonic saline) challenges are associated with increased numbers of pERK1/2-ir ARH neurons within 30 minutes of treatment. 2-DG and insulin activate somewhat different sets of rostrocaudally located ARH neurons, meaning that each of these challenges differentially recruits pERK1/2 across ARH neuronal populations. Our results therefore underscore the multifunctional role of pERK1/2 within the ARH in tracking cellular activation in response to diverse stimuli. Our findings also extend the work of other investigators, who have shown using immunostaining in mice or rats that pERK1/2-ir neurons increase within the ARH in response to fasting (45), attenuate during refeeding (46), and also increase after intracerebroventricular or iv leptin treatment (47, 48). Similarly, 17β-estradiol treatment also yields detectable phosphorylation of ERK protein in ARH-containing tissue homogenates (49).
ARH pERK1/2 responses couple selectively to CA inputs during systemic metabolic challenges
Although ERK1/2 are recruited by diverse stimuli in the ARH, our data show that only recruitment after peripheral insulin or 2-DG injection requires intact CA input to the ARH region. This input may act directly on ARH neurons, as suggested by the DBH-ir appositions we found on pERK1/2-ir ARH neurons. In addition, the relative abundance of DBH-ir fibers in parts of the ARH where pERK1/2-ir neurons are sparse suggests that at least some of these CA-dependent actions are indirect, similar to those we have recently discussed for the PVH (50).
Phospho-ERK1/2 recruitment after systemic metabolic challenges in intact rats was evident through the analyzed rostrocaudal extent of the ARH. Although a limited sample size prevented statistical analysis of the lesioned saline-treated group, the occurrence of statistically significant reductions in this recruitment in lesioned vs intact insulin- and 2-DG–treated animals was evident across the entire ARH expanse analyzed. In contrast, ARH pERK1/2 responses to a multimodal challenge remained robust in lesioned animals. These findings are consistent with those we obtained in PVH (36). Taken together, these results indicate that hindbrain CA neurons coordinate pERK1/2 recruitment in distinct medial hypothalamic structures that are probably part of larger feeding and/or autonomic control networks, which are responsive to changes in circulating glucose. Although the present results show that the CA-dependent drive to PVH and ARH neurons is selective for insulin or 2-DG challenges, 2 caveats should be noted. First, hindbrain CA afferents recruit a common intracellular signaling cascade (ie, MAPK pathways) in both structures that is otherwise responsive to several other afferent-driven stimulus pathways and conditions. Second, the selectivity of CA afferents to systemic metabolic challenges may be more apparent than real: all stimuli that potentially drive ARH or PVH responses have not yet been exhaustively tested in DSAP-treated animals for their dependence on the CA afferent system.
Humoral signals are insufficient to drive ARH pERK1/2 signaling during in vivo insulin or 2-DG challenges
Studies involving tissue slice electrophysiology have shown that ARH neurons can respond directly to glucose concentration changes in the immediate extracellular environment (12, 13). ARH neurons in vivo have also been demonstrated to have selective access to the CSF (15) and AgRP neurons in the ARH have been reported recently to lie outside of the blood-brain barrier in the mouse ARH (16). However, it is not yet clear whether ARH neurons directly sense glucose fluctuations within the CSF or blood compartments in vivo, despite having direct access to the glucose concentrations from these compartments (17). Furthermore, it is not clear whether the information encoded by humoral signals, even if accessed by ARH neurons in vivo, is used to influence intracellular processes such as gene expression.
Increased expression of Agrp and Npy in the ARH after iv 2-DG challenges requires intact CA inputs (34, 35). Therefore, any glycemia-associated humoral signals that directly affect ARH neurons are not sufficient to drive ARH gene expression. Similarly, although some ARH neurons express ghrelin receptors, Date et al (51) have shown that unilateral DBH-saporin injections in the ARH block ipsilateral Fos activation in the ARH after peripheral ghrelin administration. Thus, humoral routes are insufficient for 2-DG or ghrelin to engage ARH neurons in vivo. Because ERK1/2 remains unphosphorylated and therefore inactive after insulin or 2-DG challenges without intact CA input to the ARH, our results provide additional support for the apparent primacy of neural over humoral signal transfer in these circumstances. Therefore, either (1) humoral signals are not conveyed through the blood or CSF to the ARH during insulin or 2-DG challenges or (2) if they are conveyed, they have no bearing on ERK1/2 phosphorylation or (3) if they are conveyed and do play a role in pERK1/2 induction, they are insufficient to induce pERK1/2 on their own without CA afferent input. The possibility, exists, however, that the ability of glycemic signals to influence ARH activity independent of CA input may be linked to the rate of change of glycemic status, as has been recently shown for CA afferents during slow- and fast-onset hypoglycemia (52).
pERK1/2 immunoreactivity is induced by systemic insulin or 2-DG challenges in the medial ARH
Unfortunately, limited tissue samples prevented us from making a more rigorous assessment of the neuronal phenotypes that displayed pERK1/2 immunoreactivity in response to each challenge. However, the locations of pERK1/2-ir neurons suggest a greater recruitment in the medial ARH. A likely chemical phenotype of these neurons is NPY/AgRP, which is concentrated more medially in the rat ARH than in the pro-opiomelanocortin (POMC)/cocaine- and amphetamine-regulated transcript (CART) neurons that express αMSH (44). Indeed we found no colocalization of αMSH and pERK1/2 in the activated ARH. However, pERK1/2 activation in POMC/CART phenotypes cannot be ruled out completely, because full histological detection of αMSH in these neurons usually requires colchicine treatment, αMSH-ir neurons do not have a distribution that is categorically restricted to the lateral ARH alone (44), and because pERK1/2 induction in this phenotype is possible (46). It also remains to be determined whether pERK1/2 immunoreactivity under these conditions is expressed in any of several other neuronal phenotypes identified in the ARH (53).
The αMSH system in the adult rat is capable of structural plasticity
Surprisingly, we found that loss of CA inputs to the PVH was accompanied by increases in the intensity and distribution of αMSH-ir fibers in the PVH. This up-regulation was manifest both in terms of MGL values (denoting levels of expression) and the percentage of ROI (denoting the total area occupied by the immunoreactive axons). Although these structural alterations are ostensibly associated with the disruption occurring in the CA innervation to the PVH in DSAP-injected animals, the mechanisms underlying such changes are unknown. Furthermore, is it not clear whether this structural plasticity is a true form of synaptic plasticity; additional experiments using DSAP are required for such an assessment. However, these alterations could be related to those in ARH POMC neurons that were recently shown to occur after disruption of autophagy, a critical remodeling and cellular recycling process (54, 55). That αMSH-ir axonal coverage increased after DSAP lesions suggests that CA signals are critical for the normal maintenance of these axonal pathways. The changes we observed in this anorexigenic system after CA denervation may provide clues, as discussed below, to the neural systems through which glucoprivic feeding is mediated.
In conclusion, the neural substrates underlying the control of glucoprivic feeding behavior remain imprecisely defined but almost certainly involve the concerted participation of both forebrain and hindbrain neuronal populations. The ARH and PVH, both of which contain neurons involved in feeding control, also contain neurons that respond to subtle changes in extracellular glucose concentrations using mechanisms that vary within each region by cell type (12, 13, 56). Because pERK1/2 has yet to be implicated as a participant within any known glucosensing mechanism, it is reasonable to infer that loss of ERK1/2 phosphorylation in the PVH (36) or the ARH (this study) after DSAP lesions would probably not directly impair neuronal glucosensing mechanisms. Moreover, the fact that neural substrates in the PVH appear dispensable for glucoprivic feeding behavior (57, 58) suggests that pERK1/2 activity in the PVH is also dispensable during such feeding.
What then, is the function of pERK1/2 in ARH neurons after systemic metabolic challenges? Three lines of evidence suggest that glucoprivic feeding may require CA afferent–induced pERK1/2 activation in the ARH. Glucoprivic feeding behavior is abolished after immunotoxin-based denervation of hypothalamic CA afferents originating from the hindbrain (32, 33). Further, increased Npy and Agrp expression in the ARH also requires intact CA afferents (34, 35), although destruction of AgRP/NPY– or CART-expressing neurons in the ARH remains permissive for glucoprivic feeding (59). Taken together with the possibility that pERK1/2 immunoreactivity is increased in NPY/AgRP after glucoprivation, CA afferents may well drive Npy and Agrp expression in the ARH through a pERK1/2 signaling pathway. This may be sufficient, if not necessary, to control glucoprivic feeding. A role for pERK1/2 in the signaling pathways controlling gene expression in ARH neurons is suggested by data demonstrating such a role for this molecule in controlling Crh expression in the PVH after systemic injection of insulin or deoxyglucose (36).
Thus, when considered together, the results of studies using DSAP immunotoxin lesions to ablate the hindbrain-originating CA afferent system provide evidence to link these neurons to indices of glucoprivation experimentally detectable at the cellular (pERK1/2 and Fos), chemoarchitectural (NPY/AgRP neurons), and behavioral (feeding) levels (Refs. 32–35 and this study). Moreover, because we also observed a marked up-regulation in αMSH immunoreactivity in the PVH after DSAP treatment, the loss of glucoprivic feeding observed by others after CA denervation (32, 33) may have arisen from a loss of NPY/AgRP orexigenic drive (as measured here by reduced numbers of pERK1/2-ir neurons) together with a gain of POMC anorexigenic drive (as measured by increased αMSH-ir axons in the PVH).
This conclusion leads to a model of humoral/neural interactions in which the humoral information that triggers acute cellular responses to metabolic challenge in the ARH and PVH does not require neural input. In contrast, neural information helps shape longer-term gene expression responses to metabolic challenges in these neuronal populations, a process that requires ERK or other similar signaling intermediates. In turn, this intracellular signaling will affect the expression of orexigenic and anorexigenic peptides in a way that changes the patterns of feeding behavior. In this scenario, then, PVH or ARH neurons will require neural afferents to drive gene expression and neuronal excitability in a manner appropriate to control feeding behavior; this neural drive will continuously refine and modulate the neuron's own intrinsic activity (50). The integration of humoral and neural inputs therefore allows these neurons to match internal signaling events driving gene expression to the external energy demands placed on the neuron, thereby influencing behavior. Further experiments are needed to determine whether or not this dichotomous division of labor occurs for ARH and PVH neurons, and, if so, whether it generalizes to other neuronal systems that influence feeding and other metabolic control networks.
Acknowledgments
We thank Dr Kimberly L. Kaminski (University of Southern California) and Alison R. Smith (University of Texas at El Paso [UTEP]) for technical assistance and Drs Armando Varela-Ramírez and Renato Aguilera (UTEP) for their assistance with confocal imaging in the Border Biomedical Research Center's (BBRC) Cytometry, Screening and Imaging Core Facility. This facility is supported by Grant 8G12MD007592 to the BBRC from the National Institute on Minority Health and Health Disparities. We also thank Dr Robert A. Kirken (UTEP) and the UTEP Campus Office for Undergraduate Research Initiatives for their support of this project.
This work was supported by National Institutes of Health Grants DK081937 (to A.M.K.) and NS029728 (A.G.W.), funds awarded to A.M.K. from the Border Biomedical Research Center (5G12RR008124 and 8G12MD007592), and a Keelung Hong Graduate Research Fellowship awarded to E.M.W.
Disclosure Summary: The authors have nothing to disclose.
Footnotes
- AgRP
- Agouti-related peptide
- ARH
- arcuate hypothalamic nucleus
- CA
- catecholaminergic
- CART
- cocaine- and amphetamine-regulated transcript
- CSF
- cerebrospinal fluid
- DBH
- dopamine-β-hydroxylase
- 2-DG
- 2-deoxy-d-glucose
- DSAP
- dopamine-β-hydroxylase–saporin
- ir
- immunoreactive
- MGL
- mean gray level
- αMSH
- α-melanocyte-stimulating hormone
- NPY
- neuropeptide Y
- pERK1/2
- phosphorylated ERK1/2
- POMC
- pro-opiomelanocortin
- PVH
- hypothalamic paraventricular nucleus
- ROI
- region of interest
- TBS
- Tris-buffered saline.
References
- 1. Mayer J, Bates MW. Blood glucose and food intake in normal and hypophysectomized, alloxan-treated rats. Am J Physiol. 1952;168:812–819 [DOI] [PubMed] [Google Scholar]
- 2. Mayer J. The glucostatic theory of regulation of food intake and the problem of obesity. Bull N Engl Med Cent. 1952;14:43–49 [PubMed] [Google Scholar]
- 3. Mayer J. Glucostatic mechanism of regulation of food intake. N Engl J Med. 1953;249:13–16 [DOI] [PubMed] [Google Scholar]
- 4. Marshall NB, Mayer J. Specificity of gold thioglucose for ventromedial hypothalamic lesions and hyperphagia. Nature. 1956;178:1399–1400 [DOI] [PubMed] [Google Scholar]
- 5. Debons AF, Silver L, Cronkite EP, et al. Localization of gold in mouse brain in relation to gold thioglucose obesity. Am J Physiol. 1962;202:743–750 [DOI] [PubMed] [Google Scholar]
- 6. Olney JW. Brain lesions, obesity, and other disturbances in mice treated with monosodium glutamate. Science. 1969;164:719–721 [DOI] [PubMed] [Google Scholar]
- 7. Perez VJ, Olney JW. Accumulation of glutamic acid in the arcuate nucleus of the hypothalamus of the infant mouse following subcutaneous administration of monosodium glutamate. J Neurochem. 1972;19:1777–1782 [DOI] [PubMed] [Google Scholar]
- 8. van Houten M, Posner BI, Kopriwa BM, Brawer JR. Insulin binding sites localized to nerve terminals in rat median eminence and arcuate nucleus. Science. 1980;207:1081–1083 [DOI] [PubMed] [Google Scholar]
- 9. Lynch RM, Tompkins LS, Brooks HL, Dunn-Meynell AA, Levin BE. Localization of glucokinase gene expression in the rat brain. Diabetes. 2000;49:693–700 [DOI] [PubMed] [Google Scholar]
- 10. Millán C, Martínez F, Cortés-Campos C, et al. Glial glucokinase expression in adult and post-natal development of the hypothalamic region. ASN Neuro. 2010;2:e00035. [DOI] [PMC free article] [PubMed] [Google Scholar]
- 11. Muroya S, Yada T, Shioda S, Takigawa M. Glucose-sensitive neurons in the rat arcuate nucleus contain neuropeptide Y. Neurosci Lett. 1999;264:113–116 [DOI] [PubMed] [Google Scholar]
- 12. Wang R, Liu X, Hentges ST, et al. The regulation of glucose-excited neurons in the hypothalamic arcuate nucleus by glucose and feeding-relevant peptides. Diabetes. 2004;53:1959–1965 [DOI] [PubMed] [Google Scholar]
- 13. Fioramonti X, Contié S, Song Z, Routh VH, Lorsignol A, Pénicaud L. Characterization of glucosensing neuron subpopulations in the arcuate nucleus: integration in neuropeptide Y and pro-opiomelanocortin networks? Diabetes. 2007;56:1219–1227 [DOI] [PubMed] [Google Scholar]
- 14. van den Top M, Lee K, Whyment AD, Blanks AM, Spanswick D. Orexigen-sensitive NPY/AgRP pacemaker neurons in the hypothalamic arcuate nucleus. Nat Neurosci. 2004;7:493–494 [DOI] [PubMed] [Google Scholar]
- 15. Mullier A, Bouret SG, Prevot V, Dehouck B. Differential distribution of tight junction proteins suggests a role for tanycytes in blood-hypothalamus barrier regulation in the adult mouse brain. J Comp Neurol. 2010;518:943–962 [DOI] [PMC free article] [PubMed] [Google Scholar]
- 16. Olofsson LE, Unger EK, Cheung CC, Xu AW. Modulation of AgRP-neuronal function by SOCS3 as an initiating event in diet-induced hypothalamic leptin resistance. Proc Natl Acad Sci USA. 2013;110:E697–E706 [DOI] [PMC free article] [PubMed] [Google Scholar]
- 17. Routh VH. Glucose-sensing neurons: are they physiologically relevant? Physiol Behav. 2002;76:403–413 [DOI] [PubMed] [Google Scholar]
- 18. Grill HJ. Distributed neural control of energy balance: contributions from hindbrain and hypothalamus. Obesity (Silver Spring). 2006;14(suppl 5):216S–221S [DOI] [PubMed] [Google Scholar]
- 19. Watts AG, Khan AM, Sanchez-Watts G, Salter D, Neuner CM. Activation in neural networks controlling ingestive behaviors: what does it mean, and how do we map and measure it? Physiol Behav. 2006;89:501–510 [DOI] [PubMed] [Google Scholar]
- 20. Ritter S, Dinh TT, Li AJ. Hindbrain catecholamine neurons control multiple glucoregulatory responses. Physiol Behav. 2006;89:490–500 [DOI] [PubMed] [Google Scholar]
- 21. Watts AG, Donovan CM. Sweet talk in the brain: glucosensing, neural networks, and hypoglycemic counterregulation. Front Neuroendocrinol. 2010;31:32–43 [DOI] [PMC free article] [PubMed] [Google Scholar]
- 22. Grill HJ, Hayes MR. Hindbrain neurons as an essential hub in the neuroanatomically distributed control of energy balance. Cell Metab. 2012;16:296–309 [DOI] [PMC free article] [PubMed] [Google Scholar]
- 23. Gu G, Cornea A, Simerly RB. Sexual differentiation of projections from the principal nucleus of the bed nuclei of the stria terminalis. J Comp Neurol. 2003;460:542–562 [DOI] [PubMed] [Google Scholar]
- 24. Dong HW, Swanson LW. Projections from bed nuclei of the stria terminalis, posterior division: implications for cerebral hemisphere regulation of defensive and reproductive behaviors. J Comp Neurol. 2004;471:396–433 [DOI] [PubMed] [Google Scholar]
- 25. Dong HW, Swanson LW. Projections from bed nuclei of the stria terminalis, anteromedial area: cerebral hemisphere integration of neuroendocrine, autonomic, and behavioral aspects of energy balance. J Comp Neurol. 2006;494:142–178 [DOI] [PMC free article] [PubMed] [Google Scholar]
- 26. Thompson RH, Swanson LW. Structural characterization of a hypothalamic visceromotor pattern generator network. Brain Res Rev. 2003;41:153–202 [DOI] [PubMed] [Google Scholar]
- 27. Thompson RH, Canteras NS, Swanson LW. Organization of projections from the dorsomedial nucleus of the hypothalamus: a PHA-L study in the rat. J Comp Neurol. 1996;376:143–173 [DOI] [PubMed] [Google Scholar]
- 28. Ricardo JA, Koh ET. Anatomical evidence of direct projections from the nucleus of the solitary tract to the hypothalamus, amygdala, and other forebrain structures in the rat. Brain Res. 1978;153:1–26 [DOI] [PubMed] [Google Scholar]
- 29. Muroya S, Funahashi H, Yamanaka A, et al. Orexins (hypocretins) directly interact with neuropeptide Y, POMC and glucose-responsive neurons to regulate Ca2+ signaling in a reciprocal manner to leptin: orexigenic neuronal pathways in the mediobasal hypothalamus. Eur J Neurosci. 2004;19:1524–1534 [DOI] [PubMed] [Google Scholar]
- 30. Swanson LW, Sanchez-Watts G, Watts AG. Comparison of melanin-concentrating hormone and hypocretin/orexin mRNA expression patterns in a new parceling scheme of the lateral hypothalamic zone. Neurosci Lett. 2005;387:80–84 [DOI] [PubMed] [Google Scholar]
- 31. Hahn JD. Comparison of melanin-concentrating hormone and hypocretin/orexin peptide expression patterns in a current parceling scheme of the lateral hypothalamic zone. Neurosci Lett. 2010;468:12–17 [DOI] [PMC free article] [PubMed] [Google Scholar]
- 32. Ritter S, Bugarith K, Dinh TT. Immunotoxic destruction of distinct catecholamine subgroups produces selective impairment of glucoregulatory responses and neuronal activation. J Comp Neurol. 2001;432:197–216 [DOI] [PubMed] [Google Scholar]
- 33. Hudson B, Ritter S. Hindbrain catecholamine neurons mediate consummatory responses to glucoprivation. Physiol Behav. 2004;82:241–250 [DOI] [PubMed] [Google Scholar]
- 34. Fraley GS, Dinh TT, Ritter S. Immunotoxic catecholamine lesions attenuate 2DG-induced increase of AGRP mRNA. Peptides. 2002;23:1093–1099 [DOI] [PubMed] [Google Scholar]
- 35. Fraley GS, Ritter S. Immunolesion of norepinephrine and epinephrine afferents to medial hypothalamus alters basal and 2-deoxy-d-glucose-induced neuropeptide Y and agouti gene-related protein messenger ribonucleic acid expression in the arcuate nucleus. Endocrinology. 2003;144:75–83 [DOI] [PubMed] [Google Scholar]
- 36. Khan AM, Kaminski KL, Sanchez-Watts G, et al. MAP kinases couple hindbrain-derived catecholamine signals to hypothalamic adrenocortical control mechanisms during glycemia-related challenges. J Neurosci. 2011;31:18479–18491 [DOI] [PMC free article] [PubMed] [Google Scholar]
- 37. Khan AM, Walker EM, Kaminski KL, Watts AG. Loss of catecholaminergic afferents to the hypothalamic paraventricular nucleus disrupts arcuate nucleus connections and arcuate responses to glycemic challenges in adult rats. Paper presented at: Neuroscience 2012; October 13–17, 2012; New Orleans, LA Program 684.14 [Google Scholar]
- 38. Paxinos G, Watson C. The Rat Brain in Stereotaxic Coordinates. 4th ed San Diego, CA: Academic Press; 1998 [Google Scholar]
- 39. Khan AM, Watts AG. Intravenous 2-deoxy-d-glucose injection rapidly elevates levels of the phosphorylated forms of p44/42 mitogen-activated protein kinases (extracellularly regulated kinases 1/2) in rat hypothalamic parvicellular paraventricular neurons. Endocrinology. 2004;145:351–359 [DOI] [PubMed] [Google Scholar]
- 40. Salter-Venzon D, Watts AG. The role of hypothalamic ingestive behavior controllers in generating dehydration anorexia: a Fos mapping study. Am J Physiol Regul Integr Comp Physiol. 2008;295:R1009–R1019 [DOI] [PMC free article] [PubMed] [Google Scholar]
- 41. Sawchenko PE, Swanson LW. Central noradrenergic pathways for the integration of hypothalamic neuroendocrine and autonomic responses. Science. 1981;214:685–687 [DOI] [PubMed] [Google Scholar]
- 42. Cunningham ET, Jr, Sawchenko PE. Anatomical specificity of noradrenergic inputs to the paraventricular and supraoptic nuclei of the rat hypothalamus. J Comp Neurol. 1988;274:60–76 [DOI] [PubMed] [Google Scholar]
- 43. Khan AM, Ponzio TA, Sanchez-Watts G, Stanley BG, Hatton GI, Watts AG. Catecholaminergic control of mitogen-activated protein kinase signaling in paraventricular neuroendocrine neurons in vivo and in vitro: a proposed role during glycemic challenges. J Neurosci. 2007;27:7344–7360 [DOI] [PMC free article] [PubMed] [Google Scholar]
- 44. Elias CF, Aschkenasi C, Lee C, Kelly J, Ahima RS. Leptin differentially regulates NPY and POMC neurons projecting to the lateral hypothalamic area. Neuron. 1999;23:775–786 [DOI] [PubMed] [Google Scholar]
- 45. Morikawa Y, Ueyama E, Senba E. Fasting-induced activation of mitogen-activated protein kinases (ERK/p38) in the mouse hypothalamus. J Neuroendocrinol. 2004;16:105–112 [DOI] [PubMed] [Google Scholar]
- 46. Ueyama E, Morikawa Y, Yasuda T, Senba E. Attenuation of fasting-induced phosphorylation of mitogen-activated protein kinases (ERK/p38) in the mouse hypothalamus in response to refeeding. Neurosci Lett. 2004;371:40–44 [DOI] [PubMed] [Google Scholar]
- 47. Rahmouni K, Sigmund CD, Haynes WG, Mark AL. Hypothalamic ERK mediates the anorectic and thermogenic sympathetic effects of leptin. Diabetes. 2009;58:536–542 [DOI] [PMC free article] [PubMed] [Google Scholar]
- 48. Bouret SG, Bates SH, Chen S, Myers MG, Jr, Simerly RB. Distinct roles for specific leptin receptor signals in the development of hypothalamic feeding circuits. J Neurosci. 2012;32:1244–1252 [DOI] [PMC free article] [PubMed] [Google Scholar]
- 49. Bryant DN, Bosch MA, Rønnekleiv OK, Dorsa DM. 17β-Estradiol rapidly enhances extracellular signal-regulated kinase 2 phosphorylation in the rat brain. Neuroscience 2005;133:343–352 [DOI] [PubMed] [Google Scholar]
- 50. Watts AG, Khan AM. Identifying links in the chain: the dynamic coupling of catecholamines, peptide synthesis, and peptide release in hypothalamic neuroendocrine neurons. Adv Pharmacol. 2013;68:421–444 [DOI] [PMC free article] [PubMed] [Google Scholar]
- 51. Date Y, Shimbara T, Koda S, et al. Peripheral ghrelin transmits orexigenic signals through the noradrenergic pathway from the hindbrain to the hypothalamus. Cell Metab. 2006;4:323–331 [DOI] [PubMed] [Google Scholar]
- 52. Jokiaho A, Donovan C, Watts A. Catecholaminergic neurons in the ventrolateral medulla are differentially activated by the rate of fall in blood glucose during hypoglycemia, and are required for the rate-dependent hypoglycemic activation of sympathoadrenal neurons. Paper presented at: Neuroscience 2012; October 13–17, 2012; New Orleans, LA Program 93.05 [Google Scholar]
- 53. Everitt BJ, Meister B, Hökfelt T, et al. The hypothalamic arcuate nucleus-median eminence complex: immunohistochemistry of transmitters, peptides and DARPP-32 with special reference to coexistence in dopamine neurons. Brain Res. 1986;396:97–155 [DOI] [PubMed] [Google Scholar]
- 54. Kaushik S, Rodriguez-Navarro JA, Arias E, et al. Autophagy in hypothalamic AgRP neurons regulates food intake and energy balance. Cell Metab. 2011;14:173–183 [DOI] [PMC free article] [PubMed] [Google Scholar]
- 55. Coupé B, Ishii Y, Dietrich MO, Komatsu M, Horvath TL, Bouret SG. Loss of autophagy in pro-opiomelanocortin neurons perturbs axon growth and causes metabolic dysregulation. Cell Metab. 2012;15:247–255 [DOI] [PMC free article] [PubMed] [Google Scholar]
- 56. Melnick IV, Price CJ, Colmers WF. Glucosensing in parvocellular neurons of the rat hypothalamic paraventricular nucleus. Eur J Neurosci. 2011;34:272–282 [DOI] [PubMed] [Google Scholar]
- 57. Shor-Posner G, Azar AP, Insinga S, Leibowitz SF. Deficits in the control of food intake after hypothalamic paraventricular nucleus lesions. Physiol Behav. 1985;35:883–890 [DOI] [PubMed] [Google Scholar]
- 58. Calingasan NY, Ritter S. Hypothalamic paraventricular nucleus lesions do not abolish glucoprivic or lipoprivic feeding. Brain Res. 1992;595:25–31 [DOI] [PubMed] [Google Scholar]
- 59. Bugarith K, Dinh TT, Li AJ, Speth RC, Ritter S. Basomedial hypothalamic injections of neuropeptide Y conjugated to saporin selectively disrupt hypothalamic controls of food intake. Endocrinology. 2005;146:1179–1191 [DOI] [PubMed] [Google Scholar]