

Abstract
Glucocorticoids have an important role in the resolution of inflammation and clinically they are routinely used to treat allergies, asthma, sepsis, and autoimmune diseases. In addition, glucocorticoids are well recognized to negatively impact the development and function of T cells in the immune system by inducing apoptosis. Less is known however about glucocorticoid function in B lymphocytes. Herein, we demonstrate that the glucocorticoid receptor (GR) is present in B-cell populations isolated from both the spleen and the bone marrow. B-cell populations were found to express more GR than non-B-cell populations from both the spleen and the bone marrow. GR protein was found in all B-cell (B220+) developmental subsets (Mature IgM+IgD+, Immature IgM+IgD−, and Pro/Pre IgM−IgD−) isolated from spleen. GR staining intensity was varied among the B-cell developmental subsets and was found to be higher in B cells isolated from the spleen (secondary lymphoid organ) versus the bone marrow (primary lymphoid organ). Ex vivo cell culture of murine splenocytes and bone marrow lymphocytes indicated that dexamethasone stimulated apoptosis in all B-cell developmental subsets demonstrating glucocorticoid responsiveness. Furthermore, in vivo administration of dexamethasone to adrenalectomized mice reduced B-cell numbers in both spleen and bone marrow. These data suggest that glucocorticoid signaling has an important understudied role in B-cell life-or-death decisions.
Glucocorticoids are steroid stress hormones that are essential for life and have pleotropic effects throughout the body. They are important for immune function, inflammation, reproduction, and all aspects of metabolism. Natural glucocorticoids, cortisol in humans and corticosterone in mice, exert their effects through the nuclear hormone receptor called the glucocorticoid receptor (GR). Both natural and synthetic glucocorticoids are well known for their immunosuppressive effects, and therefore, glucocorticoids are widely prescribed in clinical settings, including autoimmunity, inflammation, sepsis, and lymphatic cancer (1). Glucocorticoid signaling has various effects on the immune system, and extensive research has been done in T cells (2).
B-cell development begins in the bone marrow where hematopoietic stem cells differentiate into common lymphoid progenitors, the earliest stage before B-cell lineage commitment (3). Generally, murine B cells are first identified by expression of the B220 isoform of CD45, a protein tyrosine kinase important for B-cell signaling and activation. B-cell development can be phenotypically determined by cell-surface staining and flow cytometric analysis (Figure 1). Other important phenotypic cell markers include the B-cell coreceptor CD19, the membrane-bound B-cell receptor/immunoglobulin isotypes IgM and IgD, and the CD43 molecule. Pro B cells (B220+CD19+IgM−IgD−CD43+) are seen very early in B-cell development and make up a large percentage of B cells in the bone marrow. These Pro B cells differentiate into Pre B cells (B220+CD19+IgM−IgD−CD43−) and also make up a large percentage of B cells in the bone marrow. B cells of immature phenotype (B220+CD19+IgM+IgD−) make up a large percentage of B cells in both bone marrow and spleen. These IgM+IgD− B cells can be further classified into many different types of transitional B cells using other cell surface markers (3). Finally, B cells of the mature phenotype (B220+CD19+IgM+IgD+) make up most B cells in the spleen, although some IgM+IgD+ B cells remain in the bone marrow. Although many studies have examined glucocorticoid function in developing T cells, little is known about GR in developing B cells.
Figure 1.

B-cell development. B-cell developmental stages and cell surface expression markers (A). Representative flow cytometry plots and gating strategy to phenotypically identify B cells of the spleen (B). Representative flow cytometry plots and gating strategy to phenotypically identify B cells of the bone marrow (C).
Glucocorticoids induce apoptosis in developing thymocytes and T cells, and they are potent suppressors of cytokine production in T cells (4). Several animal models have been produced that have deleted the GR specifically in T cells, rendering them resistant to glucocorticoid-induced apoptosis and elucidating the role of glucocorticoid signaling in T-cell development and function (4). In contrast, much less is known about GR signaling and function in B cells. The few studies that have been done suggest glucocorticoids are important for B-cell function. For example, glucocorticoids have been known to alter antibody production and modulate levels of cell surface markers, as human peripheral blood mononuclear cells treated with dexamethasone have higher IgG production from stimulated B cells, although these effects were shown to be dependent on monocytes (5). Others have observed a direct effect of glucocorticoids in stimulating IgE production directly in B cells (6). Dexamethasone treatment can reduce major histocompatibility complex class II levels on resting B cells ex vivo, an effect that is maintained in vivo on resting B cells with dexamethasone challenge, but not activated B cells (7). Several studies have shown that chronic glucocorticoid treatment reduces B-cell numbers in vivo. Prednisone treatment in mice results in decreased spleen mass as well as reduced numbers of B cells in the bone marrow (8) and similar effects were seen with chronic corticosterone treatments (9). Moreover, dexamethasone has been known to induce a loss of progenitor cells in bone marrow (10). Finally, B lineage precursor populations were shown to be expanded in bone marrow after treatment with the glucocorticoid antagonist RU486 or adrenalectomy, implicating a role for endogenous glucocorticoids in B-cell lymphopoiesis (10). Although such studies show that glucocorticoids can modulate B-cell function, they do not elucidate the ability of GR to induce apoptosis during B-cell development.
Herein, we analyzed GR expression levels in B-cell developmental subsets from murine spleen and bone marrow using a newly developed flow cytometry assay. We report robust GR expression in B cells compared with all other non-B-cell splenocytes. GR was found in all B-cell developmental stages that were investigated, and the synthetic glucocorticoid dexamethasone induced apoptosis in all B-cell developmental subsets. Interestingly, this apoptotic effect was independent of GR expression level in each B-cell subset. In vivo challenge of mice with dexamethasone had a preferential negative effect on immature B cells in the spleen, while equally affecting pro, pre, and immature B cells of the bone marrow. These data indicate that GR is expressed during B-cell development and glucocorticoids induce apoptosis in B cells in the periphery and the bone marrow, underlining the importance of glucocorticoid signaling in B cells. Moreover, even short-term administration of glucocorticoids has a major impact on B cells, an effect which may have an immunological impact in clinical settings where glucocorticoid treatment is widespread.
Materials and Methods
Experimental animals, tissue harvest, and cell isolation
Male C57BL/6 mice (8–20 wk old) were housed in a specific pathogen-free environment with 12-hour light/dark cycles at 20–25°C. Adrenalectomized animals were purchased from Charles River and given 0.85% saline water. Spleen and thymus tissue were removed and placed in a dish with 3 mL RPMI 1640 (Invitrogen) with 5% fetal calf serum (tissue medium). Mouse femurs were removed and cleaned of muscle, cut in half, and flushed with excess tissue medium. Splenocytes, thymocytes, and bone marrow cells were teased into a single-cell suspension through a 70-μm cell strainer (BD Labware) in tissue medium. Red blood cells were lysed with 1× red cell lysis buffer. Cells were washed, centrifuged at 1400g (2500 rpm) for 5 minutes, and resuspended in 2–5 mL tissue medium. Cell counts were acquired using the Countess Automated Cell Counter per manufacturer's protocol (Invitrogen). All animal procedures were approved by the National Institute of Environmental Health Sciences Institutional Animal Care and Use Committee.
Glucocorticoid treatment
Dexamethasone (1,4-pregnadien-9-fluoro-16-methyl-11β,17,21- triol-3,20-dione) was purchased from Steraloids, reconstituted in sterile PBS, and administered ip at doses indicated in studies. PBS injections were used as a vehicle control.
Immunophenotyping and flow cytometry
Direct immunofluorescence staining was performed with antimouse directly conjugated monoclonal antibodies: anti-CD19− eFluor 450, anti-IgM−PE, anti-IgD−FITC (ebioscience), anti-B220−PerCPCy5.5, anti-CD3−AF488 (BD Biosciences), and anti-CD43−APC−Cy7 (BioLegend). Cell suspensions were added to PBS Wash (1× PBS + 1% BSA + 0.1% sodium azide), stained with antibodies, washed, and resuspended in PBS Wash containing 0.4% (w/v) paraformaldehyde. Data were acquired on a BD LSRII and analyzed with FlowJo software (TreeStar, Inc).
Intracellular staining for GR
After surface staining, cells were fixed in 4% paraformaldehyde for 10 minutes at room temperature, washed, and permeabilized with 0.01% Triton X-100. Rabbit polyclonal anti-GR antibody (57) was produced in our laboratory (11). Goat anti-rabbit-APC secondary antibody (Invitrogen) was used for fluorescent detection. Rabbit IgG was used as an isotype control and the peptide used to generate the antibody was preincubated at 10 μg/mL for 1 hour before where indicated.
MACS separation
Enriched B-cell populations were acquired using magnetic bead separation with MACS CD45R/B220 microbeads (Miltenyi BioTech) according to manufacturer's protocol. Briefly, fresh splenocytes were isolated and resuspended in MACS buffer (PBS, 0.5% BSA, 2 mM EDTA, degassed). Anti-CD45R/B220 beads were incubated with cells for 15 minutes at 4°C. Cells were washed and separated over a magnetic LS column and washes were saved as flow thru. B cells were eluted by removing the column from the magnet and washing the column.
Protein extraction and Western blotting
Cells were pelleted and lysed either in 0.5% NP-40 1 mM EDTA solution containing protease inhibitors or directly in Laemmli sample buffer with beta mercaptoethanol. The resulting whole-cell extracts were sonicated for 10 seconds, clarified by microcentrifugation, and quantitated with BCA protein quantitation kit (Pierce). Cell extracts were resolved on 10% Tris-Glycine gels (Invitrogen) and electrophoretically immobilized onto nitrocellulose membranes. Membranes were probed with either anti-57-GR or anti-59-GR antibodies (1:1000) (11), and anti-β-actin antibodies (1:500; Chemicon). After washing, membranes were incubated with secondary antibody (1:10 000) for 1 hour at room temperature. Blots were developed using the Amersham enhanced chemiluminescence detection reagents (GE Healthcare Bio-Sciences Corp) or the LI-COR Odyssey Infrared Imaging System (LI-COR Biosciences). Densitometry and quantification were performed by using ImageJ software or the LI-COR Image Studio software, respectively.
Ex vivo experiments
Splenocytes were isolated and resuspended in RPMI 1640, 10% fetal bovine serum, 1× beta mercaptoethanol. Cells were incubated at 37°C, 5% CO2 with or without Dexamethasone (100 nM) for 0, 6, or 12 hours. Where indicated, RU486 was used at a 1-μM concentration. Cell counts were obtained using Countess Automated Cell Counter. Cells were immunophenotyped and cell viability was determined with violet LIVE/DEAD Fixable Dead Cell Stain Kits (Invitrogen) per manufacturer's protocol. For apoptosis analysis, cells were incubated with CaspaTag Pan-Caspase In Situ Assay Kit, Fluorescein (FAM-VAD-FMK) (Millipore) per manufacturer's protocol.
RNA isolation and real-time PCR
RNA was isolated from MACS-enriched B cells using the Qiagen RNeasy mini kit according to the manufacturer's protocol. RNA (100 ng) was converted to cDNA and amplified using iScript One-Step RT-PCR Kit for Probes (Bio-Rad). Real-time PCR was performed using the Bio-Rad CFX96 sequence detection system using primer/probes targeted to the glucocorticoid-induced leucine zipper (GILZ) and cyclophilin B (Applied Biosystems). Relative fluorescent signal from each gene transcript was normalized to the housekeeping gene cyclophilin B using the ΔΔCT method (12). Data are expressed as relative mRNA levels of control.
Statistical analysis
For animal studies and ex vivo experiments, a two-tailed Student's t test, one-way ANOVA, or two-way ANOVA was used where appropriate to compare the means between data sets. For glucocorticoid staining intensity comparisons among B-cell subtypes, a one-way ANOVA was performed followed by a Tukey test. Differences were considered significant with P ≤ .05.
Results
GR expression in murine B lymphocytes
GR expression was first evaluated in different immune cell types. Thymocytes, splenocytes, and bone marrow cells were isolated from young C57BL/6 mice, and GR was detected by flow cytometry and Western blot analysis. Most splenocytes were positive for GR expression compared with staining with isotype or peptide blocked controls (Figure 2A). Two populations were identified in bone marrow cells: a GR-positive population and a GR-negative population (Figure 2B). Thymocytes, well known for their expression of GR, stained positive for GR (Figure 2C). The presence of GR was also observed in cells isolated from the thymus, spleen, and bone marrow by Western blot analysis (Figure 2D). Quantification of Western blot analyses shows that isolated cells from the thymus have the highest amount of immunoreactive GR protein, followed by less expression of GR in cells isolated from the spleen, and low receptor expression in cells isolated from the bone marrow (Figure 2E). To investigate GR expression further, cell populations were also stained for immunophenotype markers to determine GR expression specifically among subsets. When gated on the pan B-cell marker B220, GR expression was found to be modestly higher in B220+ B cells (red line; Figure 2F) than B220− non–B cells of the spleen (blue line). The geometric mean fluorescence intensity (GMFI) was calculated for these populations to compare the staining intensity of GR. GMFI from B220− non–B cells was significantly lower than GMFI from B220+ B cells (Figure 2F, P < .05). Similarly, bone marrow cells were also analyzed. We found most B220+ B cells to express GR (red line; Figure 3C). The B220− non–B-cell population (blue line; Figure 2G) contained both GR-positive and GR-negative cells. When GMFI staining intensity of the receptor was compared among subsets, the GMFI from B220+ B cells was significantly higher than B220− non–B cells of the bone marrow (Figure 2F, P < .05). Taken together, these results indicated GR was expressed in cells of the spleen and at least one cell type of the bone marrow.
Figure 2.

GR in cells of the immune system. Cells were freshly isolated from the thymus, spleen, and bone marrow and were stained for GR expression levels and analyzed by flow cytometry. Representative histogram of splenocytes (A), bone marrow cells (B), and thymocytes as a positive control (C) stained for the murine GR (blue line) or isotype control (black line, filled). Splenocytes were also stained with antibody preabsorbed (10 μg/mL for 1 h) with the peptide used to generate the antibody (green line). Representative Western blot analysis of isolated cells from the thymus, spleen, and bone marrow analyzed for GR and β-actin (D). Samples obtained from bone marrow with a longer exposure show that GR is indeed present (D). Relative GR protein levels normalized to β-actin from three separate experiments (E). Isolated splenocytes or bone marrow cells were stained for GR expression levels and analyzed by flow cytometry. Representative histogram of murine GR expression of splenocytes gated on B220 expression (A). GMFI of GR staining of B220+ and B220− splenocytes populations, n = 13 (B). Representative histogram of murine GR expression of bone marrow cells gated on B220 expression (C). GMFI of GR staining of B220+ and B220− bone marrow cell populations, n = 13 (D). Student's t tests were used for statistical analysis. *, P < .05.
Figure 3.

GR protein levels in B cells. Enriched B-cell populations were analyzed for GR protein levels by Western blot analysis. Western blot analysis of GR and β-actin in splenocytes from three separate enrichment experiments and a positive control GRα-expressing U2OS cell line (A). Relative GR protein levels normalized to β-actin levels in spleen, n = 3 (B). Western blot analysis of GR and β-actin in bone marrow cells from three separate enrichment experiments and a positive control GRα-expressing U2OS cell line (C). Relative GR protein levels normalized to β-actin levels in bone marrow, n = 3 (D). Student's t tests were used for statistical analysis. *, P < .05.
GR expression in murine B-cell developmental subtypes
We also determined GR expression in murine B cells by Western blot analysis in enriched B-cell populations from spleen using MACS magnetic separation columns. Unseparated splenocyte samples consisted of approximately 40%–50% B cells (Supplemental Figures 1 and 2, published on The Endocrine Society's Journals Online web site at http://endo.endojournals.org). After magnetic separation, B-cell-enriched populations were 81%–95% pure. The Flow Thru washes contained mostly T cells, as 68%–75% of the Flow Thru samples were positive for the pan T-cell marker CD3. Western blot analysis for GR protein and β-actin expression in three magnetic separation experiments is shown in Figure 3A. Relative GR protein levels show that B220+ enriched B cells have more GR protein than the B220− non–B cells collected during the Flow Thru wash (Figure 3B). Similarly, bone marrow cells were stained and separated by B220 MACS beads on a magnetic column. Western blot analysis for GR protein and β-actin expression in three magnetic separation experiments is shown in Figure 3C. GR is detectable in the enriched B-cell fraction, whereas the non–B-cell fraction is approaching the limits of detection (Figure 3C). Relative GR protein levels show that B220+ enriched B cells also have more GR protein than the B220− non–B cells collected during the Flow Thru wash (Figure 3D).
To analyze expression of GR levels in B-cell developmental subsets using an alternative method, total cells where phenotyped, stained intracellularly for GR, and analyzed using flow cytometry. Using surface staining of additional cell markers, we could further differentiate between Pre/Pro cells using an antibody against CD43. Using the staining profile and gating strategy introduced in Figure 1, we analyzed GR staining intensity of Mature, Immature, Pre, and Pro B-cell populations. Figure 4, A (spleen) and B (bone marrow), shows representative staining of each B-cell developmental subset. Each histogram reveals positive intracellular GR staining (blue line) compared with isotype controls (black line) in every subtype examined. Figure 5A shows the GMFI staining intensities from spleen (black bars) and bone marrow (white bars). The GMFI of Pro B cells from spleen was significantly higher than the other subtypes. Statistically significant differences in GMFI exist between mature and immature subsets, mature and pre subsets, and Pro and Pre subsets of the bone marrow (Figure 5A, comparing white bars, P < .05). These results indicated that B cells express GR at comparable levels to other immune cells. B-cell development occurs as a continuum of changing phenotypic markers and changing environments as cells leave the bone marrow and circulate in the periphery. We hypothesized that GR levels may be different in B cells depending on where they reside as they complete the developmental process. Analysis of B cells from bone marrow allows investigation into early B-cell development, whereas analysis of B cells from the spleen represents more functional B-cell populations. Each developmental phenotype can be found in both the bone marrow and the spleen, but in different proportions (Figure 1). Figure 5A also shows that Immature, Pre, and Pro B-cells phenotype had significantly higher staining intensities when isolated from the spleen than the bone marrow (comparing black bars to white bars). Figure 5B shows representative staining histograms of B-cell subsets isolated from spleen (red lines) and bone marrow (blue lines). These results indicate that B cells have varying GR expression levels depending on whether the B cells are isolated from the spleen or bone marrow.
Figure 4.
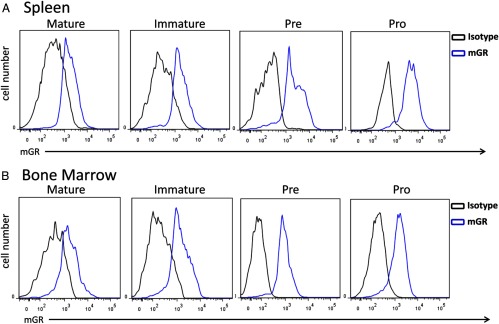
GR levels in B-cell subsets as quantified by flow cytometry. Representative histograms of GR staining of B-cell developmental subsets (IgM+IgD+ Mature, IgM+IgD− Immature, IgM−IgD−CD43− Pre, and IgM−IgD−CD43+ Pro) from spleen (A) or bone marrow (B).
Figure 5.

Differential expression of GR in B cells from spleen and bone marrow. Mixed cell populations were phenotyped and evaluated for GR expression levels using flow cytrometry. GR levels are higher in Immature, Pre, and Pro B cells isolated from spleen than B cells of the same phenotype isolated from bone marrow. GMFI of GR staining in B cells from spleen (black bars) and bone marrow (white bars), n = 6 (A). Statistical analysis was done using a two-way ANOVA (comparing spleen/black bars with bone marrow/white bars). *, P < .05. Representative histogram of GR staining of B-cell developmental subsets from spleen (red lines) and bone marrow (blue lines), n = 6 (B).
B-cell sensitivity to glucocorticoid-induced apoptosis
After establishing that GR is expressed in all B-cell developmental subtypes, we investigated the functional capacity of dexamethasone-induced GR signaling to activate apoptosis in B-cell subsets ex vivo. Splenocytes were freshly isolated and cultured for 12 hours with and without 100 nM dexamethasone. Cell survival and population immunophenotype were monitored over time. In both B220+ B cells (red lines; Figure 6A) and B220− non–B cells (blue lines) total cell numbers decreased over 12 hours in 100 nM dexamethasone compared with controls. A decrease in total cell number was seen in both B220+ B-cell and B220− non–B-cell populations after 6 hours of dexamethasone treatment. By 12 hours, dexamethasone treatment had depleted most B220+ B cells. Figure 6B shows the relative percentage survival of B220+ B-cell and B220− non–B-cell populations after dexamethasone treatment. There were no differences in sensitivities of B220+ B cells compared with B220− non–B cells at 0 or 6 hours after dexamethasone treatment, but the percentage of surviving B220+ B cells was significantly reduced compared with the percentage of surviving B220− non–B cells after 12 hours of exposure to dexamethasone. When B-cell populations were phenotypically divided into developmental subsets for analysis, interestingly, the rate of cell death among B-cell subtypes (Mature, Immature, Pro/Pre) were the same.
Figure 6.

Dexamethasone-induced B-cell death ex vivo. Splenocytes and bone marrow cells were cultured ex vivo in the presence or absence of 100 nM dexamethasone. Total cell numbers of B220+ and B220− splenocytes, n = 16 (A). Percentage loss of B220+ B-cells and B220− non–B-cells from spleen, n = 16 (B). Percentage cell survival of B-cell developmental subsets from spleen, n = 16 (C). Total cell numbers of B220+ B cells and B220− non–B cells from bone marrow cells, n = 6 (D). Percentage loss of B220+ and B220− bone marrow cells, n = 6 (E). Percentage cell survival of B-cell developmental subsets from bone marrow, n = 6 (F). Student's t tests were used for statistical analysis. *, P < .05.
B-cell sensitivity to dexamethasone in bone marrow cells ex vivo was also examined. Only total cell number of B220+ B cells (red lines; Figure 6D) was reduced by dexamethasone treatment. Dexamethasone did not induce a loss of total cells in the B220− non–B-cell population obtained from the bone marrow. The increased sensitivity of B220+ B cells to dexamethasone can be seen when the percentage survival of cells was analyzed. Percentage survival of B220+ B cells was significantly reduced at 6 and 12 hours after dexamethasone treatment when compared with percentage survival of B220− non–B-cell populations (Figure 6E). Similar to observations in cells isolated from spleen, no differences were seen in the relative sensitivity among B-cell subtypes of the bone marrow, although all B-cell subsets died in response to dexamethasone (Figure 6F).
To determine if the mechanism of cell death was indeed apoptosis, we used a carboxyfluorescein-labeled fluoromethyl ketone peptide inhibitor of caspase (FAM-VAD-FMK) Caspatag reagent. After 6 hours of cell culture, both B220+ B-cell and B220− non–B-cell splenocyte populations contained basal levels of Caspatag+ cells (Figure 7A). The addition of dexamethasone significantly increased the frequency of Caspatag+ cells in both B220+ B-cell and B220− non–B-cell populations (Figure 7A). When we further examined the frequency of Caspatag+ cells by gating on B-cell developmental subsets, we found significantly reduced basal caspase activation from Mature developmental compartment compared with Immature and Pro/Pre subtypes (Figure 7B, white bars). Glucocorticoid treatment significantly increased the frequency of Caspatag+ cells in all B-cell subsets from spleen (Figure 7B, black bars). We also evaluated apoptosis in bone marrow cells. After 6 hours of cell culture, both B220+ B-cell and B220− non–B-cell populations also contained basal levels of Caspatag+ cells (Figure 7C, white bars). However, addition of dexamethasone significantly increased the frequency of Caspatag+ cells in B220+ B cells, but not B220− non–B cells (Figure 7C). Glucocorticoid treatment significantly increased the frequency of Caspatag+ cells in all B-cell subsets isolated from the bone marrow (Figure 7D). Furthermore, the use of the GR antagonist RU486 was able to reverse the dexamethasone-induced increase in Caspatag+ cells in B cells from both spleen and bone marrow (Figure 7, E and F). These results demonstrate that B cells of all developmental subsets are sensitive to dexamethasone-induced apoptosis, regardless of whether they are isolated from the spleen or bone marrow, and that this effect is dependent on the presence of a functional GR.
Figure 7.

Dexamethasone-induced apoptosis in B cells. Splenocytes and bone marrow cells were cultured ex vivo in the presence or absence of 100 nM dexamethasone and apoptosis was assessed after 6 hours using a carboxyfluorescein-labeled fluoromethyl ketone peptide inhibitor of caspase (FAM-VAD-FMK) Caspatag kit. Percentage of Caspatag+ B220+ B cells and B220− non–B cells from spleen, n = 3 (A). Percentage of Caspatag+ B-cell developmental subsets from spleen, n = 3 (B). Percentage of Caspatag+ B220+ B cells and B220− non–B cells from bone marrow, n = 3 (A). Percentage of Caspatag+ B-cell developmental subsets from bone marrow, n = 3 (D). Statistical analysis was done using a two-way ANOVA. *, P < .05.
Actions of dexamethasone on murine B cells in vivo
To determine if glucocorticoids have an impact on B cells in vivo as well as ex vivo, we next injected adrenalectomized mice with dexamethasone. Mice were either treated with a single dose of dexamethasone and sacrificed 24 hours later, or treated with two doses at 0 hours and 24 hours and sacrificed at 48 hours. Subsequently, cellularity and phenotype of splenocytes and bone marrow cells were analyzed by flow cytometry. Thymus weight was significantly reduced 1 day after a single dose and 2 days after a double dose (Supplemental Table 1), indicating a successful glucocorticoid challenge. Spleen weight and total number of splenocytes were significantly reduced 1 day after a single dose of dexamethasone and 2 days after two doses of dexamethasone. Total B cells were also significantly reduced by 1 day after steroid challenge and remained reduced at 2 days (Figure 8A). These results are consistent with dexamethasone-induced cell death; however, migration from the spleen into circulation could not be ruled out by these experiments. Although B220− non–B cells were not reduced until 2 days after dexamethasone challenge (Figure 8), splenic B cells of Immature phenotype were negatively impacted the most by dexamethasone treatment in these in vivo experiments (Figure 8C).
Figure 8.

Dexamethasone-induced B-cell death in vivo. Dexamethasone injections (3 mg/kg, ip) were administered as a single injection (sacrificed 24 h later) or two consecutive daily injections (sacrificed 48 h later) and B-cell numbers were assessed. Total B220+ and B220− cells from spleen at 1 day (A) and 2 days (B). Percentage cell loss of B-cell developmental subsets from spleen at 1 day after dexamethasone injection (C). Total B220+ and B220− cells from bone marrow at 1 day (D) and 2 days (E). Percentage cell loss of B-cell developmental subsets from bone marrow at 2 days after dexamethasone injection (F). n = 6. Student's t tests were used for statistical analysis. *, P < .05.
The effects of glucocorticoid treatment in vivo on bone marrow cells were analyzed, and we observed that a single dose of dexamethasone did not have any impact on total cellularity or total B-cell numbers after 1 day of exposure (Supplemental Table 1 and Figure 8). However, two doses of dexamethasone significantly decreased total bone marrow cells (Supplemental Table 1). Both B220+ B cells and B220− non–B cells were significantly reduced by consecutive glucocorticoid treatment (Figure 8). B-cells subtypes of the Pro, Pre, and Immature phenotypes, but not in the Mature phenotype, were reduced by dexamethasone challenge. These data indicate that short-term administration of dexamethasone is a potent inducer of B-cell loss in vivo in both B cells from the spleen and bone marrow.
Finally, in addition to evaluating apoptosis, we also examined gene expression of GILZ mRNA 6 hours after dexamethasone treatment in both splenic and bone marrow B cells enriched by MACS separation. Interestingly and consistent with our data on apoptosis, GILZ mRNA was significantly induced in splenic B cells in vivo, but not in bone marrow B cells (Supplemental Figures 3 and 4). These in vivo results reflect the pattern of steroid response we observed in glucocorticoid-induced apoptosis in vivo.
Discussion
We report here an in-depth investigation of glucocorticoids in B-cell developmental subsets from murine spleen and bone marrow. GR is expressed robustly in B cells at all examined developmental stages. Dexamethasone induced B-cell apoptosis in all B cells isolated from spleen and bone marrow indiscriminate of developmental stage or GR level. In vivo challenge, however, revealed that immature B cells were preferentially sensitive to the effects of glucocorticoids. Interestingly, multiple dexamethasone injections were required to affect B-cell number in bone marrow in vivo and did not impact mature B-cell numbers in vivo. These studies indicate that GR is highly expressed during B-cell development and that glucocorticoids exert major effects on B cells in the periphery and the bone marrow, demonstrating a role for glucocorticoids in B-cell function.
The use of flow cytometry for analysis of GR expression has been relatively limited. In mouse tissues, flow cytometry has been used to evaluate GR in cells isolated from spleen, thymus, and liver without regard to specific phenotype or developmental stage (13). Human studies of GR levels have been generally restricted to clinical settings of disease, such as systemic lupus erythematosus (14) or posttraumatic stress disorder (15). Studies using flow cytometry to investigate developmental stages have been conducted on murine thymocytes, which are acutely sensitive to glucocorticoids. Two research groups found GR expression to be highest in CD4−CD8− double-negative thymocytes, and CD4+CD8+ double-positive thymocytes to have the lowest GR expression despite being the most sensitive to glucocorticoid-induced apoptosis (16, 17). Our use of flow cytometry is these settings offers a powerful single-cell analysis into what is by nature a complex heterogeneity of cells, and therefore, we included this type of analysis to answer whether there were differences in GR levels in B cells.
Both flow cytometry and Western blot analysis clearly detect GR in immune tissues, with thymocytes serving as a positive control (Figure 2). A large shift in the GMFI is consistent with positive expression in most white cells of the spleen. Analysis of bone marrow cells shows both GR+ and GR− cells, which serves as an internal negative control. GR is thought to be ubiquitously expressed throughout the body and has been confirmed in thymocytes, T cells, monocytes, and neutrophils (18). We hypothesized that B cells would have comparable expression of GR to other immune cells. Interestingly, we found B cells to have higher GR expression than other cell types found in the spleen and bone marrow (Figure 2). One study reported similar results in which B cells expressed higher levels of GR than T cells in human patients with posttraumatic stress disorder (15). Our single-cell flow cytometric analysis was powerful enough to detect even small differences in GR expression levels. Although the reduced expression level in B220− non-B vs B220+ B-cell splenocytes is also seen by Western blot, flow cytometry histograms reveal that the reduced expression is not uniform. Rather, most B220− non–B cells express GR at similar levels, whereas some B220−non–B cells either do not express GR at all or fall below the limits of detection of the assay. These results indicate that B cells express at least as much GR as other immune cell subtypes and suggest that they could respond directly to the effects of glucocorticoids.
GR levels in B-cell developmental subsets identified from isolated splenocytes showed little difference (Figure 5, black bars), with only early Pro B cells having higher GR levels. Pro B cells make up a very small percentage of splenic B cells, but these cells are slightly larger than other B cells ([19] and Supplemental Figure 3), which may account for the higher GR level. Interestingly, there were no differences in percentage cell survival among Mature, Immature, or Pro/Pre B-cell subtypes when exposed to dexamethasone ex vivo, suggesting that the increased GR levels in Pro B cells of the spleen do not result in any functional difference in apoptotic outcome. It remains possible that the total number of Pro/Pre cells isolated from spleen is too low to detect a slight difference in sensitivity to dexamethasone-induced apoptosis. In vivo, however, it appears that B cells of immature phenotype are the most sensitive to the effects of glucocorticoids, because that subset has the greatest percentage cell loss compared with other B-cell subtypes. The statistically significant loss in total immature B-cell number after dexamethasone injection was the most dramatic of the B-cell subsets, further exemplifying the immature B-cell subset as the most sensitive to glucocorticoid-induced cell death, at least in adrenalectomized mice. It is unlikely that GR levels innately correlate to sensitivity in these subtypes, because there is no difference in glucocorticoid-induced apoptosis when cells are harvested and cultured ex vivo. It is possible that complex microenvironmental factors may influence the sensitivity to immature B cells in the spleen over other B-cell subtypes. Indeed microenvironmental factors can play important roles in the responsiveness of cells to glucocorticoids. For instance, a small population of mature thymocytes remains unaffected by supraphysiological doses of glucocorticoids in vivo, yet still undergo apoptosis ex vivo (20). Furthermore, the apoptotic response is just one facet of GR signaling. Future studies will be necessary to evaluate B-cell transcriptomes from cells of different developmental stages. Although an apoptotic response to high levels of steroids demonstrates the functionality of GR, the physiological role of GR in B cells is substantially more complex, yet beyond the scope of the current study.
A larger variation in GR expression levels was found in B cells isolated from bone marrow, although the biological significance of this remains unclear. Similar to B cells isolated from spleen, there were no differences in subset sensitivity to glucocorticoid-induced apoptosis ex vivo. In vivo challenge with dexamethasone revealed an even distribution among the reduced cell number of Immature, Pre, and Pro B-cell subtypes in the bone marrow. Only B cells of mature phenotype were not significantly reduced in the bone marrow. Mature B cells can come from completed maturation in the bone marrow, or from recirculating IgM+IgD+ cells that have left the bone marrow, completed maturation in the spleen, and returned to the bone marrow (21). It is likely that the resistant population of mature B cells is from a recirculating pool of mature B cells and not from a mechanism of innate resistance, because B cells of mature phenotype are sensitive to dexamethasone-induced apoptosis ex vivo. Overall, these results do not indicate that GR levels correlate or anticorrelate with sensitivity to glucocorticoid-induced apoptosis, as is seen with other cell types such as thymocytes (17). We speculate that the differences in GR levels seen between B cells in spleen (higher GR) vs bone marrow (lower GR) will not actually predict the level of sensitivity to glucocorticoid-induced apoptosis. There are likely many microenvironmental and gene expression changes associated with B cells as they transition from the bone marrow to the spleen.
The acute sensitivity of B cells vs B220− non–B cells to dexamethasone was minimal in splenocyte cultures and exacerbated in ex vivo bone marrow cultures, where apoptosis was selectively induced only on B220+ B cells. Although it remains possible that another cell type could be contributing to the negative effects of dexamethasone on B cells, the fact that B cells express GR, activate caspase signaling, and die in response to dexamethasone treatment highly suggests a direct effect on B cells. Furthermore, the apoptotic effects induced by dexamethasone were dependent on GR, as GR antagonist RU486 abolished dexamethasone-induced apoptosis (Figure 7). It is interesting to note that cell death in B cells from bone marrow appear to take longer in vivo than cell death in B cells from spleen. Whether this effect is influenced by the relative levels of GR in B cells from spleen or bone marrow remains unclear, although it may take longer for dexamethasone to reach the bone marrow. Interestingly, the total number of B220− non–B cells, which includes hematopoietic stem cells, stromal cells, macrophage-lineage cells, and other granulocytes, was significantly reduced in vivo but not ex vivo. Perhaps this is because of a higher dose in vivo, or the microenvironment was negatively impacted, because glucocorticoid therapy is known to induce osteonecrosis (22). However, we cannot rule out the effects of glucocorticoids on the stromal cells and their indirect effects on B cells, as has been previously reported for T cells (20). These studies are important because most studies have been done on the chronic effects of stress hormones or glucocorticoid therapy. Our results clearly indicate that short-term treatment of dexamethasone has a major negative impact on B cells in vivo.
Acknowledgments
This research was supported by the Intramural Research Program of the NIH, National Institute of Environmental Health Sciences/NIH.
Disclosure Summary: The authors have nothing to disclose.
For News & Views see page 339
- FAM-VAD-FMK
- CaspaTag Pan-Caspase In Situ Assay Kit, Fluorescein
- GILZ
- glucocorticoid-induced leucine zipper
- GMFI
- geometric mean fluorescence intensity
- GR
- glucocorticoid receptor.
References
- 1. Rhen T, Cidlowski JA. Antiinflammatory action of glucocorticoids—new mechanisms for old drugs. N Engl J Med. 2005;353:1711–1723 [DOI] [PubMed] [Google Scholar]
- 2. Zen M, Canova M, Campana C, et al. The kaleidoscope of glucorticoid effects on immune system. Autoimmun Rev. 2011;10:305–310 [DOI] [PubMed] [Google Scholar]
- 3. Hardy RR, Hayakawa K. B cell development pathways. Ann Rev Immunol. 2001;19:595–621 [DOI] [PubMed] [Google Scholar]
- 4. Herold MJ, McPherson KG, Reichardt HM. Glucocorticoids in T cell apoptosis and function. Cell Mol Life Sci. 2006;63:60–72 [DOI] [PMC free article] [PubMed] [Google Scholar]
- 5. Emilie D, Karray S, Crevon MC, Vazquez A, Galanaud P. B cell differentiation and interleukin 2 (IL2): corticosteroids interact with monocytes to enhance the effect of IL2. Eur J Immunol. 1987;17:791–795 [DOI] [PubMed] [Google Scholar]
- 6. Jabara HH, Ahern DJ, Vercelli D, Geha RS. Hydrocortisone and IL-4 induce IgE isotype switching in human B cells. J Immunol. 1991;147:1557–1560 [PubMed] [Google Scholar]
- 7. McMillan VM, Dennis GJ, Glimcher LH, Finkelman FD, Mond JJ. Corticosteroid induction of Ig+Ia- B cells in vitro is mediated via interaction with the glucocorticoid cytoplasmic receptor. J Immunol. 1988;140:2549–2555 [PubMed] [Google Scholar]
- 8. Voetberg BJ, Garvy BA, Mayer HK, King LE, Fraker PJ. Apoptosis accompanies a change in the phenotypic distribution and functional capacity of murine bone marrow B-cells chronically exposed to prednisolone. Clin Immunol Immunopathol. 1994;71:190–198 [DOI] [PubMed] [Google Scholar]
- 9. Garvy BA, King LE, Telford WG, Morford LA, Fraker PJ. Chronic elevation of plasma corticosterone causes reductions in the number of cycling cells of the B lineage in murine bone marrow and induces apoptosis. Immunology 1993;80:587–592 [PMC free article] [PubMed] [Google Scholar]
- 10. Igarashi H, Medina KL, Yokota T, et al. Early lymphoid progenitors in mouse and man are highly sensitive to glucocorticoids. Int Immunol. 2005;17:501–511 [DOI] [PubMed] [Google Scholar]
- 11. Cidlowski JA, Bellingham DL, Powell-Oliver FE, Lubahn DB, Sar M. Novel antipeptide antibodies to the human glucocorticoid receptor: recognition of multiple receptor forms in vitro and distinct localization of cytoplasmic and nuclear receptors. Mol Endocrinol. 1990;4:1427–1437 [DOI] [PubMed] [Google Scholar]
- 12. Livak KJ, Schmittgen TD. Analysis of relative gene expression data using real-time quantitative PCR and the 2(-Delta Delta C(T)) Method. Methods. 2001;25:402–408 [DOI] [PubMed] [Google Scholar]
- 13. Butts CL, Shukair SA, Duncan KM, Harris CW, Belyavskaya E, Sternberg EM. Evaluation of steroid hormone receptor protein expression in intact cells using flow cytometry. Nucl Recept Signal. 2007;5:e007. [DOI] [PMC free article] [PubMed] [Google Scholar]
- 14. Du J, Li M, Zhang D, et al. Flow cytometry analysis of glucocorticoid receptor expression and binding in steroid-sensitive and steroid-resistant patients with systemic lupus erythematosus. Arthritis Res Ther. 2009;11:R108. [DOI] [PMC free article] [PubMed] [Google Scholar]
- 15. Gotovac K, Sabioncello A, Rabatic S, Berki T, Dekaris D. Flow cytometric determination of glucocorticoid receptor (GCR) expression in lymphocyte subpopulations: lower quantity of GCR in patients with post-traumatic stress disorder (PTSD). Clin Exp Immunol. 2003;131:335–339 [DOI] [PMC free article] [PubMed] [Google Scholar]
- 16. Berki T, Pálinkás L, Boldizsár F, Németh P. Glucocorticoid (GC) sensitivity and GC receptor expression differ in thymocyte subpopulations. Int Immunol. 2002;14:463–469 [DOI] [PubMed] [Google Scholar]
- 17. Wiegers GJ, Knoflach M, Böck G, et al. CD4(+)CD8(+)TCR(low) thymocytes express low levels of glucocorticoid receptors while being sensitive to glucocorticoid-induced apoptosis. Eur J Immunol. 2001;31:2293–2301 [DOI] [PubMed] [Google Scholar]
- 18. Miller AH, Spencer RL, Pearce BD, et al. Glucocorticoid receptors are differentially expressed in the cells and tissues of the immune system. Cell Immunol. 1998;186:45–54 [DOI] [PubMed] [Google Scholar]
- 19. Hardy RR, Carmack CE, Shinton SA, Kemp JD, Hayakawa K. Resolution and characterization of pro-B and pre-pro-B cell stages in normal mouse bone marrow. J Exp Med. 1991;173:1213–1225 [DOI] [PMC free article] [PubMed] [Google Scholar]
- 20. Oldenburg NB, Evans-Storms RB, Cidlowski JA. In vivo resistance to glucocorticoid-induced apoptosis in rat thymocytes with normal steroid receptor function in vitro. Endocrinology. 1997;138:810–818 [DOI] [PubMed] [Google Scholar]
- 21. Cariappa A, Chase C, Liu H, Russell P, Pillai S. Naive recirculating B cells mature simultaneously in the spleen and bone marrow. Blood. 2007;109:2339–2345 [DOI] [PubMed] [Google Scholar]
- 22. Gruver-Yates AL, C JA. Tissue-specific actions of glucocorticoids on apoptosis: a double-edged sword. Cells. 2013;202–223 [DOI] [PMC free article] [PubMed] [Google Scholar]