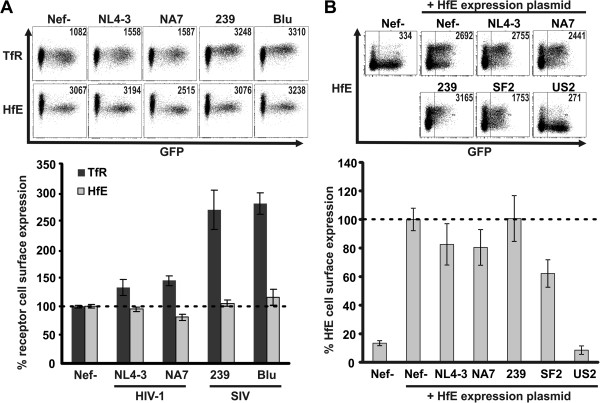
Figure 1.
Effects of Nef expression on cell surface levels of TfR and HfE. (A) THP-1 cells were infected with HIV-1 coexpressing different Nef proteins and GFP via an IRES. 48 hours post infection cells were surface stained with antibodies against TfR or HfE and analysed by flow cytometry. Depicted are mean values and standard deviation (SD) from three independent experiments. (B) 293 T cells were transfected with pCG-IRES-GFP plasmids expressing the indicated Nef and cotransfected with an HfE expression plasmid. 36 hours later cells were harvested and cell surface levels of HfE were assessed by antibody staining and flow cytometry. Mean values and SD are derived from three independent experiments.

