Abstract
Gliomas are the most common brain tumors affecting the central nervous system and are associated with a high mortality rate. DCF1 is a membrane protein that was previously found to play a role in neural stem cell differentiation. In the present study, we found that overexpression of dcf1 significantly inhibited cell proliferation, migration, and invasion and dramatically promoted apoptosis in the glioblastoma U251 cell line. DCF1 deletion mutations in the functional region showed that the complete structure of DCF1 was necessary for apoptosis. Furthermore, significantly lower tumorigenicity was observed in athymic nude mice by transplanting U251 cells overexpressing dcf1. To decode the apoptosis induced by dcf1, mitochondrial structure and membrane potential in glioma cells were investigated and the results indicated obvious mitochondrial swelling, destruction of cristae, and a significant decline in membrane potential. Mechanismly, caspase-3 signaling was activated. Finally, endogenous dcf1 silence in U251 cells was investigated. Results showed a highly methylation at −1339 and −1322 position at dcf1 promoter sequence, revealing the causal relationship between dcf1 gene and tumorigencicity. The present study identified a previously unknown cancer apoptosis mechanism involving dcf1 overexpression and provided a novel approach to potentially treat glioma patients.
Glioblastomas (GBMs) are the most aggressive brain tumors in humans and have the worst prognoses, with a median survival time of approximately 14 months and are almost invariably fatal1. Due to the resistance of tumor cells to conventional therapies, it is very difficult to treat GBMs2,3,4; however, the identification of genes or proteins that effectively inhibit tumor growth is expected to break through this bottleneck5. Our previous study revealed that dendritic cell factor (dcf1), also known as tmem59, was involved in differentiation of neural stem cells (NSCs)6, since dcf1 silencing tends to differentiate NSCs into astrocytes7,8. We further found that GFAP, a marker of astrocytes, was significantly upregulated both in gene and protein arrays using dcf1 knockout mice, suggesting that there may be a lower expression level of dcf1 in glioma cells. Gene array analysis also showed that dcf1 expression in grade I and II gliomas was higher than that in grade III and IV (Sup. 1a), and dcf1 expression was decreased in the U251 glioma cell line compared to normal astrocyte cells (Sup. 1b). At the same time, we detected dcf1 expression in normal mouse brain tissue and transplanted gliomas, with similar results (Sup. 1c–e). In view of these assumptions, we transfected dcf1 into the U251 glioma cell line and identified an obvious tumor suppression not only in the cells but also in vivo.
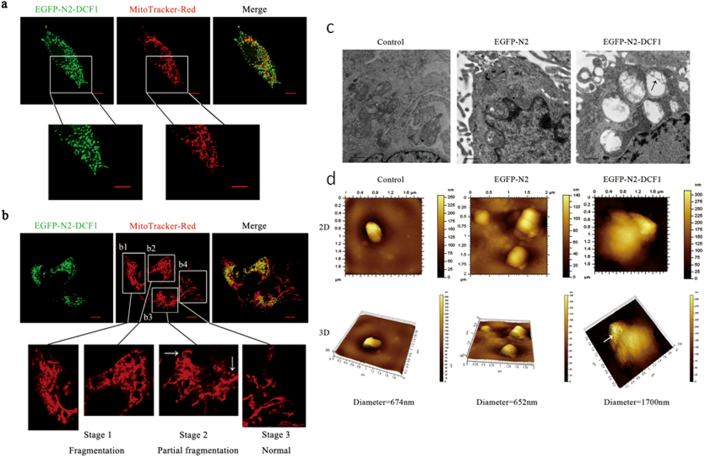
To study dcf1 membrane localization, we first performed immunofluorescence analysis using HeLa cells overexpressing dcf1, and found that DCF1 was distributed outside the nucleus (Sup. 2a). Next, we constructed a dcf1 vector using the pEGFP-N2 vector for transfection of U251 glioma cells, in which endogenous dcf1 expression was undetectable. The distribution of DCF1 in mitochondria was shown using the mitochondria-specific dye MitoTracker® Red CMXRos (Fig. 1a). A closer examination revealed mitochondrial fragmentation or fission9 upon ectopic DCF1 expression (Fig. 1b). Interestingly, all DCF1-expressing mitochondria were ruptured (Fig. 1b1, b2), whereas those not expressing DCF1 remained normal (Fig. 1b4). The same was true even in the same cell, non-expression of DCF1 retained normal mitochondrial structure (Fig. 1b3; white arrow on the left), whereas DCF1 expression led to fragmentation of the mitochondrial structure (Fig. 1b3; white arrow on the right), suggesting a crucial step toward triggering cell apoptosis10,11.
Figure 1. dcf1 overexpression caused mitochondrial fission in U251 glioma cell lines.
(a). Co-localization of dcf1 (green) and mitochondria (red) in U251 cells transfected with pEGFP-N2-DCF1. Scale bars, 10000 nm. (b). dcf1 expression leaded to mitochondrial fisson, showing a precursor of cell apoptosis. The mitochondria fissioned in the presence of dcf1 (b1, b2), but remained normal in the cell without transfection of dcf1 (b4). (c). TEM image of swelled mitochondria and almost disappeared cristae(black arrow) in U251 cell overexpressed with DCF1. Scale bars,0.5 μm. (d).AFM image of out membrane appearance change of swelled mitochondrial in U251 cell overexpressed with DCF1. Scale bars, 10000 nm.
To define the structural changes of mitochondria that are due to dcf1 expression, we observed mitochondria using transmission electron microscopy (TEM)12. Compared with controls, mitochondrial swelling and cristae destruction were detected in cells overexpressing DCF1 (Fig. 1c; black arrow)13. Changes in mitochondrial morphology was further investigated using atomic force microscopy (AFM), which showed that the mitochondria swelled to 1700 nm in cells overexpressing DCF1, which was more than twice that of controls (Fig. 1d), suggesting the role of DCF1 in mitochondrial destruction. At the same time, we discovered many hollow spaces in the outer membrane of the mitochondria (indicated by white arrow), suggesting the opening of mitochondrial permeability transition pores14.
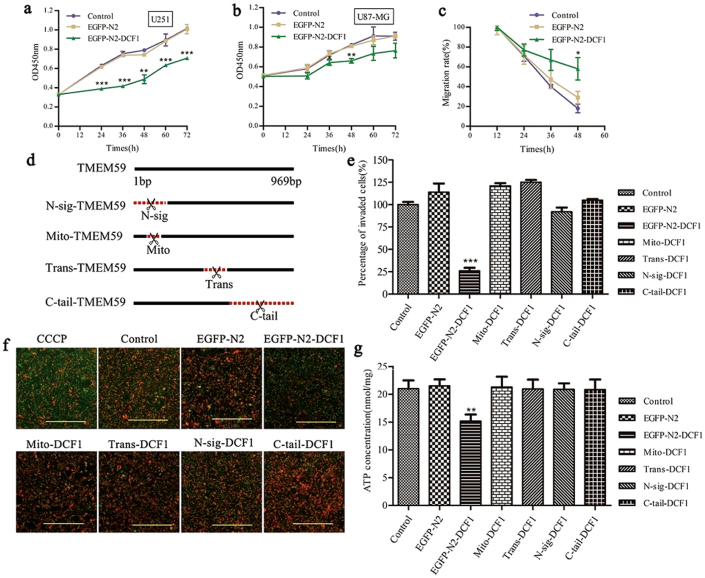
Following our observations of mitochondrial damage in U251 cells caused by DCF1 overexpression, we next examined the effects of DCF1 on cell viability including proliferation, migration, and invasion. The cell proliferation rate was evaluated using a CCK-8 Cell Counting Kit at 24, 36, 48, 60, and 72 h post-transfection15. In comparison to control groups, exogenous DCF1 significantly inhibited growth of U251 cells at 24–72 h post-transfection (Fig. 2a). The same result was shown in the glioma cell line U87-MG, although not as extensive as in U251 cells (Fig. 2b). However, there was no inhibition of DCF1 in other tumor cell lines, including MCF-7, H1299, K-562, and HEK293T, demonstrating specific inhibition of DCF1 in glioma cells. Considering the important characteristics of tumor cells, we next investigated the effects of DCF1 on cell migration and invasion16,17,18. When dcf1 was expressed in U251 cells, both cell migration and invasion were significantly decreased compared with control cells (Fig. 2c and 2e; Sup. 2b)19.
Figure 2. DCF1 suppressed glioma cell proliferation, migration and invasion via declining mitochondrial membrane potential and decreaseing ATP synthesis.
(a), (b),The cell proliferation in U251 and U87-MG were significantly inhibited in the expression of DCF1 by CCK8 assay. (c),The migration of U251 was also significantly decreased with DCF1 expression. (d). The schematic diagram of DCF1 deletion in 4 different sites. (e). Full-length sequence of DCF1 leaded to a decrease of cell invasion in U251, but mutants had no effects on it. (f). Full-length sequence of DCF1 leaded to a decrease of mitochondrial membrane potential, but different mutant in DCF1 remained normal state. Scale bars, 200 μm. (g). ATP concentration in cells was significantly reduced compared with mutants in expression of DCF1 suggesting the necessity of a complete sequence of DCF1 in executing its function. (n = 3 per group,*P < 0.05,**P < 0.01,***P < 0.001). Error bars, s.d.
To examine the functional region in DCF1, we examined the entire protein sequence using the PSORT Nakai Server (psort.hgc.jp) and determined the existence of an N-terminal signal sequence, mitochondrial targeting sequential motif, a transmembrane region, and a cytoplasmic tail. Next, we designed and constructed 4 deletion mutants corresponding to these regions (Fig. 2d) and investigated the mitochondrial membrane potential20 following transfection with full-length wild-type dcf1 and the 4 mutants in U251 cells. CCCP, a proton ionophore that disrupts membrane potential, was used as a positive control and the results showed conclusively that only the complete structure of DCF1 reduced membrane potential21, whereas the other mutants did not have the same efficiency (Fig. 2f). Similar results were shown in U87-MG cells (Sup 3a). Therefore, we investigated whether energy generation changed in such a state. As expected, ATP concentration in cells transfected with full-length dcf1 was significantly reduced to approximately 30% of that in other mutants and controls (Fig. 2g), indicating the requirement of DCF1 integrity for biological function.
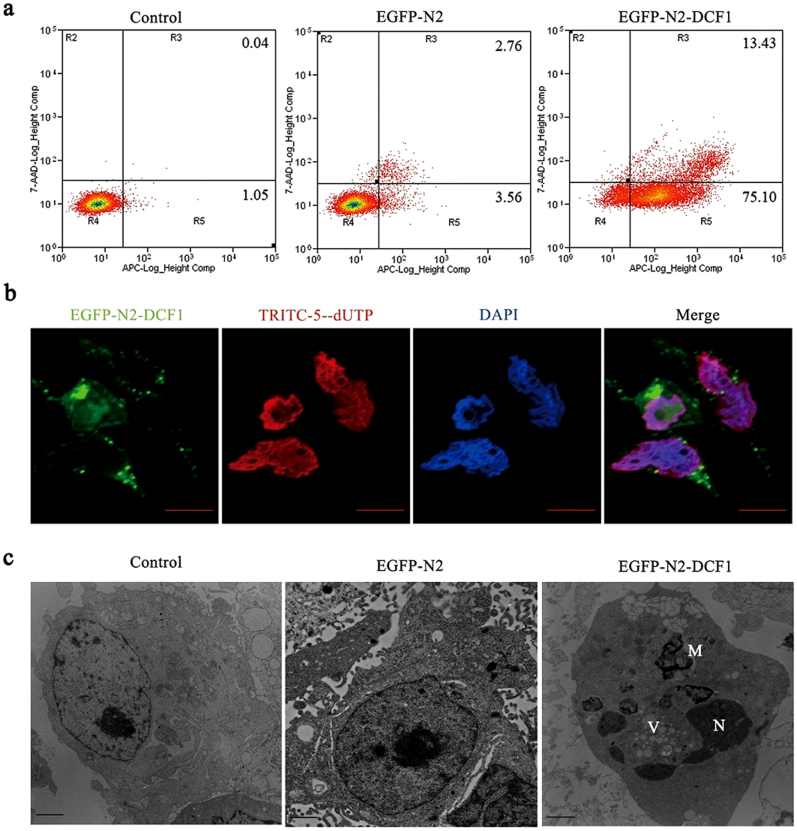
Next, apoptosis of glioma cells was investigated using fluorescence activated cell sorting. After dcf1 transfection for 48 h, 75.1% and 13.4% of cells were in the early and late stages of apoptosis, respectively, compared with control cells (Fig. 3a). The TUNEL assay was also used to detect apoptosis in U251 cells and the results confirmed the occurrence of late apoptosis (Fig. 3b).Apoptosis was further identified using TEM and the results showed DCF1 overexpression initiated a series of apoptotic phenomenon, such as cytoplasmic shrinkage, nuclear fragmentation, autophagosome formation and clusters of vacuoles in the cytoplasm (Fig. 3c).
Figure 3. DCF1 caused U251 cell apoptosis.
(a). After transfection of dcf1 for 48 h, the early apoptosis accounting for about 75% and the late apoptosis accounting for about 13% were analyzed by Annexin V-APC/7-AAD flow cytometry detection. (b). Late cell apoptosis (red) was analyzed by TUNEL methods after transfection of dcf1 for 72 h. Scale bars,10000 nm (c). TEM revealed the occurrence of apoptosis, such as nucleus fragmentation(N), intracellular vacuolization(V), and autophagosome formation(A). Scale bars, 1 μm.
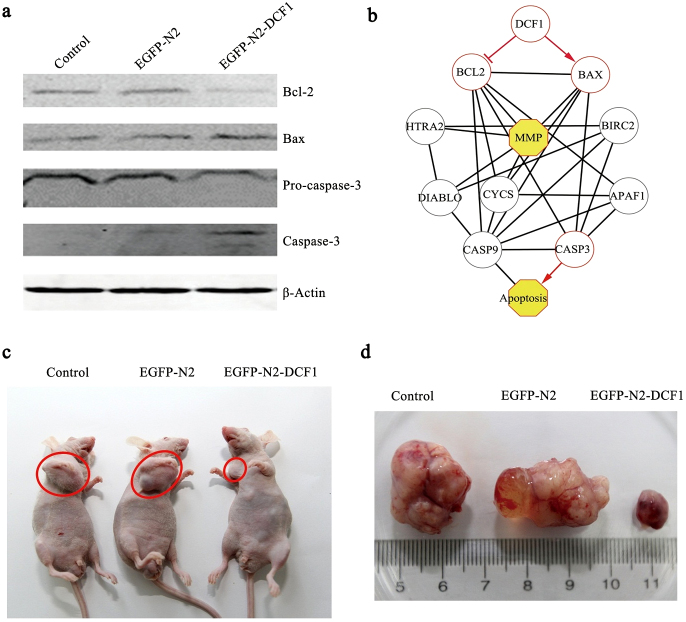
To examine the apoptotic signal mechanism induced by DCF1, we evaluated expression changes in the apoptosis-related proteins Bcl-2 and Bax22. Western blotting showed that DCF1 overexpression up-regulated pro-apoptotic protein Bax expression, whereas it down-regulated anti-apoptotic protein Bcl-2. Next, we investigated whether DCF1 mediated the activation of caspase-3, an apoptosis-related cysteine peptidase. Western blotting revealed that Pro-caspase-3 was cleaved into two activated subunits, suggesting that DCF1 induced glioma cell apoptosis via the Bcl-2 protein family and finally activated the caspase-3 signaling pathway (Fig. 4a). To elucidate the apoptotic mechanisms induced by DCF1 at a systemic level, we proposed a signaling network based on the existing literature and our experiments (Fig. 4b), including known mitochondrial membrane permeability transition pore proteins HTRA2, BIRC2, DIABLO, and CYCS, as well as the apoptosis complex protein APAF123,24. Through activation of BAX, inhibition of BCL-2, and damage to mitochondria, DCF1 eventually leads to apoptosis by activating caspase-3 in an intrinsic apoptosis pathway.
Figure 4. Analyze apoptosis-related proteins and tumorigenicity in vivo.
(a). Western blotting showed that anti-apoptotic protein (Bcl-2) was downregulated, pro-apoptotic protein (Bax) was upregulated, and caspase-3 was activated. (the blots were cropped, and the full-length blots were included in the supplementary information) (b). Prediction of the apoptosis pathway mediated by DCF1. (c), (d). Injection of U251 cells expressed dcf1 into nude mice showed a low tumorigenicity rate and a small tumor volume compared with control groups.
Assuming that tumorigenesis was caused by the downregulation of dcf1, we subcutaneously injected U251 and U251-dcf1 cells into the right flank of nude mice to investigate its tumorigenicity25. After transplantation of U251 cells, tumors were visible at the transplant site with 75% tumorigenicity, whereas nude mice transplanted with U251-dcf1 cells showed tumorigenicity of only 25% (Fig. 4c). More importantly, the difference in tumor size was significant, as the average tumor volume was > 10-fold greater in U251 cells than that in U251-dcf1 cells (Fig. 4d). In addition, tumors in the control groups (U251 cells) had rich vessel distribution, with increased proliferation ability compared with that in the experimental group (U251-dcf1 cells), in which the vessels appeared dark (Fig. 4d). Incidentally, when we evaluated GFAP expression in primary glioma cells isolated from the tumors, the U251-dcf1 group showed less glioma content than the controls (Sup. 3b). An in vivo assay clearly showed that dcf1 indeed contributed to glioma tumorigenicity and could serve as a potential therapeutic target for glioma treatment.
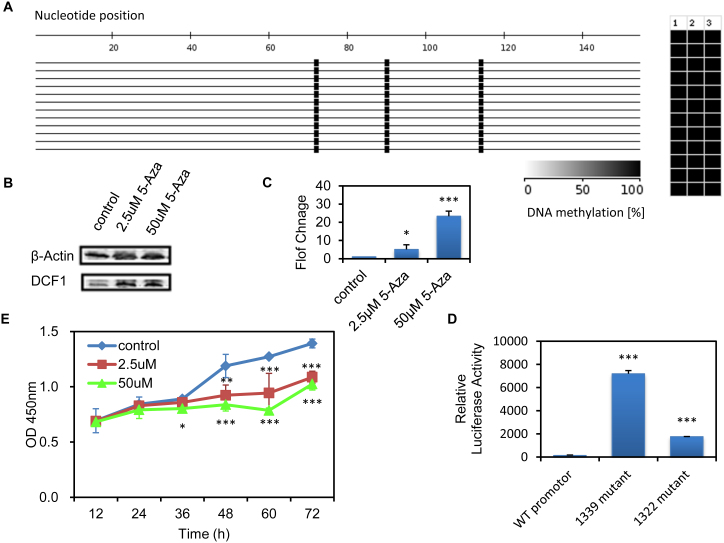
Thanks of a lower expression of dcf1 in the U251 glioma cell, we finally argued the causal relationship between dcf1 and tumorigenicity. We found by Bisulfite-modified genomic DNA analysis that there are 3 CpG sites (−1339, −1322, −1299) from −1350 to −1200 with a complete methylation in dcf1 promoter in U251 cells (Fig. 5 A). To investigate the release from methylation –mediated repression, 5-Azacytidine, an inhibitor of DNA methyltransferaes was used. Results show that expression of dcf1 at both protein and mRNA levels is in a concentration-dependent manner (Fig. 5 B and Fig. 5 C). Correspondingly, methylation mutation at −1339 and −1322 was demonstrated a significant upregulation of dcf1 gene (Fig. 5 D). Further, to assess the effect of dcf1 demethylation on the tumor proliferation, CCK-8 assay was used to detect the viability in cultured U251 glioma cells. The results showed that compared with controls, cells treated with 5-Azacytidine were significantly reduced in cell proliferation, powerfully indicating inhibition of dcf1 to tumorigenicity (Fig. 5 E).
Figure 5. Effects of dcf1 methylation in promoter on the dcf1 expression and cell proliferation.
(A). a Highly methylated at −1339, −1322, −1299 of dcf1 promoter from −1350 to the ATG start codon. (B). Western blot analysis of dcf1 when treated with 5-Azacytidine(2.5 μM, 50 μM), normalize with β-actin. (the blots were cropped, and the full-length blots were included in the supplementary information) (C). dcf1 mRNA expression signifcantly up regulated in treatment of 2.5 μM, 50 μM 5-Azacytidine respectively. (D). dcf1 mutation in −1339 and −1322 leads to dcf1 up-regulation. (E). demethylation of dcf1 supresses cell proliferation, supporting that dcf1 expression inhibits tumorigenicity. The values represent the mean ± SE of three or more experiments. * p < 0.05, ** p < 0.01.
Gliomas are the most lethal brain cancers. Despite great efforts to improve treatment, the survival time of patients remains 14–16 months after diagnosis26. It is therefore particularly important to find an effective treatment for gliomas. Recently, Dyn2 is as an effector to mediates glioma tumor growth and invasion26. Silence of Dyn2 inhibited PDGFR alpha-stimulated phosphorylation of Akt and tumor growth and invasion. HES6, a transcription cofactor, was highly expressed in glioma samples. HES6 silencing showed a reduction of cancer cell proliferation and migration27.
Admittedly, it has been found that many genes are up- or down-regulated in tumorigenesis. Unfortunately, it has not so far found a truly effective treatment of gliomas. In this study, we find that the overexpression of DCF1 significantly inhibits glioma cell proliferation, survivor and ultimately leads to apoptosis, pushing a step forward in understanding the mechanism of tumorigenesis28.
To better understand dcf1 functional mechanisms, we proposed a model based on our experiments and the literature (Sup Fig. 4). In normal mitochondria with cristae integrity, cytochrome c is distributed between the outer and inner mitochondrial membranes29, AIF locates in the inner membrane and Bax partly locates in the cytoplasm22,30. Mitochondrial membrane potential and ATP synthesis maintain normal, cellular physiological activity and procaspase-3 remains in a non-activated state31. When DCF1 is overexpressed, it is embedded in the inner mitochondrial membrane, leading to destruction of the membrane structure, mitochondrial swelling, decreased mitochondrial membrane potential, and inhibited ATP synthesis. This extraneous interference disturbed mitochondrial homeostasis32, resulted in activating of BH-3 only protein10. Then activated BH-3 only protein combined anti-apoptotic protein Bcl-2, and induced changes in Bcl-2 formation11,33. Bax then released from Bcl-2, transferred into the outer mitochondrial membrane34,35, and combined with Bak in a dimeric complex comprising the mitochondrial permeability transition pore36, which altered mitochondrial outer membrane permeability and leaded to partial rupturing of the outer membrane, resulting in mitochondrial swelling in a spherical shape37. Cytochrome c and AIF were released from the mitochondrial membrane interval29,38, and it further participated in the formation of apoptosomes along with procaspase-9, dATP, and APAF-1, which actives downstream caspase enzymes39. Procaspase-3 then becomes active caspase-340. On the other hand, after release from the mitochondria, AIF enters the nucleus and induces nuclear shrinking and DNA fragmentation.
Methods
All experiments were performed in accordance with guidelines and regulations,Shanghai University Ethics Committee approved the experiments.
Plasmid construction
Human dcf1 cDNA was amplified by PCR with Pyrococcus furiosus DNA polymerase, then subcloned into the EcoRI and BamHI restriction sites in the pEGFP-N2 plasmid. For construction of the 4 mutants, the following primers were used: pEGFP-N2-DCF1 (sense, 5′-CGGAATTCATGGCGGCGCCGAAGGGGAG-3′; antisense, 5′-CGGGATCCGTAAAATTTCAGAATGAGCA-3′); pN-sig-DCF1 (sense, 5′-CCGGAATTCATGACCGCTTCGGCTGAAG-3′; antisense, 5′-CGGGATCCGTAAAATTTCAGAATGAGCA-3′); pMito-DCF1(sense-1, 5′-C ATTAATAGTAATCAATTACGGGGTC-3′; antisense-1, 5′-GCTCTAGACCAGAGGCTCCCCTTCGGCG-3′; sense-2, 5′-GCTCTAGACTCCCGCCGCTGCTGCTGCT-3′; antisense-2, 5′-CGGGATCCGTAAAATTTCAGAATGAGCA-3′); and pTrans-DCF1 (sense-1, 5′-CGGAATTCATGGCGGCGCCGAAGGGGAG-3′; antisense-2, 5′-GCTCTAGAAGTTGTAGTTAAAATCCA-3′; sense-2, 5′-GCTCTAGAACAGCTGTGGAGCAGTAT-3′; antisense-2, 5′-CGGGATCCGTAAAATTTCAGAATGAGCA-3′); pC-tail-DCF1 (sense, 5′-CGGAATTCATGGCGGCGCCGAAGGGGAG-3′; antisense, 5′-CGCGGATCCAGCAACAGTTGCACAACA-3′).
Cell cultures
The U251, U87, and HEK293T cell lines were cultured in high-glucose DMEM supplemented with 10% fetal bovine serum (FBS), 1 mM glutamine, 100 U/ml penicillin, and 100 μg/ml streptomycin at 37°C in a humidified atmosphere of 5% CO2. MCF-7, K-562, and H1299 cell lines were cultured in Roswell Park Memorial Institute 1640 medium supplemented with 10% FBS, 1 mM glutamine, 100 U/ml penicillin, and 100 μg/ml streptomycin, at 37°C in a humidified atmosphere of 5% CO2.
Cell transfection
U251 cells were plated in 24-well plates at a density of 1 × 10⁵ cells/well and cultured at 37°C in an atmosphere of 5% CO2 overnight for transfection. A total of l μg pEGFP-N2-DCF1 DNA per well was transfected into U251 cells using Lipofectamine 2000 according to the manufacturer's protocol.
MitoTracker Red staining
Mitochondrial morphology was detected by MitoTracker Red staining. After transfection with pEGFP-N2-DCF1 for 48 h, the culture medium was removed and the cells were stained with pre-warmed 1:1500 10% FBS–DMEM diluted MitoTracker® Red CMXRos dye (Invitrogen) at 37°C for 30 min in a humidified atmosphere of 5% CO2. Then, the loading solution was replaced with fresh pre-warmed 10% FBS–DMEM. After staining, the cells were observed immediately by confocal laser microscopy.
TEM observation
After transfection for 48 h, U251 cells were harvested using a cell scraper and then washed 3 times with PBS. After centrifugation, cells were fixed with 1% glutaraldehyde at 4°C overnight, and then fixed with 1% osmium tetroxide at 4°C for 3 h. After dehydration and resin embedding, U251 cells were sectioned to a 70-nm thickness, stained with uranyl acetate and lead citrate, and the ultrathin sectioned cells were observed using TEM.
Mitochondrial AFM observation
After transfection with plasmid pEGFP-N2 or recombinant plasmid pEGFP-N2-DCF1, mitochondria of U251 cells were isolated using the Mitochondrial Protein Extraction Kit (KeyGen Biotech) using the manufacturer's protocol. Morphological analysis of U251 mitochondria was achieved using an ex situ Agilent 5500 AFM system (Santa Clara, CA), with a scan rate in a tapping mode of 0.5–1 Hz and resonant frequency in the range 160–260 kHz.
Cell proliferation
The effect of dcf1 on cell proliferation was assessed using the CCK-8 Cell Counting Kit. In brief, after seeding cells in 96-well plates for 24 h, the cells were transfected with plasmid pEGFP-N2 or recombinant plasmid pEGFP-N2-DCF1. CCK-8 solution was added to each well at 12-h intervals. After the cells were incubated with CCK-8 solution for 30 min, the absorbance at 450 nm was measured using a microplate reader (Bio-Rad).The cell viability was characterized by optical absorption and each experiment was performed in triplicate.
Cell invasion
The effect of dcf1 on cell proliferation was assessed using the BioCoat™ Matrigel™ Invasion Chamber (BD354480). After transfection of the 4 mutant cell lines with pEGFP-N2 and pEGFP-N2-DCF1 for 48 h, the cells were harvested and adjusted to a density to 5 × 10⁴/ml. After incubation in the invasion chamber for 22 h in a humidified atmosphere of 5% CO2, non-invaded cells were scrubbed with a cotton swab, and transfected cells were stained with crystal violetand observed using a Nikon Ti-S fluorescence microscopeat a magnification of 100×.
JC-1 assay
The mitochondrial membrane potential was evaluated by using the JC-1 Mitochondrial Membrane Potential Detection Kit (Beyotime). In brief, before staining, 1:1000 diluted CCCP was added as a positive control for 30 min in a humidified atmosphere of 5% CO2. After transfection for 48 h, cells were incubated with 1× JC-1 staining solution in 24-well plates for 20 min at 37°C, and rinsed twice with 1× staining buffer. Finally, cells cultured in 10% FBS/DMEM were detected using a Nikon Ti-S fluorescence microscope.
Cellular ATP assay
ATP concentration was detected using the ATP Assay Kit (Beyotime). In brief, cells, including the 4 mutant strains, were cultured in 6-well plates after transfection with pEGFP-N2 or pEGFP-N2-DCF1 for 48 h, lysed, and then centrifuged at 12,000 rpm for 10 min to isolate total protein. Next, 100 μl of supernatant was added to 100 μl of ATP detection solution and standard samples were generated. Luminescence was immediately detected using a plate reader (PerkinElmer). Protein concentration was measured using the Bradford assay.
Flow cytometry
After transfection with pEGFP-N2 or pEGFP-N2-DCF1 for 48 h, U251 cells were digested with trypsin (0.25% in D-Hanks solution without EDTA) and harvested (1 × 10⁶ cells) in 10% FBS–DMEM. Next, cells were washed twice with 2%-BSA–PBS, then resuspended in 500 μl of binding buffer, combined with 5 μl annexin V-APC, and gently mixed. Next, 5 μl of 7-AAD was added according to the protocol of the Annexin V-APC/7-AAD Apoptosis Detection Kit (KeyGen Biotech). Samples were cultured at room temperature for 15 min before flow cytometry (Beckman).
TUNEL assay
U251 cells were rinsed with PBS, fixed in 4% paraformaldehyde for 30 min at room temperature, permeabilized with 1% Triton X-100 for 5 min, and blocked with 3% H202 at room temperature for 10 min. The samples were washed 3 times with PBS, 50 μl TdT enzyme reaction buffer was added to the slide, and incubated at 37°C for 1 h as described in the protocol of the TUNEL Apoptosis Detection Kit (KeyGEN Biotech). After removal of the reaction buffer, the sample was incubated with 50 μl DAPI for 5 min. Fluorescence at 543 nm was detected using the Zeiss LSM 710 confocal microscope.
Immunofluorescence
U251 cells were rinsed with PBS, fixed in 4% paraformaldehyde for 10 min at room temperature, and permeabilized with 0.1% Triton X-100 for 10 min. The cells were blocked with 2% BSA–PBS at room temperature for 60 min, and incubated with primary antibodies at 4°C overnight. After washing 3 times with PBS, cells were incubated with secondary antibodies for 50 min at 37°C, and fluorescence at 488 nm (FITC) and 543 nm (TRITC) were detected using the Nikon Ti-S fluorescence microscope.
Western blotting
At 48 h after transfection, the cells were washed twice with ice-cold PBS and protein was extracted according to the manufacturer's protocol (Beyotime). Protein concentrations were detected using the BCA Protein Assay Kit (Beyotime). The total protein (30 μg) was separated by 12% SDS-PAGE and electroblotted onto nitrocellulose membranes, which were blocked with 5% BSA–PBS for 1 h at room temperature, and then incubated with β-actin antibody (1:1000; Santa Cruz), DCF1 (1:3000), Bcl-2 (1:2000, CST), Bax (1:2000, CST), and procaspase-3 (1:2000, CST) overnight at 4°C. Next infrared dye 800-conjugated affinity-purified goat anti-rat IgG (Zemed, USA) and infrared dye 700-labeled goat anti-rabbit IgG (Zemed, USA) secondary antibodies were added and incubated for 1 h at room temperature. Immunoblotting bands were detected and quantified using the LI-COR Odyssey infrared imaging system (simultaneous two-color targeted analysis) and software (LI-COR).
Cellular tumorigenicity in nude mice
U251 cells transfected with control plasmids or pEGFP-N2-DCF1 for 48 h, harvested by trypsin digestion, then 107 cells were injected subcutaneously into the right flank of the nude mice (4 mice/treatment group).
Author Contributions
T.W. designed and wrote the main manuscript text. Y.X., Q.L., Q.Y., M.Y., Z.Z., R.F., S.Z. and C.H. performed experiments. H.Y. prepared figures. L.Z. and Z.L. did the analysis of system biology.
Supplementary Material
supplementary information
Acknowledgments
This work was supported by the National Natural Science Foundation of China (Grant No 31070954, 81271253,11172158), the Key Innovation Project of Shanghai Municipal Education Commission (Grant No. 14ZZ090) and in part by the First-class Discipline of Universities in Shanghai. We are grateful for the support of Mr. Jie Tao in taking pictures of nude mice. We also acknowledge the technical support of Mr.Pengfei Li for AFM observation.
References
- Van Meir E. G. et al. Exciting new advances in neuro-oncology: the avenue to a cure for malignant glioma. CA Cancer J Clin 60, 166–193 (2010). [DOI] [PMC free article] [PubMed] [Google Scholar]
- Lawson H. C. et al. Interstitial chemotherapy for malignant gliomas: the Johns Hopkins experience. J Neurooncol 83, 61–70 (2007). [DOI] [PMC free article] [PubMed] [Google Scholar]
- Holland E. C. Glioblastoma multiforme: the terminator. Proceedings of the National Academy of Sciences of the United States of America 97, 6242–6244 (2000). [DOI] [PMC free article] [PubMed] [Google Scholar]
- Chen J. et al. A restricted cell population propagates glioblastoma growth after chemotherapy. Nature 488, 522–526 (2012). [DOI] [PMC free article] [PubMed] [Google Scholar]
- Eyler C. E. et al. Glioma stem cell proliferation and tumor growth are promoted by nitric oxide synthase-2. Cell 146, 53–66 (2011). [DOI] [PMC free article] [PubMed] [Google Scholar]
- Wen T., Gu P. & Chen F. Discovery of two novel functional genes from differentiation of neural stem cells in the striatum of the fetal rat. Neuroscience letters 329, 101–105 (2002). [DOI] [PubMed] [Google Scholar]
- Li X. et al. MicroRNA-351 regulates TMEM 59 (DCF1) expression and mediates neural stem cell morphogenesis. RNA biology 9, 292–301 (2012). [DOI] [PubMed] [Google Scholar]
- Wang L. et al. A novel function of dcf1 during the differentiation of neural stem cells in vitro. Cellular and molecular neurobiology 28, 887–894 (2008). [DOI] [PMC free article] [PubMed] [Google Scholar]
- Lin H. Y. et al. Suppressor of cytokine signaling 6 (SOCS6) promotes mitochondrial fission via regulating DRP1 translocation. Cell death and differentiation 20, 139–153 (2013). [DOI] [PMC free article] [PubMed] [Google Scholar]
- Sheridan C. & Martin S. J. Mitochondrial fission/fusion dynamics and apoptosis. Mitochondrion 10, 640–648 (2010). [DOI] [PubMed] [Google Scholar]
- Fulda S., Galluzzi L. & Kroemer G. Targeting mitochondria for cancer therapy. Nat Rev Drug Discov 9, 447–464 (2010). [DOI] [PubMed] [Google Scholar]
- Liu X. et al. A protein interaction network for the analysis of the neuronal differentiation of neural stem cells in response to titanium dioxide nanoparticles. Biomaterials 31, 3063–3070 (2010). [DOI] [PubMed] [Google Scholar]
- Sandoval H. et al. Essential role for Nix in autophagic maturation of erythroid cells. Nature 454, 232–235 (2008). [DOI] [PMC free article] [PubMed] [Google Scholar]
- Sun M. G. et al. Correlated three-dimensional light and electron microscopy reveals transformation of mitochondria during apoptosis. Nature cell biology 9, 1057–1065 (2007). [DOI] [PubMed] [Google Scholar]
- Li Y. et al. Cholera toxin induces malignant glioma cell differentiation via the PKA/CREB pathway. Proceedings of the National Academy of Sciences of the United States of America 104, 13438–13443 (2007). [DOI] [PMC free article] [PubMed] [Google Scholar]
- Li J. et al. Phosphorylation of ACAP1 by Akt regulates the stimulation-dependent recycling of integrin beta1 to control cell migration. Dev Cell 9, 663–673 (2005). [DOI] [PubMed] [Google Scholar]
- Friedl P. & Wolf K. Tumour-cell invasion and migration: diversity and escape mechanisms. Nat Rev Cancer 3, 362–374 (2003). [DOI] [PubMed] [Google Scholar]
- Zhang K. et al. Slug enhances invasion ability of pancreatic cancer cells through upregulation of matrix metalloproteinase-9 and actin cytoskeleton remodeling. Lab Invest 92, 1801 (2012). [DOI] [PMC free article] [PubMed] [Google Scholar]
- Kleber S. et al. Yes and PI3K bind CD95 to signal invasion of glioblastoma. Cancer Cell 13, 235–248 (2008). [DOI] [PubMed] [Google Scholar]
- Kanome T. et al. Characterization of Jumping translocation breakpoint (JTB) gene product isolated as a TGF-beta1-inducible clone involved in regulation of mitochondrial function, cell growth and cell death. Oncogene 26, 5991–6001 (2007). [DOI] [PubMed] [Google Scholar]
- Brenner C. & Grimm S. The permeability transition pore complex in cancer cell death. Oncogene 25, 4744–4756 (2006). [DOI] [PubMed] [Google Scholar]
- Chipuk J. E. et al. Mechanism of apoptosis induction by inhibition of the anti-apoptotic BCL-2 proteins. Proceedings of the National Academy of Sciences of the United States of America 105, 20327–20332 (2008). [DOI] [PMC free article] [PubMed] [Google Scholar]
- Kinnally K. W. & Antonsson B. A tale of two mitochondrial channels, MAC and PTP, in apoptosis. Apoptosis: an international journal on programmed cell death 12, 857–868 (2007). [DOI] [PubMed] [Google Scholar]
- Spencer S. L. & Sorger P. K. Measuring and modeling apoptosis in single cells. Cell 144, 926–939 (2011). [DOI] [PMC free article] [PubMed] [Google Scholar]
- Huang J. et al. Up-regulation of DLK1 as an imprinted gene could contribute to human hepatocellular carcinoma. Carcinogenesis 28, 1094–1103 (2007). [DOI] [PubMed] [Google Scholar]
- Feng H. et al. Dynamin 2 mediates PDGFRalpha-SHP-2-promoted glioblastoma growth and invasion. Oncogene 31, 2691–2702 (2012). [DOI] [PMC free article] [PubMed] [Google Scholar]
- Haapa-Paananen S. et al. HES6 gene is selectively overexpressed in glioma and represents an important transcriptional regulator of glioma proliferation. Oncogene 31, 1299–1310 (2012). [DOI] [PubMed] [Google Scholar]
- Lecoeur H. et al. HIV-1 Tat protein directly induces mitochondrial membrane permeabilization and inactivates cytochrome c oxidase. Cell Death Dis 3, e282 (2012). [DOI] [PMC free article] [PubMed] [Google Scholar]
- Chipuk J. E. et al. Sphingolipid metabolism cooperates with BAK and BAX to promote the mitochondrial pathway of apoptosis. Cell 148, 988–1000 (2012). [DOI] [PMC free article] [PubMed] [Google Scholar]
- Benard G. et al. IBRDC2, an IBR-type E3 ubiquitin ligase, is a regulatory factor for Bax and apoptosis activation. The EMBO journal 29, 1458–1471 (2010). [DOI] [PMC free article] [PubMed] [Google Scholar]
- Li Z. et al. Caspase-3 activation via mitochondria is required for long-term depression and AMPA receptor internalization. Cell 141, 859–871 (2010). [DOI] [PMC free article] [PubMed] [Google Scholar]
- Nunnari J. & Suomalainen A. Mitochondria: in sickness and in health. Cell 148, 1145–1159 (2012). [DOI] [PMC free article] [PubMed] [Google Scholar]
- Lomonosova E. & Chinnadurai G. BH3-only proteins in apoptosis and beyond: an overview. Oncogene 27 Suppl 1S2–19 (2008). [DOI] [PMC free article] [PubMed] [Google Scholar]
- Edlich F. et al. Bcl-x(L) retrotranslocates Bax from the mitochondria into the cytosol. Cell 145, 104–116 (2011). [DOI] [PMC free article] [PubMed] [Google Scholar]
- Dussmann H. et al. Single-cell quantification of Bax activation and mathematical modelling suggest pore formation on minimal mitochondrial Bax accumulation. Cell death and differentiation 17, 278–290 (2010). [DOI] [PubMed] [Google Scholar]
- Soriano M. E. & Scorrano L. Traveling Bax and forth from mitochondria to control apoptosis. Cell 145, 15–17 (2011). [DOI] [PMC free article] [PubMed] [Google Scholar]
- Yip K. W. & Reed J. C. Bcl-2 family proteins and cancer. Oncogene 27, 6398–6406 (2008). [DOI] [PubMed] [Google Scholar]
- Henry-Mowatt J., Dive C., Martinou J. C. & James D. Role of mitochondrial membrane permeabilization in apoptosis and cancer. Oncogene 23, 2850–2860 (2004). [DOI] [PubMed] [Google Scholar]
- Fulda S. & Debatin K. M. Extrinsic versus intrinsic apoptosis pathways in anticancer chemotherapy. Oncogene 25, 4798–4811 (2006). [DOI] [PubMed] [Google Scholar]
- Rasola A. & Bernardi P. Mitochondrial permeability transition in Ca(2+)-dependent apoptosis and necrosis. Cell Calcium 50, 222–233 (2011). [DOI] [PubMed] [Google Scholar]
Associated Data
This section collects any data citations, data availability statements, or supplementary materials included in this article.
Supplementary Materials
supplementary information


