

Abstract
The Sleeping Beauty (SB) transposon is the most widely used DNA transposon in genetic applications and is the only DNA transposon thus far in clinical trials for human gene therapy. In the absence of atomic level structural information, the development of SB transposon relied primarily on the biochemical and genetic homology data. While these studies were successful and have yielded hyperactive transposases, structural information is needed to gain a mechanistic understanding of transposase activity and guides to further improvement. We have initiated a structural study of SB transposase using Nuclear Magnetic Resonance (NMR) and Circular Dichroism (CD) spectroscopy to investigate the properties of the DNA-binding domain of SB transposase in solution. We show that at physiologic salt concentrations, the SB DNA-binding domain remains mostly unstructured but its N-terminal PAI subdomain forms a compact, three-helical structure with a helix-turn-helix motif at higher concentrations of NaCl. Furthermore, we show that the full-length SB DNA-binding domain associates differently with inner and outer binding sites of the transposon DNA. We also show that the PAI subdomain of SB DNA-binding domain has a dominant role in transposase's attachment to the inverted terminal repeats of the transposon DNA. Overall, our data validate several earlier predictions and provide new insights on how SB transposase recognizes transposon DNA.
Keywords: DNA transposon, Sleeping Beauty transposase, paired domain, DNA binding, NMR spectroscopy, Circular Dichroism spectroscopy
Introduction
The ability of DNA transposons to jump/hop (i.e., transpose) from one DNA site or molecule to another is applicable to functional genomics, genetic engineering, and human gene therapy. Several DNA transposons are currently in use in mammalian systems.1 The Sleeping Beauty (SB) transposon was the first DNA transposon characterized in vertebrates2 and thus far it has been the most widely used transposon in genetic applications.3 Moreover, the SB transposon is the first and only DNA transposon system that has been adapted for human gene therapy.4 The SB transposon was reconstructed from the sequences of Tc1/mariner-type transposon that was active in salmonid fish up until about 14 million years ago when it went extinct. Because of its synthetic origins and further developments by many labs, the SB transposon is the most active DNA transposon in vertebrate animal cells.5,6 In contrast to other transposons used in vertebrates, SB appears to be the most random in preferences for integration sites, requiring only a TA dinucleotide basepair.7,8
The structure of a SB transposon is shown in Figure 1(A). The transposon DNA contains the gene to be inserted into the target DNA flanked by inverted terminal repeats (IR-DRleft and IR-DRright). Each inverted terminal repeat contains two, inner and outer, direct repeats (DRs). The DRs represent binding sites for the transposase enzyme. During the reaction of transposition, four transposase enzymes bind to the DRs of the transposon DNA and catalyze the excision of gene from the host DNA and subsequent insertion into the target DNA.2
Figure 1.
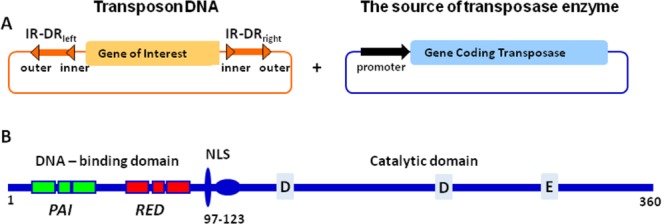
A: Schematic presentation of SB transposon. SB transposon consists of (1) transposon DNA containing the gene of interest to be inserted into a new location (target DNA) and (2) the source of transposase enzyme, typically a plasmid. The transposon DNA is flanked by inverted terminal repeats that contain two direct repeats and are named IR-DRleft or IR-DRright for left or right inverted repeats containing direct repeats. The distinct feature of SB transposons is that left and right inverted terminal repeats contain two, inner and outer direct repeats, to which the transposase enzyme binds. B: Schematic presentation of the domain structure of SB transposase enzyme. Based on the analysis of secondary structure, the DNA-binding domain is predicted to have two subdomains, PAI and RED, containing three alpha-helices. Residues 97–123 represent a nuclear localization signal (NLS). The catalytic domain contains three conserved catalytic residues, the DDE motif.
The structure of SB transposase remains unknown despite multiple attempts to crystallize the protein. However, on the basis of amino acid sequence similarity to other transposases, it was determined that the SB transposase consists of two functional domains, the DNA-binding domain (DBD) and the catalytic domain2 [Fig. 1(B)]. Three catalytic residues, two aspartic and one glutamic acid, have been identified in the catalytic domain of SB transposase. These residues form a signature motif of DD[E/D]-transposases, and in general, of the large family of polynucleotidyl transferases.9 Thus, it is expected that the catalytic domain of SB transposase has an RNase H-like fold as with other DD[E/D]-transposases.10–13 On the other hand, beyond the RNase H-like fold, the structures of catalytic domains in DD[E/D]-transposases vary considerably, and the DD[E/D]-transposases display marked structural diversity within their DNA-binding domains.13 The DNA-binding domain of SB transposase is predicted to form a paired-like structure with two subdomains (PAI + RED = PAIRED) joined by a flexible linker2,14 [Fig. 1(B)]. Each subdomain is predicted to possess three alpha helices, two of which form a helix-turn-helix (HTH) motif that is found in many DNA-binding proteins.15,–17 Although each subdomain contributes to DNA binding, the PAI subdomain is thought to play the dominant role in specific DNA recognition.14
In attempt to improve transposition efficiency the original sequences of both components of the SB system have been modified. The major efforts focused on the engineering of more active transposase enzymes.5,18–21 Several hyperactive variants of SB transposase have been made, with the highest, SB100X, having an activity about 100-fold of the original SB10 transposase.5 Notably, the mutations that lead to enhanced transposition activity are distributed throughout the transposase. The molecular mechanism(s) of the hyperactivity of mutant SB transposases remains unclear; however, it has been proposed that the particular combination of mutations in SB100X might affect the folding properties of the transposase and thereby increase its stability.5 For the transposon itself, even slight variations in the DR sequences can have profound effects on transposition efficiency.18,20,22,23
Interestingly, the DR sequences imbedded in the ITRs of the SB transposon consist of an 18-bp sequence identical in all DRs and flanking sequences of ∼14-bp that vary. The 18-bp sequence, called the DR-core sequence,2 represents the minimal sequence required for transposase binding. For reasons that are not fully understood, maintaining the difference between transposase-binding sites is vital for efficient transposition.23 Experimental structural information on SB transposase and its binding to the transposon DNA is needed to understand this requirement and to facilitate the design of more efficient transposons for basic science and therapeutic applications.
We report here the first experimental structural study of SB transposase binding to the ITRs of the transposon. We used Circular Dichroism and NMR spectroscopy to investigate the structure and properties of the full-length DNA-binding domain and of the PAI subdomain of SB transposase [Fig. 1(B)] in solution, both in free and DNA-bound form. Our results validate predictions made many years ago that the PAI subdomain of SB transposase plays a dominant role in specific DNA recognition.14
Results
Solution conformation of full-length DNA-binding domain of SB transposase
Figure 2(A) shows an assigned [15N,1H]-HSQC spectrum of the DNA-binding domain of SB transposase (102 N-terminal residues) collected at 5°C in aqueous (5% D2O/95% H2O) 20 mM sodium acetate buffer. The spectrum was collected at pH = 5.2, because higher pH resulted in poor spectrum quality and protein precipitation. The standard set of triple resonance experiments was used to assign backbone (HN, N, Cα, and Hα) and side chain resonances of 15N, 13C-labeled DBD.
Figure 2.
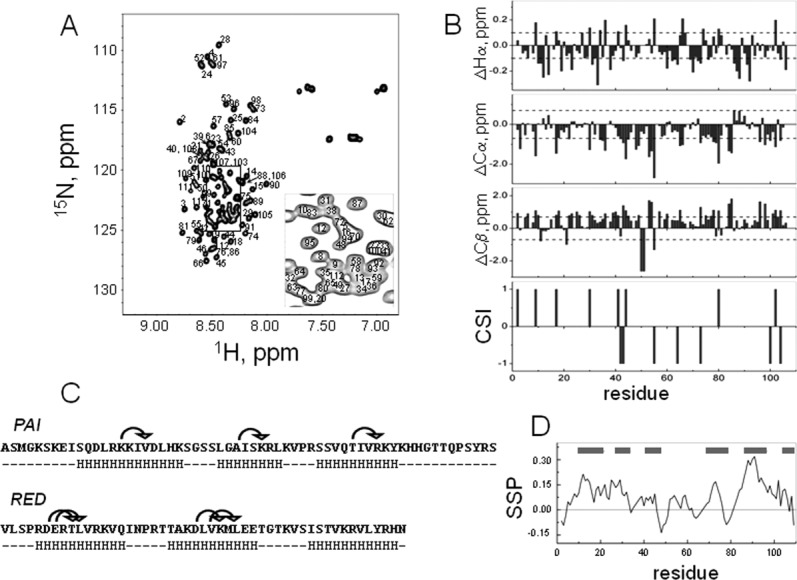
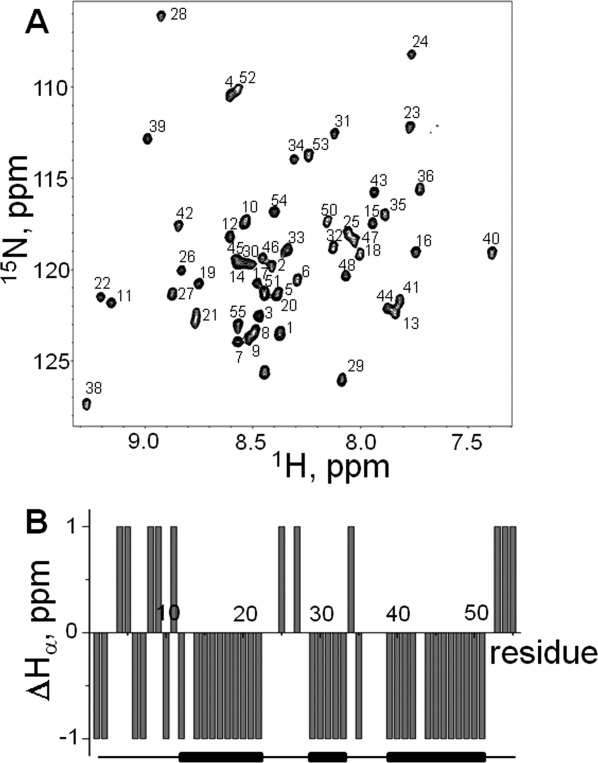
A: [15N,1H]-HSQC spectrum of the DNA-binding domain of SB transposase with assignments shown. The spectrum was acquired at 5°C in aqueous (5% D2O/95% H2O) 20 mM sodium acetate buffer at pH 5.2. The spectrum has poor chemical shift dispersion, showing that the protein is mostly unstructured. B: Chemical shift difference index plots of Hα, Cα, and Cβ. The random coil values for Hα and Cα have been adjusted for sequence dependence.24 The reference lines in these plots correspond to threshold values at which differences begin to reflect regions of possible ordered secondary structure formation.24 Consensus chemical shift index (CSI) was calculated using Hα, Cα, and Cβ chemical shifts. C: Amino acid sequence of the DNA-binding domain of SB transposase, containing the PAI and RED subdomains. Arrows above the sequence show observed (i, i + 3) NOEs, indicative of alpha-helical conformation. HHH stretches below the sequence indicate predicted alpha-helical regions of protein. D: Secondary structure propensity (SSP) score shows tendency towards alphahelical conformation rather than the beta-structure.
The [15N,1H]-HSQC spectrum of SB DBD displays poor dispersion, indicating that the large part of the molecule remains unstructured in solution at these conditions. This is further confirmed by the consensus chemical shift index (CSI) calculated using the differences between measured and random coil values of chemical shifts of Hα, Cα, and Cβ nuclei [Fig. 2(B)].25,26 Nevertheless, a few medium-range (i, i + 3) HN–HN nuclear Overhauser enhancements (NOEs) indicative of alpha-helical structure were detected. These NOEs are shown by arrows above the amino acid sequences of the PAI and RED subdomains [Fig. 2(C)]. Secondary structure prediction using the NNPREDICT algorithm27 shows that the DBD of SB transposase should contain six alpha-helices. The predicted helices indicated by HHH stretches below the amino acid sequences of the PAI and RED subdomains comprise ∼57% of the PAI subdomain [Fig. 2(C)]. All observed medium-range NOEs are located in segments that are predicted to adopt alpha-helical conformations. Further, we used the secondary structure propensity (SSP) program28 and Hα, Cα, and Cβ chemical shifts to calculate the SSP score which provides a quantitative estimate of the populated secondary structure [Fig. 2(D)]. Positive or negative SSP value at a given residue indicates the fraction of alpha and beta-structure formed, respectively, where the score of +1 and −1 reflects fully formed alpha-helix or beta-structure. The SSP analysis shows that the DBD of SB transposase tends to populate alpha-helical conformation rather than the beta-structure, albeit the corresponding propensities are low. The regions of positive SSP score include residues 4–33, 38–45, 52–60, 69–76, 83–106, and correspond to predicted helical regions [gray bars in the Fig. 2(D)] reasonably well. Thus, in solution, some helical structures populate the DBD, consistent with the secondary structure predictions.
Interactions of the full-length SB DNA-binding domain with transposon DNA
Each inverted terminal repeat of the SB transposon has two, nearly identical direct repeats that comprise binding sites [Fig. 1(A)] to which SB transposase has different binding affinities.23 We used NMR spectroscopy to probe the interactions of the full-length SB DBD with its binding sites, located on the left inverted terminal repeat (IR-DRleft) of the transposon DNA [Fig. 3(A)]. Figure 3(B–D) shows the [15N,1H]-HSQC spectra of 15N-enriched DBD of SB transposase either alone (red peaks) or in the presence of an equimolar concentration of each of the DNA sequences (blue peaks): the DR-core (panel B), the DRi (panel C), or the DRo (panel D). After the addition of any of the DNA sequences, the majority of SB DBD resonances exhibit severe broadening, indicating an exchange process that is intermediate on the NMR chemical-shift time-scale.29 Overall spectral changes caused by the addition of different DNA sequences are dissimilar, confirming that SB transposase binds the DR-core, DRi, and DRo differently.
Figure 3.
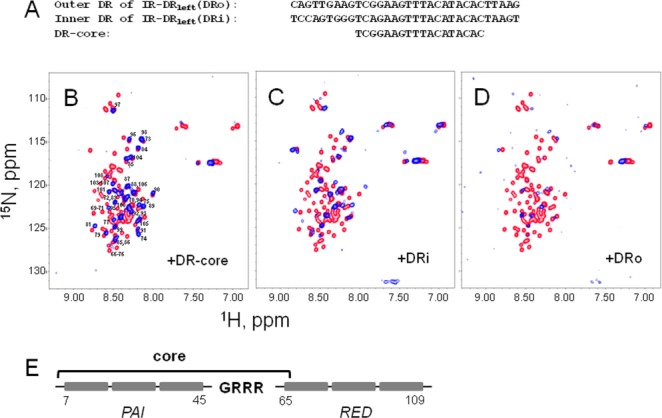
Binding of the DNA-binding domain of SB transposase to DR DNA sequences. A: Sequences of the minimal DR-core DNA sequence required for SB transposase binding and of inner and outer DRs of left inverted terminal repeat, DRi and DRo, are shown. B–D: [15N,1H]-HSQC spectra of SB DBD alone (red) and in the presence of DR-core (panel B), DRi (panel C), and DRo (panel D) DNA sequences at 1:1 molar ratio (blue). The spectra were collected at 5°C in aqueous (5% D2O/95% H2O) 20 mM sodium acetate buffer at pH 5.2. Labels in panel (B) show peaks remaining in the spectrum after the addition of DR-core. E: Schematic representation of the DBD of SB transposase.14 The bracket above DBD indicates residues affected by the binding to the DR-core sequence.
The addition of DR-core DNA sequence to the SB DBD leads to a broadening of resonances that correspond to the residues located primarily in the PAI subdomain. These residues are indicated by the bracket above the schematic representation of SB DBD in Figure 3(E). The majority of resonances originating from the residues in the RED subdomain remain visible in the spectrum [Fig. 3(B)], and many of them are minimally shifted or not shifted at all. Altogether, the changes in [15N,1H]-HSQC observed upon the addition of DR-core DNA sequence show that the PAI subdomain binds to DR-core DNA, whereas the RED subdomain does not, which is consistent with the proposal that the PAI subdomain plays a dominant role in specific DNA recognition.14
Resonance broadening increases in the presence of DRi DNA sequence as compared with DR-core [Fig. 3(B,C)]. Furthermore, some of the remaining resonances shift significantly from initial positions precluding their unambiguous assignment. In addition, a few N-terminal residues (residues 2–4) became observable in the spectrum. As with DR-core DNA sequence, the least affected or not affected resonances originate from the residues in the RED subdomain, located in its C-terminal part.
In contrast to DR-core and DRi, the addition of DRo causes drastic changes in the whole [15N,1H]-HSQC spectrum [Fig. 3(D)]. All resonances experience severe broadening and only a few resonances remain observable. The majority of resonances from the RED subdomain are affected by the addition of DRo, indicating that the RED subdomain may also participate in the binding to DRo. Overall, these data show that the mode of transposase binding to the minimal core-sequence of DRs is modulated by adjacent sequences.
Interactions of PAI subdomain with transposon DNA
The [15N,1H]-HSQC data [Fig. 3(B–D)] indicate that the PAI subdomain is the primary sequence of SB transposase that binds to DR-core and DRi DNA. Therefore, we studied the DNA-binding properties of an isolated PAI subdomain (residues 1–57) of the SB DBD.
NMR solution structure of PAI subdomain
Based on the amino acid sequence similarity to Pax proteins and Tc3 transposase, it was proposed that the PAI subdomain consists of three helices, two of which form the HTH motif.2,14 Although secondary structure predictions suggested that more than half of the PAI subdomain is alpha-helical [Fig. 2(C)], our NMR data on the full-length DBD show that it is mostly unstructured in solution. The far-UV CD spectrum of the PAI subdomain collected at the same experimental conditions (20 mM sodium acetate buffer, pH 5.2), also lacks the typical signatures of alpha-helical structure (two negative bands at 208 nm and 222 nm and a positive band at 193 nm) and shows a negative band near 200 nm and low ellipticity above 210 nm, indicating that the protein is predominantly unstructured [Fig. 4(A), dashed line] in agreement with our NMR data on the full-length SB DBD. We found that the folding of the PAI subdomain can be achieved by raising the NaCl concentrations (up to 600 mM) and increasing pH to 7.0. At these conditions, the CD spectrum of PAI subdomain reflects a mixture of disordered and alpha-helical conformations [Fig. 4(A), solid line]. Fitting the CD data with a linear combination of disordered and alpha-helical basis spectra indicated the presence of about 50% alpha-helical structure. Chemical shift changes following the folding of PAI subdomain are exemplified for some residues in Figure 4(B). The [15N,1H]-HSQC spectrum displays well-dispersed cross-peaks, which signifies the presence of a folded structure [Fig. 5(A)]. The backbone and side chain assignments for the PAI subdomain were derived from 2D and 3D 15N-HSQC TOCSY and 15N-HSQC NOESY experiments using a 15N-labeled PAI subdomain. A consensus CSI of Hα protons [Fig. 5(B)] indicates three alpha-helical regions (residues 12–22, 29–33, and 39–55) within the PAI subdomain that are consistent with secondary structure predictions [Fig. 2(C)].
Figure 4.
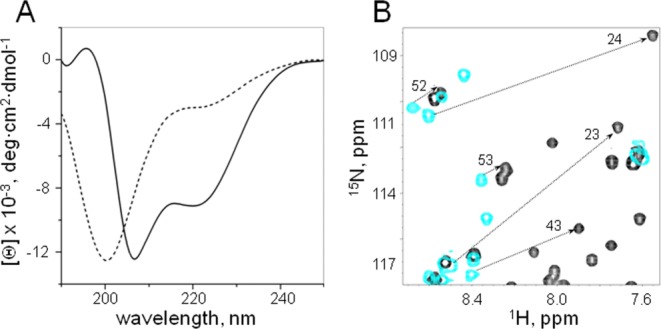
A: Far-UV CD spectra of the PAI subdomain of the DNA-binding domain of SB transposase. The spectra were collected at room temperature in 20 mM sodium acetate buffer at pH 5.2 (dashed line) and in the presence of 600 mM NaCl in 25 mM sodium phosphate buffer at pH 7.0 (solid line). CD spectra show that the PAI subdomain is folded at the latter conditions. B: Expansion of the [15N,1H]-HSQC spectra of unfolded (light blue) and folded (black) PAI subdomain exemplifies observed chemical shift changes. The spectra were collected at 5°C at the same buffer conditions as CD spectra shown in panel (A).
Figure 5.
A: Assigned [15N,1H]-HSQC spectrum of the PAI subdomain from the DNA-binding domain of SB transposase. The spectrum was recorded at 5°C in 25 mM sodium phosphate buffer at pH 7.0. B: The chemical shift index (CSI)26 obtained using Hα chemical shifts of PAI subdomain. Stretches of random coil (0) and helices (−1) are shown below the graph.
It was proposed that the PAI subdomain participates in protein–protein interactions when a protein–DNA complex is formed.14 However, during size-exclusion chromatography under the experimental conditions used in our experiments, the PAI subdomain elutes significantly later than the 13.8 kDa RNase A, as can be expected for a 7.5 kDa monomer. The structure of the PAI subdomain monomer was calculated as described in “Materials and Methods” and the structural statistics are provided in Table I. Cα traces for alpha-helix-aligned structures of the representative ensemble are shown superimposed in Figure 6(left panel) and a ribbon representation of a representative structure is shown in Figure 6(right panel). Coordinates for the 15 lowest energy structures were deposited in the Protein Data Bank (PDB) under accession code 2m8e; BMRB ID for this entry is 19249. The PAI subdomain folds into a compact, three-helix domain. Helices 2 and 3 are connected by the loop of four residues and form a HTH motif.
Table I.
Structural Statistics and Restraint Information for the NMR Structure of the PAI Subdomain
| Restraints and statistics | |
|---|---|
| Restraints | |
| NOE distance restraints (total) | 418 |
| Average number of NOE restraints per residue | 7.4 |
| Medium and long-range NOEs (j − i >3) | 130 |
| Hydrogen bonds | 26 |
| Residual dipolar couplings (Hz) | 28 |
| TALOS derived dihedral angle restraints | 51 |
| Violations | |
| NOE distance violations >0.5 Å | 0 |
| Dihedral angle violations >5° | 0 |
| RMS deviation from mean structure (Å) | |
| All heavy atoms | 1.4 |
| Backbone atoms | 0.7 |
| Ramachandran statisticsa (%) | |
| Most favored region | 96.7 |
| Additionally allowed region | 2.8 |
| Generously allowed region | 0.5 |
| Disallowed region | 0 |
Values were calculated for the ordered residues of the protein.
Figure 6.
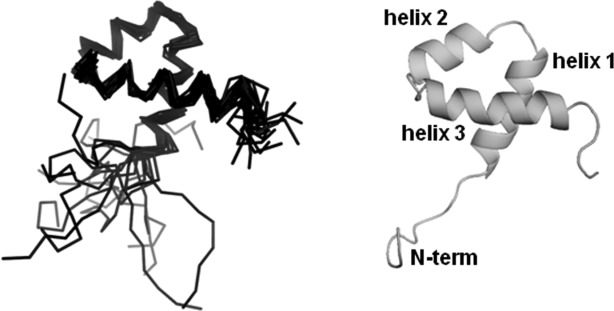
NMR solution structure of the PAI subdomain. Cα traces of superimposed 15 lowest energy structures (left) and the cartoon representation of the representative structure of the PAI subdomain (right) are shown.
Interactions of PAI subdomain with DNA
We initially used an electrophoretic mobility shift assay (EMSA) to verify that the expressed protein binds to DNA. Figure 7(A) shows the EMSA analysis of PAI subdomain binding to the 18-bp core sequence (left) and 32-bp inner DRi (right). In both cases, the PAI subdomain was capable of binding the DNA producing a distinct gel shift. Two bands, corresponding to the DR-core or DRi free (bottom) or bound to the PAI subdomain (top), were observed. No distinct bands corresponding to higher order complexes were detected at the protein:DNA ratios studied.
Figure 7.
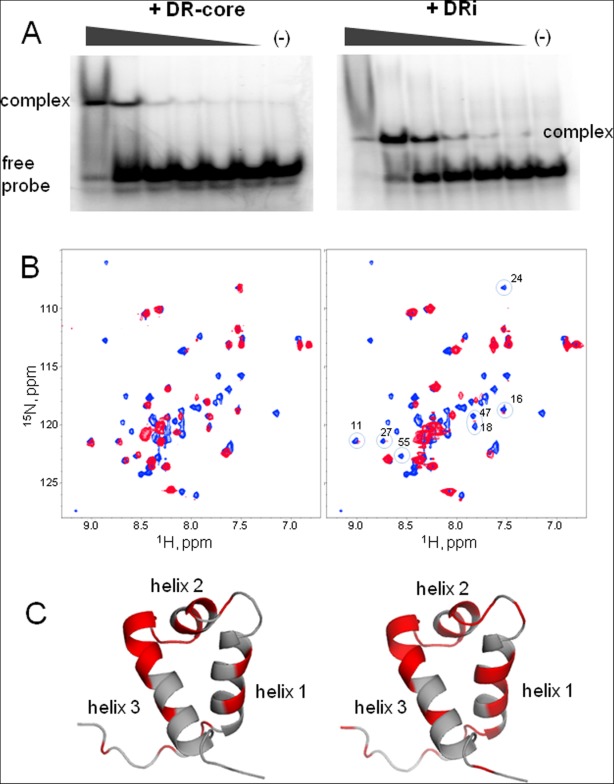
Binding of the PAI subdomain of the DNA-binding domain of SB transposase to DR-core (left panel) and DRi (right panel) DNA sequences. A: EMSA shows that the PAI subdomain binds to the DR-core and DRi DNA. Protein–DNA complexes were formed in 20 mM HEPES buffer at pH 7.5 in the presence of 0.1 mg/mL BSA, 1 µg [di:dC], 1 mM DTT, 150 mM NaCl, and 1 mM MgCl2. Probe quantity was fixed at 0.21 pM and the quantities of PAI subdomain varied from 0 to 2.24 nM as indicated by triangles above gels. B: [15N,1H]-HSQC spectra of pure PAI subdomain (blue) and of the PAI subdomain in the presence of a twofold molar excess of DR-core and DRi DNA sequences. The spectra were collected at 5°C in aqueous (5% D2O/95% H2O) 25 mM sodium phosphate buffer at pH 7.0 in the presence of 300 mM NaCl. C: Cartoon structures of PAI subdomain show residues affected by the binding of DR-core (left) and DRi (right) DNA sequences in red.
The binding of the PAI subdomain to the DR-core and DRi DNA sequences was further investigated by recording the [15N,1H]-HSQC spectra at a 1:2 PAI:DNA molar ratio because these sequences preferentially bind the PAI subdomain in the full-length DBD of SB transposase. The initial set of experiments was carried out in the presence of 600 mM NaCl to maintain the PAI subdomain in folded form. However, only negligibly small changes in [15N,1H]-HSQC spectrum of PAI subdomain were observed that reflected essentially no binding (data not shown), which was likely due to the presence of the high salt concentration. Accordingly, binding experiments were conducted at the intermediate, 300 mM NaCl. Under this condition, spectral changes were indicative of binding of the PAI subdomain to the DR-core [Fig. 7(B), left panel] and DRi [Fig. 7(B), right panel]; significant line broadening and chemical shift changes were observed for a set of residues.
Three distinct processes, namely, the conformational rearrangement of PAI subdomain in the presence of DNA, exchange between DNA-bound and unbound states of the PAI subdomain, and the dimerization (or higher order oligomerization) of PAI-DNA complexes, could cause spectral line broadening if they follow intermediate exchange kinetics on an NMR timescale. Varying the temperature, pH, and solvent systems failed to improve spectrum quality significantly. Consequently, we could not determine the full NMR structure of the PAI-DNA complex. To gain structural insight in PAI-DNA binding, we labeled the residues that demonstrated severely broadened NMR signals (absent from [15N,1H]-HSQC spectrum) on the structure of PAI subdomain [highlighted in red in Fig. 7(C), left panel]. The majority of these residues (28, 29, 31, 33–36, 38–43, 47) are located on the second and third alpha helices and on the loop connecting these two helices of the HTH motif. Accordingly, we predict that these residues form the DNA-binding site of PAI subdomain. Figure 8 shows that this prediction is consistent with the expected location of the DNA-binding site based on the comparison with available structures of the DNA-bound form of the two closest family members, Tc3 and Mos1 transposases,30–32 and with the paired box transcription factors, with which the SB PAI subdomain has amino acid sequence similarity. The structure of Pax5 transcription factor33 has the highest amino acid sequence similarity to the SB PAI subdomain, as reflected in the similarity of their structures.
Figure 8.
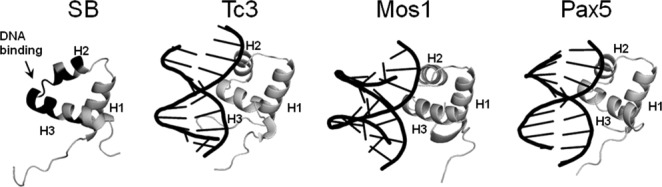
Structures of the PAI subdomain of SB transposase and the DNA-bound N-terminal specific DNA-binding subdomains of Tc3 transposase (PDB codes 1tc3 and 1u78, Refs.30 and31), Mos1 transposase (PDB code 3hos, Ref.32), and Pax5 transcription factor (PDB code 1k78, Ref.33). Protein structures were superimposed and then merely shifted along x (horizontal) axis. Residues on the second and third alpha-helices of SB PAI subdomain affected by DNA-binding are shown in black. Truncated DNA sequences from the PDB structures are shown in black to highlight the DNA-binding site of Mos1, Tc3, and Pax5 proteins.
Other residues affected by DNA-binding are located on the first helix. Interestingly, NMR signals of these residues broaden similarly upon either the addition of DNA or at decreasing the NaCl concentration, which suggests similar conformational folding/unfolding of the PAI subdomain in both cases. Indeed, the binding experiments were done at intermediate NaCl concentrations at which only part of the PAI subdomain molecules may adopt the fully structured conformation. Several N-terminal residues (3, 7, 9, and 10) demonstrate severely broadened signals. These residues are located on the unstructured and highly flexible N-terminus of the PAI subdomain and may be affected by binding to DNA. Additionally, the dimerization/oligomerization of the PAI-DNA complexes could be expected because the chemical steps of SB transposition occur within a stable protein–DNA complex. The minimal PAI-DNA complex would be the dimer of protein with the two DNA molecules bound, corresponding to a 37 kDa complex for a 18-bp DR-core sequence or 50 kDa complex for a 32-bp DRi or DRo sequences. The formation of stable protein-DNA complexes of this size would lead to the broadening of all peaks in the HSQC spectra, which is not the case. However, the contribution of the transient protein–protein interactions to the broadening of signals originated from the first alpha helix in addition to the folding/unfolding of PAI subdomain remains a possibility based on comparison with Mos1 and Tc3 transposases.30–32
We note that the spectra of the PAI subdomain bound to either the 32-bp DRi or the 18-bp DR-core sequences are highly similar. Thus, the DR-core is the primary binding site of PAI-subdomain. Additional residues demonstrated broadened signals due to the binding of DRi are circled on [15N,1H]-HSQC spectrum of PAI subdomain [Fig. 7(B), right panel] and indicated on the PAI structure in red [Fig. 7(C), right panel]. Some of these residues are clustered on the HTH motif; however, residues 11, 16, and 18 are located on helix-1. Although the binding to DRi causes greater changes on helix-1 than the binding to DR-core, only 1:1 complexes of PAI-DNA are formed as indicated by EMSA. Thus, these greater changes upon DRi binding are again related to the conformational exchange due to folding.
Discussion
The reaction of DNA transposition happens in the context of a synaptic protein-DNA complex in which both ends of the transposon are drawn together via transposase enzymes and then inserted into a target DNA site. A distinct feature of the SB transposon is that it has two evident, nearly identical, transposase-binding sites within each inverted terminal repeat.14,23 Here, we investigated the binding of the N-terminal transposon-binding domain of SB transposase to these DNA sequences. We used the N-terminal, transposon-binding domain of SB transposase because as far as we know, all attempts at obtaining soluble full-length transposase have been fruitless over the last decade. The N-terminal region displays characteristics that suggest it has all of the selectivity necessary for binding to its cognate transposon. In the absence of high-resolution structural information on the full-length SB transposase, our data provide the first experimentally determined structure of the specific DNA-binding subdomain of SB transposase, as well as the first insight in how SB transposase binds to its cognate DNA.
Our NMR data show that the DBD of the N-terminal domain of SB transposase binds to inner and outer binding sites differently. While residues in the whole DBD are affected (broadened and shifted resonances) by the binding to the outer binding site DRo, mainly resonances originating from the PAI subdomain of the SB DBD are affected by the binding to the inner site, DRi (Fig. 3). Furthermore, only resonances in the PAI subdomain are affected by the binding to the 18-bp DR-core present in both inner and outer DRs. This suggests that the specific DNA recognition subdomain of SB transposase, the PAI subdomain, binds to the DR-core sequence in the inner and outer DRs, whereas the RED subdomain of the DBD of SB transposase binds to the nucleotides flanking the DR-core on the outer, but not on the inner DR. This data may explain earlier findings that the transposase binding to a core DR sequence is required but not sufficient for transposition.23
We determined the NMR solution structure of PAI subdomain to gain structural insight into PAI-DNA binding. The bipartite structure of the DBD of SB transposase, containing two alpha-helical subdomains, was predicted more than a decade ago2; however, no direct supporting experimental evidence has been provided thus far. Using solution NMR spectroscopy, we validated that prediction and others14—the PAI subdomain does consist of three helices (residues 12–22, residues 29–33, and residues 39–55) that are tightly packed together. Helices 2 and 3 and form a HTH motif that is found in many DNA-binding proteins.17 However, NMR and CD spectroscopy data show that at physiologic salt concentrations, both the full-length DBD and the PAI subdomain of SB transposase remain poorly structured. The folding of the PAI subdomain occurs in the presence of high NaCl concentrations up to 600 mM. Approximately 30% of the PAI subdomain consists of charged residues, primarily lysines and arginines. Apparently, electrostatic repulsion destabilizes the structure of PAI subdomain whereas the addition of salt screens electrostatic interactions and facilitates its folding.
Despite low amino acid sequence homology, structurally, the PAI subdomain of SB transposase has features that are similar to other DBDs in the family of DD[E/D]-transposases.13 Structural alignment of the PAI subdomain with N-terminal specific DBDs of the two closest family members for which the three-dimensional structures are available, Tc1/mariner transposases Tc3 and Mos1, results in a root-mean-square deviation (RMSD) of 3.3 Å for Tc3 (PDB codes 1tc3 and 1u78, Refs.30 and31) and 3.8 Å for Mos1 (PDB code 3hos, Ref.32) for Cα atoms of alpha-helices (Supporting Information Fig. S1). There are important structural differences between the SB PAI subdomain and the N-terminal subdomains of the Tc3 and Mos1 transposases. These differences are in the lengths and relative orientations of the alpha helices (Fig. 8). In particular, the orientation of helix-2 is different in PAI subdomain. In part, the differences may result from the fact that the structures of Tc3 and Mos1 transposases were analyzed in the DNA-bound form; thus, the conformational rearrangement of the PAI subdomain could be expected upon binding to DNA.
The PAI subdomain of SB transposase also has amino acid sequence homology to the N-terminal, PAI subdomain of the paired box family of transcription factors.34 In particular, we observed a high degree of similarity with the Pax5 protein.33 Superposition of the PAI subdomain of SB transposase on the corresponding Pax5 subdomain (PDB code 1k78, Ref. 33) shows that the overall three-dimensional fold is also highly similar (Fig. 8). The backbone RMSD between the SB and Pax-5 PAI subdomains is 2.4 Å, which is lower than for the Tc3 and Mos1 transposases (Supporting Information Fig. S1). Accordingly, the structural differences observed between SB, Tc3, and Mos1 transposases result from the significant variability of their amino acid sequences and cannot be fully explained by the rearrangement due to their binding to DNA. In this regard, given the limited number and wide variation of available three-dimensional structures, further structural studies of different DD[E/D]-transposases are necessary.13
NMR solution structure allowed us to identify the residues on the PAI subdomain involved in the binding to DNA. These residues are located on the second and third alpha helices forming HTH motif. Thus, the HTH motif of SB PAI subdomain mediates binding to the transposon DNA, consistent with its implication in DNA binding.16 Further experimental studies of the structure and dynamics on the full-length SB transposase and its domains and its binding to DNA are needed to link the hyperactivity of SB transposase to its structural and dynamic features and to guide the engineering of SB variants with improved transposition activity. These studies are underway.
Material and Methods
Expression and purification of the PAI subdomain of SB transposase
DNA plasmid encoding the His-tagged PAI subdomain of SB transposase was ordered from GenScript USA (Piscataway, NJ). The DNA encoding the full-length DBD of SB transposase was cloned into pET 21a(+) vector at the NheI and XhoI restriction sites. The sequence of the original SB10 transposase was used.2 Plasmids encoding full-length DBD or PAI subdomain of SB transposase were transformed into competent BL21-A1 Escherichia coli cells. Cells were grown in LB or M9 minimal media with ampicillin at 30°C to an OD600 of 0.4–0.6, and then induced by adding 0.1M IPTG and 0.2% l-arabinose for 4 h. The cells were collected by centrifugation and lysed using B-Per lysis buffer. Soluble extract containing DBD or PAI subdomain of SB transposase was prepared by centrifugation of cell lysate at 14,000g for 1 h. The protein was purified using a TALON Ni Affinity Resin (ClonTech, Mountain View, CA). After elution from Ni-affinity column, the proteins were immediately dialyzed against aqueous 20 mM sodium acetate buffer at pH 5.2 or 25 mM sodium phosphate buffer at pH 7.0. The choice of buffer was based on relevant pKa values, hence the recommended buffering ranges. The presence and purity of proteins were monitored using 15% (w/v) polyacrylamide gel electrophoresis, mass spectroscopy, and spectrophotometry. The sequence was verified by N-terminal Edman sequencing.
CD spectroscopy
The CD spectra were recorded on a Jasco-715 spectropolarimeter, equipped with a Peltier temperature control unit, at room temperature in the range of 190–250 nm using a quartz glass cell with a path length of 1 mm. The corresponding buffer baseline was subtracted from each spectrum. Spectra were recorded using a 50 nm/min scanning speed with a 2 s detector response and 1 nm bandwidth. Reported spectra are averages of 4–6 scans. The measured ellipticity θ was converted to the mean residue molar ellipticity [θ] = θ M/(10lcn), where M is the molecular weight of protein, c is the protein concentration in mg/mL, n is the number of residues, and l is the path length. CD spectra were fit with a linear combination of standard secondary spectra to estimate secondary structure contributions.35
NMR spectroscopy and structure calculations
All NMR experiments were performed at 293 K on a Bruker Avance-III 950 MHz spectrometer equipped with CryoProbe™. [15N,13C]-labeled full-length DBD or 15N-labeled PAI subdomain protein samples concentrated to 0.5–1.0 mM were used. Sequence-specific resonance assignments have been performed using 3D HNCA, HNCACB, CBCA(CO)NH, 15N-HSQC TOCSY, and 15N-HSQC NOESY experiments.36 Inter-proton distance restraints were derived from NOE signals in 15N-NOESY HSQC experiments, collected at 80 and 150 ms mixing times, and in 2D NOESY experiment, collected at 150 ms mixing time in 100% D2O. Hydrogen bond restraints were identified from the pattern of sequential and inter-helical NOEs involving NH and CαH protons and with evidence of slow amide proton-solvent exchange, monitored with a series of [1H15N]-HSQC spectra recorded in 100% D2O. Residual dipolar coupling values were measured using the 2D IPAP (in-phase/anti-phase) [15N, 1H]-HSQC experiment.37 Changes in splitting relative to the isotropic JNH values were obtained at 5°C and 400 mM NaCl for partially aligned PAI subdomain using Pf1 phage (ASLA Biotech, Riga, Latvia) at the concentration of 6 mg/mL.38 All NMR spectra were processed with NMRPipe39 and analyzed with CARA40 and NMRView.41
NMR structures were calculated using the program XPLOR-NIH43 on the basis of NOE and hydrogen bond distance restraints determined experimentally and dihedral angle restraints generated using the program TALOS43 and chemical shift data. The 15 minimum energy structures were selected from a set of 100 calculated structures as a representative ensemble based on the absence of NOE violations greater than 0.5 Å and dihedral angle violations greater than 5°. The stereochemical quality of the representative ensemble of PAI subdomain structures was assessed using the PROCHECK program.44 Experimental restraints and structural statistics are summarized in Table I. Molecules were visualized and aligned using the program PyMOL.45
Electrophoretic mobility shift experiments
Electrophoretic mobility shift experiments (EMSA assays) were performed using the DR-core and DRi DNA probes generated by end labeling of oligonucleotides with [γ-32P] ATP using T4 polynucleotide kinase (Invitrogen), followed by boiling for 5 min and slow cooling at room temperature of equimolar amounts of complimentary oligos. Nucleoprotein complexes were formed in 20 mM HEPES buffer at pH 7.5 in the presence of 0.1 mg/mL BSA, 1 µg poly[di:dC], 1 mM DTT, 150 mM NaCl, and 1 mM MgCl2. Probe quantity was fixed at 0.21 pM and the quantities of PAI subdomain varied from 0 to 2.24 nM. After incubating the reaction samples for 15 min on ice, 5 µL of loading dye containing 50% (v/v) glycerol was added and the samples were run on a 6% TBE polyacrylamide gel. Gels were dried and visualized by 32P-imaging.
Acknowledgments
The authors thank Dr. Gloria D. Elliot for the access to CD spectrometer and Matthew Van Vorst for technical assistance with CD measurements. NMR experiments were carried out at David H. Murdock research Institute (DHMRI; Kannapolis, NC). The authors also thank Dr. Kevin Knagge at the NMR facility of DHMRI for technical assistance. We acknowledge a possible conflict of interest for PBH who has equity in Discovery Genomics, Inc., a small biotech that receives funding from the NIH to explore the use of the Sleeping Beauty Transposon System for gene therapy.
Supplementary material
Additional Supporting Information may be found in the online version of this article.
References
- 1.VandenDriessche T, Ivics Z, Izsvak Z, Chuah MK. Emerging potential of transposons for gene therapy and generation of induced pluripotent stem cells. Blood. 2009;114:1461–1468. doi: 10.1182/blood-2009-04-210427. [DOI] [PubMed] [Google Scholar]
- 2.Ivics Z, Hackett PB, Plasterk RH, Izsvak Z. Molecular reconstruction of Sleeping Beauty, a Tc1-like transposon from fish, and its transposition in human cells. Cell. 1997;91:501–510. doi: 10.1016/s0092-8674(00)80436-5. [DOI] [PubMed] [Google Scholar]
- 3.Hackett PB, Largaespada DA, Cooper LJ. A transposon and transposase system for human application. Mol Ther. 2010;18:674–683. doi: 10.1038/mt.2010.2. [DOI] [PMC free article] [PubMed] [Google Scholar]
- 4.Hackett PB, Largaespada DA, Switzer KC, Cooper LJ. Evaluating risks of insertional mutagenesis by DNA transposons in gene therapy. Transl Res. 2013;161:265–283. doi: 10.1016/j.trsl.2012.12.005. [DOI] [PMC free article] [PubMed] [Google Scholar]
- 5.Mates L, Chuah MK, Belay E, Jerchow B, Manoj N, Acosta-Sanchez A, Grzela DP, Schmitt A, Becker K, Matrai J, Ma L, Samara-Kuko E, Gysemans C, Pryputniewicz D, Miskey C, Fletcher B, Vandendriessche T, Ivics Z, Izsvak Z. Molecular evolution of a novel hyperactive Sleeping Beauty transposase enables robust stable gene transfer in vertebrates. Nat Genet. 2009;41:753–761. doi: 10.1038/ng.343. [DOI] [PubMed] [Google Scholar]
- 6.Grabundzija, Irgang M, Mates L, Belay E, Matrai J, Gogol-Doring A, Kawakami K, Chen W, Ruiz P, Chuah MK, VandenDriessche T, Izsvak Z, Ivics Z. Comparative analysis of transposable element vector systems in human cells. Mol Ther. 2010;18:1200–1209. doi: 10.1038/mt.2010.47. [DOI] [PMC free article] [PubMed] [Google Scholar]
- 7.Berry C, Hannenhalli S, Leipzig J, Bushman FD. Selection of target sites for mobile DNA integration in the human genome. PLoS Comput Biol. 2006;2:1450–1462. doi: 10.1371/journal.pcbi.0020157. [DOI] [PMC free article] [PubMed] [Google Scholar]
- 8.Yant SR, Wu X, Huang Y, Garrison B, Burgess SM, Kay MA. High-resolution genome-wide mapping of transposon integration in mammals. Mol Cell Biol. 2005;25:2085–2094. doi: 10.1128/MCB.25.6.2085-2094.2005. [DOI] [PMC free article] [PubMed] [Google Scholar]
- 9.Plasterk RH, Izsvak Z, Ivics Z. Resident aliens: the Tc1/mariner superfamily of transposable elements. Trends Genet. 1999;15:326–332. doi: 10.1016/s0168-9525(99)01777-1. [DOI] [PubMed] [Google Scholar]
- 10.Rice PA, Baker TA. Comparative architecture of transposase and integrase complexes. Nat Struct Biol. 2001;8:302–307. doi: 10.1038/86166. [DOI] [PubMed] [Google Scholar]
- 11.Hickman AB, Chandler M, Dyda F. Integrating prokaryotes and eukaryotes: DNA transposases in light of structure. Crit Rev Biochem Mol Biol. 2010;45:50–69. doi: 10.3109/10409230903505596. [DOI] [PMC free article] [PubMed] [Google Scholar]
- 12.Nowotny M. Retroviral integrase superfamily: the structural perspective. EMBO Rep. 2009;10:144–151. doi: 10.1038/embor.2008.256. [DOI] [PMC free article] [PubMed] [Google Scholar]
- 13.Nesmelova, Hackett PB. DDE transposases: structural similarity and diversity. Adv Drug Delivery Rev. 2010;62:1187–1195. doi: 10.1016/j.addr.2010.06.006. [DOI] [PMC free article] [PubMed] [Google Scholar]
- 14.Izsvak Z, Khare D, Behlke J, Heinemann U, Plasterk RH, Ivics Z. Involvement of a bifunctional, paired-like DNA-binding domain and a transpositional enhancer in Sleeping Beauty transposition. J Biol Chem. 2002;277:34581–34588. doi: 10.1074/jbc.M204001200. [DOI] [PubMed] [Google Scholar]
- 15.Aravind L, Anantharaman V, Balaji S, Babu MM, Iyer LM. The many faces of the helix-turn-helix domain: transcription regulation and beyond. FEMS Microbiol Rev. 2005;29:231–262. doi: 10.1016/j.femsre.2004.12.008. [DOI] [PubMed] [Google Scholar]
- 16.Brennan RG, Matthews BW. The helix-turn-helix DNA binding motif. J Biol Chem. 1989;264:1903–1906. [PubMed] [Google Scholar]
- 17.Pabo CO, Sauer RT. Transcription factors: structural families and principles of DNA recognition. Annu Rev Biochem. 1992;61:1053–1095. doi: 10.1146/annurev.bi.61.070192.005201. [DOI] [PubMed] [Google Scholar]
- 18.Geurts AM, Yang Y, Clark KJ, Liu G, Cui Z, Dupuy AJ, Bell JB, Largaespada DA, Hackett PB. Gene transfer into genomes of human cells by the Sleeping Beauty transposon system. Mol Ther. 2003;8:108–117. doi: 10.1016/s1525-0016(03)00099-6. [DOI] [PubMed] [Google Scholar]
- 19.Yant SR, Park J, Huang Y, Mikkelsen JG, Kay MA. Mutational analysis of the N-terminal DNA-binding domain of Sleeping Beauty transposase: critical residues for DNA binding and hyperactivity in mammalian cells. Mol Cell Biol. 2004;24:9239–9247. doi: 10.1128/MCB.24.20.9239-9247.2004. [DOI] [PMC free article] [PubMed] [Google Scholar]
- 20.Zayed H, Izsvak Z, Walisko O, Ivics Z. Development of hyperactive Sleeping Beauty transposon vectors by mutational analysis. Mol Ther. 2004;9:292–304. doi: 10.1016/j.ymthe.2003.11.024. [DOI] [PubMed] [Google Scholar]
- 21.Baus J, Liu L, Heggestad AD, Sanz S, Fletcher BS. Hyperactive transposase mutants of the Sleeping Beauty transposon. Mol Ther. 2005;12:1148–1156. doi: 10.1016/j.ymthe.2005.06.484. [DOI] [PubMed] [Google Scholar]
- 22.Liu G, Aronovich EL, Cui Z, Whitley CB, Hackett PB. Excision of Sleeping Beauty transposons: parameters and applications to gene therapy. J Gene Med. 2004;6:574–583. doi: 10.1002/jgm.486. [DOI] [PMC free article] [PubMed] [Google Scholar]
- 23.Cui Z, Geurts AM, Liu G, Kaufman CD, Hackett PB. Structure-function analysis of the inverted terminal repeats of the Sleeping Beauty transposon. J Mol Biol. 2002;318:1221–1235. doi: 10.1016/s0022-2836(02)00237-1. [DOI] [PubMed] [Google Scholar]
- 24.Schwarzinger S, Kroon GJ, Foss TR, Chung J, Wright PE, Dyson HJ. Sequence-dependent correction of random coil NMR chemical shifts. J Am Chem Soc. 2001;123:2970–2978. doi: 10.1021/ja003760i. [DOI] [PubMed] [Google Scholar]
- 25.Wishart DS, Sykes BD. Chemical shifts as a tool for structure determination. Methods Enzymol. 1994;239:363–392. doi: 10.1016/s0076-6879(94)39014-2. [DOI] [PubMed] [Google Scholar]
- 26.Wishart DS, Sykes BD, Richards FM. The chemical shift index: a fast and simple method for the assignment of protein secondary structure through NMR spectroscopy. Biochemistry. 1992;31:1647–1651. doi: 10.1021/bi00121a010. [DOI] [PubMed] [Google Scholar]
- 27.Kneller DG, Cohen FE, Langridge R. Improvements in protein secondary structure prediction by an enhanced neural network. J Mol Biol. 1990;214:171–182. doi: 10.1016/0022-2836(90)90154-E. [DOI] [PubMed] [Google Scholar]
- 28.Marsh JA, Singh VK, Jia Z, Forman-Kay JD. Sensitivity of secondary structure propensities to sequence differences between alpha- and gamma-synuclein: implications for fibrillation. Protein Sci. 2006;15:2795–2804. doi: 10.1110/ps.062465306. [DOI] [PMC free article] [PubMed] [Google Scholar]
- 29.Zuiderweg ER. Mapping protein-protein interactions in solution by NMR spectroscopy. Biochemistry. 2002;41:1–7. doi: 10.1021/bi011870b. [DOI] [PubMed] [Google Scholar]
- 30.van Pouderoyen G, Ketting RF, Perrakis A, Plasterk RH, Sixma TK. Crystal structure of the specific DNA-binding domain of Tc3 transposase of C. elegans in complex with transposon DNA. EMBO J. 1997;16:6044–6054. doi: 10.1093/emboj/16.19.6044. [DOI] [PMC free article] [PubMed] [Google Scholar]
- 31.Watkins S, van Pouderoyen G, Sixma TK. Structural analysis of the bipartite DNA-binding domain of Tc3 transposase bound to transposon DNA. Nucleic Acids Res. 2004;32:4306–4312. doi: 10.1093/nar/gkh770. [DOI] [PMC free article] [PubMed] [Google Scholar]
- 32.Richardson JM, Colloms SD, Finnegan DJ, Walkinshaw MD. Molecular architecture of the Mos1 paired-end complex: the structural basis of DNA transposition in a eukaryote. Cell. 2009;138:1096–1108. doi: 10.1016/j.cell.2009.07.012. [DOI] [PMC free article] [PubMed] [Google Scholar]
- 33.Garvie CW, Hagman J, Wolberger C. Structural studies of Ets-1/Pax5 complex formation on DNA. Mol Cell. 2001;8:1267–1276. doi: 10.1016/s1097-2765(01)00410-5. [DOI] [PubMed] [Google Scholar]
- 34.Czerny T, Schaffner G, Busslinger M. DNA sequence recognition by Pax proteins: bipartite structure of the paired domain and its binding site. Genes Dev. 1993;7:2048–2061. doi: 10.1101/gad.7.10.2048. [DOI] [PubMed] [Google Scholar]
- 35.Reed J, Reed TA. A set of constructed type spectra for the practical estimation of peptide secondary structure from circular dichroism. Anal Biochem. 1997;254:36–40. doi: 10.1006/abio.1997.2355. [DOI] [PubMed] [Google Scholar]
- 36.Muhandiram DR, Kay LE. Gradient-enhanced triple-resonance three-dimensional NMR experiments with improved sensitivity. J Magn Res B. 1994;103:203–216. [Google Scholar]
- 37.Ottiger M, Delaglio F, Bax A. Measurement of J and dipolar couplings from simplified two-dimensional NMR spectra. J Magn Reson. 1998;131:373–378. doi: 10.1006/jmre.1998.1361. [DOI] [PubMed] [Google Scholar]
- 38.Zweckstetter M, Bax A. Characterization of molecular alignment in aqueous suspensions of Pf1 bacteriophage. J Biomol NMR. 2001;20:365–377. doi: 10.1023/a:1011263920003. [DOI] [PubMed] [Google Scholar]
- 39.Delaglio F, Grzesiek S, Vuister GW, Zhu G, Pfeifer J, Bax A. NMRPipe: a multidimensional spectral processing system based on UNIX pipes. J Biomol NMR. 1995;6:277–293. doi: 10.1007/BF00197809. [DOI] [PubMed] [Google Scholar]
- 40.Keller RLJ. 2004. The computer aided resonance assignment tutorial, 1 ed., Cantina Verlag, Switzerland.
- 41.Johnson BA, Blevins RA. NMRView: a computer program for the visualization and analysis of NMR data. J Biomol NMR. 1994;4:603–614. doi: 10.1007/BF00404272. [DOI] [PubMed] [Google Scholar]
- 42.Schwieters CD, Kuszewski JJ, Tjandra N, Clore GM. The Xplor-NIH NMR molecular structure determination package. J Magn Reson. 2003;160:65–73. doi: 10.1016/s1090-7807(02)00014-9. [DOI] [PubMed] [Google Scholar]
- 43.Shen Y, Delaglio F, Cornilescu G, Bax A. TALOS+: a hybrid method for predicting protein backbone torsion angles from NMR chemical shifts. J Biomol NMR. 2009;44:213–223. doi: 10.1007/s10858-009-9333-z. [DOI] [PMC free article] [PubMed] [Google Scholar]
- 44.Laskowski RA, MacArthur MW, Moss DS, Thornton JM. PROCHECK: a program to check the stereochemical quality of protein structures. J Appl Crystallogr. 1993;26:283–291. [Google Scholar]
- 45.O'Reilly MS, Boehm T, Shing Y, Fukai N, Vasios G, Lane WS, Flynn E, Birkhead JR, Olsen BR, Folkman J. Endostatin: an endogenous inhibitor of angiogenesis and tumor growth. Cell. 1997;88:277–285. doi: 10.1016/s0092-8674(00)81848-6. [DOI] [PubMed] [Google Scholar]
Associated Data
This section collects any data citations, data availability statements, or supplementary materials included in this article.