Abstract
A key issue in macromolecular structure modeling is the granularity of the molecular representation. A fine-grained representation can approximate the actual structure more accurately, but may require many more degrees of freedom than a coarse-grained representation and hence make conformational search more challenging. We investigate this tradeoff between the accuracy and the size of protein conformational search space for two frequently used representations: one with fixed bond angles and lengths and one that has full flexibility. We performed large-scale explorations of the energy landscapes of 82 protein domains under each model, and find that the introduction of bond angle flexibility significantly increases the average energy gap between native and non-native structures. We also find that incorporating bonded geometry flexibility improves low resolution X-ray crystallographic refinement. These results suggest that backbone bond angle relaxation makes an important contribution to native structure energetics, that current energy functions are sufficiently accurate to capture the energetic gain associated with subtle deformations from chain ideality, and more speculatively, that backbone geometry distortions occur late in protein folding to optimize packing in the native state.
Keywords: protein structure prediction, energy landscape, optimization, flexible covalent bonds, sampling
Introduction
Macromolecular structure prediction and design efforts are challenged by the vast size of the conformational space available to macromolecules. For example, even a small 100 amino acid protein has thousands of degrees of freedom (DOFs). Although some approaches model this full parameter space explicitly,1,2 most structure prediction and design efforts attempt to reduce the complexity of the problem by reducing the dimensionality.3–5 For example, Rosetta6 typically uses an internal coordinate system with fixed bond angles and lengths, and idealized aromatic ring structures. Only torsion angles are allowed to vary, reducing the dimensionality of the above 100-residue protein example from thousands to hundreds. This reduces the size of the search space and makes gradient based minimization more efficient.7
One potential problem with any reduced dimensionality description is that the accuracy of the representation may be compromised, resulting in inaccurate energy evaluations. The reduced representation may restrict the molecule from accessing low energy states that require relaxation of the constrained variables. Similar problems arise from the common simplification that electron distributions around atoms can be approximated by fixed-point charges centered on the nuclei. The resulting inaccuracies in the electrostatic energy are the subject of current work on polarizable force fields with off-atom charges.8,9
Determining whether a more detailed, higher dimensionality description warrants the increase in the difficulty of conformational search for the lowest energy state is a challenging problem in itself. In this study, we describe a general approach to comparing different dimensionality protein representations, and use it to investigate the tradeoff between the changes in conformational space size and model accuracy associated with ideal versus flexible bond length and angle representations.
Results
Protein structure prediction is a global optimization problem involving a search for the lowest energy structure. Comparing the effectiveness of alternative polypeptide chain representations is not trivial: introduction of additional DOFs will almost always result in lower energy models both close to the native structure and far from the native structure, and the effects of this on conformational search can be quite complex. The most straightforward approach—carrying out ab-initio structure prediction calculations using different representations and evaluating the success in prediction—is challenging, as it is difficult to converge global searches over the vast protein conformational space.
We have taken an approach to tackling the representation granularity problem that reduces the stochastic variation inherent in Monte Carlo global optimization. Large sets of models are generated which span the conformational space, and the lowest energy structures in each RMSD interval are collected. These states collectively represent the low-lying minima in the energy landscape. Changes in model representation and optimization method are then evaluated by relaxing each model in the set and evaluating the energy gap between models inside and outside of the native energy minimum: representations leading to larger energy gaps (normalized based on the spread in energies among the models) are considered better than those with smaller gaps.
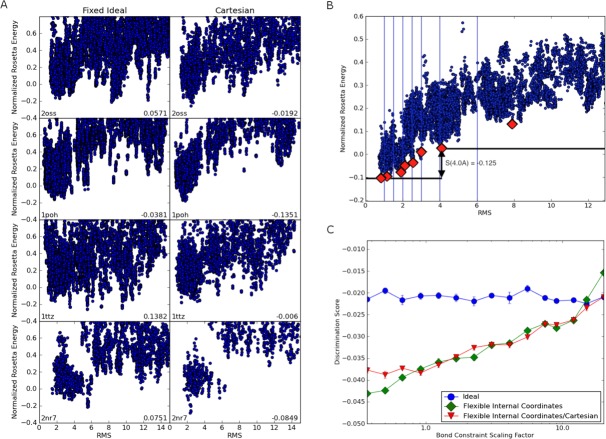
We used this approach to compare fixed and flexible bond angle representations, and optimization in internal coordinates versus Cartesian coordinates (described in Methods and shown in Fig. 1). Large numbers of conformations for 82 different proteins were optimized in the different representations for a range of weights on the bonded geometry term. The results are summarized in Figure 2. Figure 2(A) shows some of the energy landscapes for which there was a marked difference between representations. It is evident that the energy gap between close-to-native conformations and far-from-native conformations is larger in the flexible bond angle representation [Fig. 2(A), right] than in the fixed representation [Fig. 2(A), left]; indeed for protein 2nr7 (bottom row), there is no energy gap in the fixed representation but a clear gap in the flexible representation.
Figure 1.
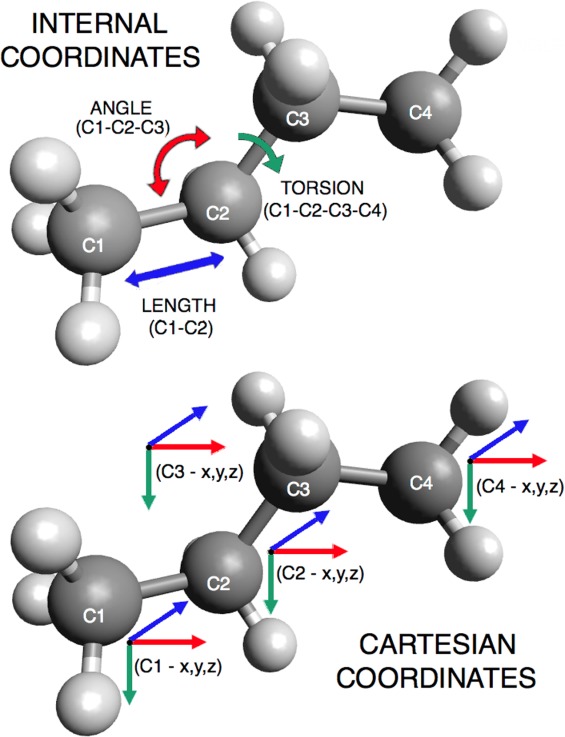
Internal coordinate vs. Cartesian coordinate representation. Internal coordinates describe a protein structure in terms of angles, lengths, and torsions; Cartesian coordinates describe a protein's conformation using the (x, y, z) position of each atom.
Figure 2.
Backbone flexibility increases the native energy gap. (A) Examples of energy landscapes for individual proteins resulting from fixed bond length and angle relaxation (left) and from bond angle relaxation (right). The y-axis is the Rosetta energy normalized by rescaling the energies such that the 95th percentile and fifth percentile fall on 1 and 0, respectively. The x-axis is the RMSD to the native structure. The discrimination measure is provided at the bottom right of each panel; the better the energy funnel, the more negative the value. For these four proteins, the energy gap between the native structure and far from native structures increases with flexible bond relaxation. (B) Illustration of the discrimination calculation. The discrimination measure is the average of energy gaps sampled at seven points on the landscape. The energy gap for each division is computed by finding the difference between the lowest energy structure to the left of the division and the lowest energy structure to the right. The red diamonds represent the lowest energy structure in each bin. In this case, the lowest energy structure to the left of each division will always be the far-left structure. (C) Backbone flexibility increases the native energy gap across the 82 protein benchmark set. For each value of the bond constraint scaling factor on the x-axis, 900 conformations for each of the 82 proteins were relaxed five times. The discrimination measure was computed from the resulting 4500 structures as outlined in panel B, and the values for the 82 proteins were averaged. More negative values indicate larger native energy gaps. At values of the scaling factor less than 0.37 (the lowest value shown on the x-axis) the bonded geometry begins to deviate from that observed in native crystal structures (data not shown). The ideal geometry calculations are not influenced by the scaling factor; the small amount of variation at different values of the scaling factor indicates the amount of noise in the averages. The results for all three protocols converge at high values of the scaling factors as expected since the backbone geometry is near ideal even for the flexible protocols.
It is not feasible to inspect energy landscapes for 82 proteins for many different parameter values; instead, to quantify the magnitude of the energy gap, we developed a discrimination measure described in the methods section and outlined in Figure 2(B). We computed the average energy gap over all 82 proteins for fixed internal geometry, flexible internal geometry, and Cartesian geometry. Figure 2(C) summarizes the dependence of the energy gap on the weight on the bond geometry potential. Consistent with the selected example landscapes in Figure 2(A), flexible protocols performed significantly better (more negative discrimination scores indicate larger energy gaps) over the full set compared with the fixed protocol. As expected, all three methods yield similar energy gaps at high covalent restraint weights, where the two flexible models converge on the ideal geometry case. No difference in energy gap is seen between the flexible protocol variants. The slight drop in discrimination measure at very low covalent restraint weights is likely an artifact of optimization under these unphysical conditions.
We hypothesized that flexibility in certain bonds may be more important to the energy gap than others. For example, flexibility in backbone geometry may play a much larger role in sharpening the energy landscape than flexibility at the tip of a side chain. To identify, which DOFs were responsible for the improved discrimination, we repeated the discrimination experiments with different subsets of the bond angles and lengths free to vary in internal coordinate space; the results are summarized in Figure 3. We found that most – but not all – of the increase in energy gap is obtained by allowing only the backbone angles to deviate from the ideal values. Allowing only sidechain angles or only τ (N-C -C) angles to vary had less effect. Allowing variation in bond lengths alone [Fig. 3(B)] had little effect on energy gap overall, but increased the discrimination score as the constraints increased. Allowing both angles and lengths to vary performed worse than keeping bond lengths fixed [Fig. 3(A)]. The poorer discrimination with increased constraint weight for the flexible bond length protocols in Fig 3(B) is likely due to the high bond length spring constants causing the quasi Newton optimization algorithm to take shorter steps and increasing the convergence time.10
Figure 3.
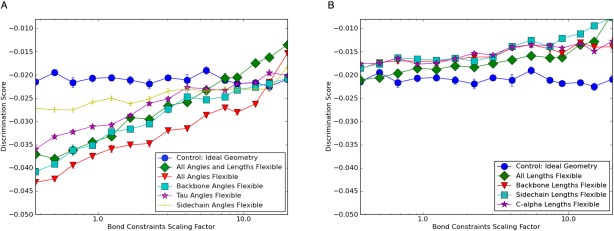
Backbone angle flexibility is the dominant contributor to the increased native energy gap conferred by bonded geometry optimization. (A) The benchmark set calculations described in Figure 1(C) were repeated allowing different subsets of angles to relax during internal coordinate minimization. Keeping bond lengths fixed but allowing all angles to vary led to better discrimination than varying all bond lengths and angles. Most of this improvement resulted from varying all the backbone angles; minimization of sidechain angles or the tau angle (N-C -C') had a smaller effect. (B) Varying bond lengths show no effect on discrimination except for a slight decrease in performance at higher weights likely caused by increased convergence time due to shorter steps during quasi Newton optimization.
As described above, because of the computational cost associated with optimizing large numbers of structures, the above comparisons of representations involved relaxation of large numbers of already generated models. For this purpose we used Rosetta FastRelax, an efficient local optimization procedure.6 However, it is formally possible that new minima exist when the additional DOFs are added, but local optimization fails to identify them. Therefore, we performed more extensive global optimization on a subset of targets to see if new local minima emerged due to the additional model flexibility. For 10 of the targets from the original test set, we used the large-scale parallel loop hash (PLS) sampling procedure11 starting from 200 input structures per target. Either standard ideal geometry FastRelax or FastRelax using flexible bond geometry was used for local optimization in the PLS protocol. As shown in Figure 4, allowing relaxation of backbone-bonded geometry again increased the energy gap between native and non-native structures. Hence, it is unlikely that relaxing bonded geometry creates new minima with energies comparable to the native structure.
Figure 4.
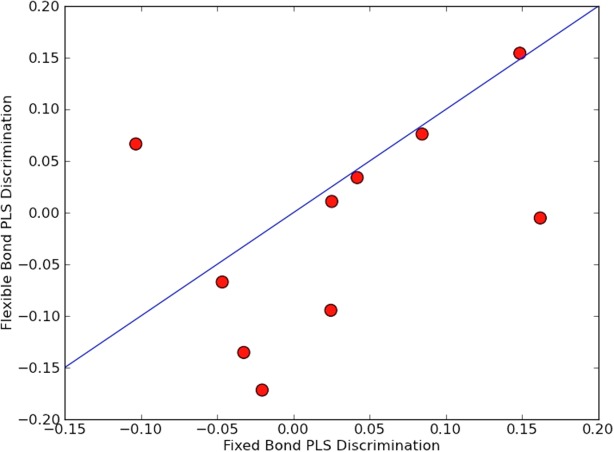
The increase in energy gap with flexible bond optimization is observed even with extensive sampling. Large-scale parallel loophash sampling (PLS) optimization was performed for 10 proteins, and the discrimination score was computed. The increase in energy gap with bond flexibility is similar to that observed with more local optimization in Figure 1.
As a final test of the importance of flexible bond angles in protein structure modeling, we compared X-ray structure refinement with ideal backbone geometry to refinement with flexible backbone geometry. X-ray refinement has recently been implemented in Rosetta,12 and hence this comparison could be readily made using the alternative minimization protocols described above. We refined idealized (bond geometries set to their ideal values) high-resolution structures against truncated (to 4 Å) reciprocal space crystal diffraction data; the truncation was to a resolution where bond nonideality is not specified by the data alone. Idealizing structures provides a common starting point and helps pinpoint the effect of adding bond angle flexibility. The R-free values after refinement with flexible bond angle optimization were consistently lower than after refinement with ideal bond angle optimization (Fig. 5), further highlighting the importance of flexible bond angles in defining native structures.
Figure 5.
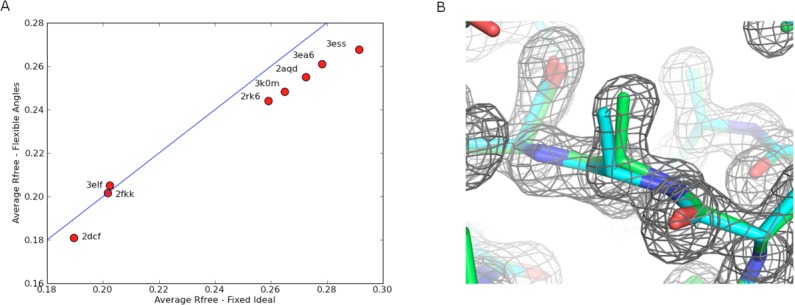
Crystallographic refinement with flexible bonds gives a better fit to low-resolution data than fixed bond refinement. (A) In all but one case, flexible refinement yields a lower average R free. (B) Comparisons of models for 2rk6 after ideal (blue) and flexible (green) refinement. The map is built from high-resolution data - not the low-resolution data used for refinement - to better represent the improved fit.
Having determined that flexible bond angles - particularly backbone angles – yield energy landscapes with the native structure in a deeper minimum, we proceeded to experiment with the FastRelax protocol to identify the most efficient local optimization protocol. Figure 6 shows the results on several different nonideal FastRelax variants. 270 decoys were optimized under each protocol; the average energy over the set is plotted as a function of average protocol run time. The first observation is that protocols making use of Cartesian optimization were more effective in reducing the energy than protocols optimizing internal coordinates alone. Of the internal coordinate optimization protocols, lowest energies were obtained when all angles but no lengths were allowed to deviate during refinement. Finally, the lowest overall energies were observed by running a two phase protocol, where the structure was first optimized in internal coordinates with bond lengths fixed, then optimized in Cartesian space. This combined protocol performs considerably better than either internal coordinate torsion angle optimization or Cartesian optimization alone (compare Fig. 6 left, red circles with Fig. 6 open black).
Figure 6.
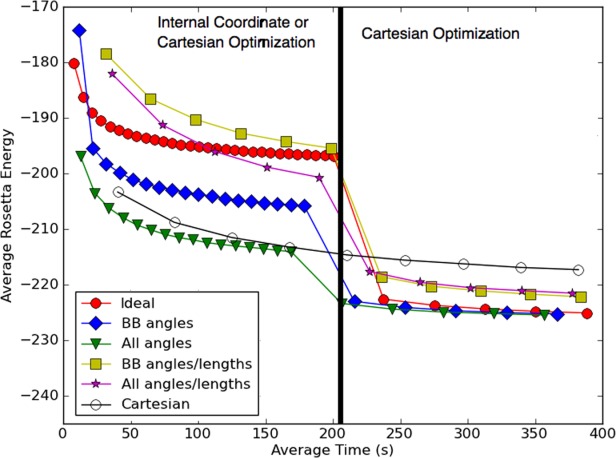
Combined internal coordinate and Cartesian relax is more effective than either one alone. A representative set of starting models was relaxed using different protocols (colors) and the average energy over all calculations (y-axis) was determined as a function of run time (x-axis). At 200 s (black vertical bar), the minimization method within the relax protocol was changed as indicated in the inset box (for example, ideal-Cartesian indicates that the first 200 s used ideal bond internal coordinate minimization, and the second 200 s, Cartesian minimization (all DOFs variable). The best performance (lowest energies after 400 s) was obtained using protocols that kept bond lengths fixed in the first phase and switched to Cartesian minimization in the second phase.
The improved performance of the protocol with fixed bond length internal coordinate optimization followed by Cartesian optimization may be rationalized as follows. In the initial phases of optimization, restricting DOFs has the advantage of allowing exploration further in conformational space and avoiding trapping in local minima not accessible with more ideal geometry. Restricting bond lengths has the further advantage of speeding up the internal coordinate optimization. On the other hand, Cartesian minimization is likely to be much more effective in finding the lowest energy structure in the immediate neighborhood and hence is effective at the late stages of optimization.
Allowing bond flexibility during refinement increases running time somewhat: our combined refinement protocol takes approximately 110 s for a 100 residue protein compared to about 40 s for the fully ideal protocol. Most of the runtime increase is due to Cartesian optimization, where the large bond length spring constants require significantly more minimization cycles for convergence.
Discussion
Bond angle variation is clearly evident in protein structures; indeed, bond angles in high-resolution crystallographic structures deviate from ideal values more than in lower-resolution structures.13 This has been borne out in crystallographic refinement experiments,14 but the effects of bond length and angle flexibility on the full energy landscape have not, to our knowledge, previously been explored. In this study, we show that incorporating bond angle flexibility significantly increases the energy gap between native and non-native conformations, and improves crystallographic refinement at low resolution. The increase in the magnitude of the energy gap separating native and non-native structures suggests that the former indeed take advantage of the small amount of flexibility inherent in atomic bonds to obtain better packing and overall energetics. When angles are constrained to ideal values, interatomic interactions, particularly Lennard-Jones and hydrogen-bonding interactions, cannot be as finely optimized. The energy of the native structure appears to suffer more from this limitation than non-native structures, likely because of its higher packing density.
Most of the improvement results from freeing backbone angles. Slight angular changes in backbone bonds affect the entire chain position. Allowing bond lengths to change has relatively little effect, likely because the overall perturbation to the chain is much smaller.
It is notable that local optimization protocols combining internal coordinate and Cartesian optimization perform considerably better than either one alone in finding lower energy minima. Although Cartesian optimization reaches much lower energies than internal coordinate optimization alone, lower energies are obtained when Cartesian optimization is preceded by internal coordinate optimization of torsion angles, with or without bond angle optimization. Internal coordinate minimization is better able to bypass local minima traps early in optimization; Cartesian relax can then further refine the interactions locally (without suffering from lever effects preventing further relaxation). The improved performance of the combined protocol could also derive in part from a greater effectiveness of internal coordinate minimization at optimizing bond torsional energies, and Cartesian space minimization, at optimizing atom–atom interactions (in internal coordinates, optimizing the distance between atoms close in space but distant along the sequence requires simultaneous variation of the many DOFs between them).
It is tempting to speculate, by analogy to our simulation results, that bond angle distortions occur late in protein folding to optimize interatomic interactions in the native structure and that this contributes significantly to the thermodynamic stability of the native state. We are not aware of any experimental data on the magnitude of deviations from ideality in unfolded states and protein folding intermediates, but it is plausible that only in the native structure is there sufficient packing density for the cost of bond angle distortions to be more than compensated by decreases in atom–atom interaction energy.
Methods
To assess the accuracy of different dimensionality protein representations, we focus on the energy gap between the native and non-native conformations; for folding to occur, the energy of the native structure must be much lower than non-native conformations. Identifying the lowest energy non-native conformations from scratch for large numbers of alternative representations is computationally intractable. Therefore, we initially generated a set of low energy structures spanning conformational space using a large-scale space search procedure.15 The number of representatives at each RMSD distance from the native structure was normalized to prevent overrepresentation of any particular area of conformational space. The resulting structures are densely packed and energetically competitive conformations (or “decoys”) of the native sequence [Fig. 2(A)]. Changes in model representation and local optimization methods are then evaluated by minimizing each precalculated structure in the new force field, allowing it to descend to its new local minimum. The difference in energy between models inside and outside of the native energy minimum is then evaluated: model representations leading to larger energy gaps (normalized based on the spread in energies among the models) are considered better than those with smaller gaps [Fig. 2(B)].
We apply this approach to comparing fixed and flexible bond representations in the context of the Rosetta force field. Rosetta modeling calculations generally involve an internal coordinate representation based on a “fold tree”.16 The standard fold tree only allows backbone and sidechain torsions (for rotamers) as DOFs during minimization, bond angles, and lengths are kept fixed. Flexible bond geometry was implemented by allowing bond lengths and angles to vary in the internal coordinate space optimization. The implementation allows selective restrictions of subsets of DOFs, for example, letting only the backbone angles vary.
We compared internal coordinate optimization to Cartesian-space optimization (Fig. 1); in the former, minimization is guided by gradients with respect to bond and torsion geometries; in the latter, by gradients with respect to the (x, y, z) coordinates of each atom. By definition, Cartesian-space minimization permits flexible bonds and planarity. For both representations, parameters for harmonic bond length and angle force constants were taken from CHARMM32.2 In addition, constraints using CHARMM32 parameterization were also added to control improper torsions in Cartesian space. A global weight was used to control the scaling of the bonded versus non-bonded terms. MolProbity was used to validate bond angle and length distributions to ensure structure predictions were physically realistic.17
Local optimization protocol
To compare fixed ideal internal coordinate minimization, flexible internal coordinate minimization, and Cartesian minimization, the standard Rosetta local optimization protocol – FastRelax18 - was adapted to optionally allow minimization of covalent DOFs (bond angles and lengths), and minimization in Cartesian space. We also modified the FastRelax protocol to perform first internal coordinate optimization, which may have a larger radius of convergence,7 and then Cartesian minimization.
The original FastRelax protocol uses multiple iterations of repulsive weight annealing with combinatorial rotamer optimization and minimization to optimize energies (ramp-repack-min). There are five cycles each consisting of four iterations of ramp-repack-min starting with repulsive at 2% of full strength, followed by 25, 55, and 100% successively. Only minimization permits flexible bonds; the rotamer set used in repacking has ideal bonds.
Fixed ideal internal coordinate relax uses the original FastRelax protocol described above. Flexible internal coordinate relax uses the same protocol, but frees the bond angle DOFs during minimization. Cartesian relax starts with three rounds of flexible angle internal coordinate minimization and then performs the remaining two rounds of FastRelax in Cartesian space. Command lines are provided in the Supplemental Materials.
Discrimination benchmark
The benchmark we use to evaluate the discriminatory power of the Rosetta force field consists of 82 small globular proteins15,19 covering a diverse set of topologies. All proteins are monomers between 55 and 224 residues in length, have crystal data with <2 Å resolution, and with crystal-stabilized regions visually identified and removed. For each protein, 40,000–200,000 decoys were generated using biased and unbiased ab-initio sampling runs15 followed by extensive loop building and relaxation using the Rosetta full-atom energy function and PLS.11 Additional PLS runs were seeded with the native structure to further increase sampling density near the native state. The resulting decoy structure sets comprise many competitive low-energy non-native conformations, sometimes lower in energy than close-to-native structures. All these conformations were pooled and 1000 representative low-energy structures from each protein were chosen to evenly cover the range of possible RMS values.
To test each set of parameters and flexibility settings, we ran five FastRelax trajectories per starting model, producing 369,000 decoys in total. This short refinement balances the need to let each structure optimize against the new parameter set and computational feasibility. Each full test of a parameter set consumed ∼50,000 CPU h.
Discrimination measure
To quantify the discriminatory ability of a parameter set we used the following procedure, given a large set of structures and their energies. First, energy values are normalized by rescaling the energies such that the fifth percentile and 95th percentile energies take the values of 0 and 1, respectively. Then, for each protein a separate discrimination score s is calculated [Fig. 2(B)] at seven different RMS values r = [1.0, 1.5, 2.0, 2.5, 3.0, 4.0, 6.0], by taking the normalized energy difference of the lowest-energy structure below and above the dividing line at each r.
The total discrimination score is then calculated as the average score over all proteins and all values of r. The score is constructed such as to capture changes in discrimination at various resolutions, with a lower score indicating better overall discrimination.
Backbone conformational sampling
To further assess discrimination under more aggressive search, we used the (PLS)11 on a subset of the 82 proteins used above. In each iteration of PLS, a set of input structures are selected and local structure segments are randomly replaced with segments found in the PDB. Variants are relaxed and the lowest energy variants are accumulated and filtered by a diversity criterion. PLS is able to generate large backbone conformational changes and samples a significant portion of conformational space around a given topology.
While PLS is a powerful sampling protocol, it was not computationally feasible to run it for all 82 proteins and all parameter sets. Instead, 10 proteins without disulfide bonds (which complicate topology sampling) were randomly selected from the set. One PLS run for each structure was performed, starting with 200 low-energy decoys per protein, evenly selected across the range of possible RMS values and excluding any decoys created from native-biased ab-initio algorithms. Each run sampled with 8192 cores for 6 h on the Intrepid Blue Gene/P supercomputer at Argonne National Laboratory. Upon conclusion of the runs, the energy landscape was well covered over a large range of RMS values.
Crystallographic refinement
A set of eight crystal structures that had been solved using high-resolution crystal data, along with their deposited structure factors, was chosen from the PDB. The structures were “idealized” by forcing ideal geometry and minimizing with constraints on the atom positions of the deposited structure, resulting in a model with ideal geometry and low RMS deviation (generally less than 0.2 Å) from the original model. The crystallographic data was then truncated to 4 Å - a resolution too low for the data to identify deviations from ideal geometry - and the structures were refined against the truncated data using Rosetta-Phenix refinement in internal coordinates.12 Two separate refinement trajectories were run: one where bond geometry was allowed to deviate from ideality, and one where it was not. After both refinements, the free R factor (using the reflections marked as free in the deposited structure) of the ideal and nonideal models was calculated.
Optimizing fastrelax for flexible geometry
To optimize the FastRelax protocol for the larger search space and dual representations, we used a small benchmark of 270 compact decoys, generated by the Rosetta ab-initio protocol described earlier,15 with randomly selected sidechain conformations. Because the centroid structures were minimized with a different energy function than used for full-atom minimization (which is used by FastRelax), the comparison is not biased by the starting minima of the benchmark set. For each FastRelax cycle, we computed the average final energy and elapsed time from start. The relax protocols were performed for 400 s. The weights on the energy function score terms were the default Rosetta (score12) weights (ref) with the addition of the cart_bonded global bonded term (set to a weight of 0.5). We tested a variety of different FastRelax protocols utilizing various combinations of fixed internal coordinate, flexible internal coordinate, and Cartesian minimization.
Supplementary material
Additional Supporting Information may be found in the online version of this article.
References
- 1.Wang J, Cieplak P, Kollman PA. How well does a restrained electrostatic potential (RESP) model perform in calculating conformational energies of organic and biological molecules? J Comp Chem. 2000;21:1049–1074. [Google Scholar]
- 2.Brooks BR, Brooks CL, III, Mackerell AD, Jr, Nilsson L, Petrella RJ, Roux B, Won Y, Archontis G, Bartels C, Boresch S, Caflisch A, Caves L, Cui Q, Dinner AR, Feig M, Fischer S, Gao J, Hodoscek M, Im W, Kuczera K, Lazaridis T, Ma J, Ovchinnikov V, Paci E, Pastor RW, Post CB, Pu JZ, Schaefer M, Tidor B, Venable RM, Woodcock HL, Wu X, Yang W, York DM, Karplus M. CHARMM: the biomolecular simulation program. J Comp Chem. 2009;30:1545–1614. doi: 10.1002/jcc.21287. [DOI] [PMC free article] [PubMed] [Google Scholar]
- 3.Abagyan RA, Mazur AK. New methodology for computer-aided modelling of biomolecular structure and dynamics. 1. non-cyclic structures. J Biomol Struct Dyn. 1989;6:815–832. doi: 10.1080/07391102.1989.10507739. [DOI] [PubMed] [Google Scholar]
- 4.Mazur AK, Dorofeev VE, Abagyan RA. Derivation and testing of explicit equations of motion for polymers described by internal coordinates. J Comput Phys. 1991;92:261–272. [Google Scholar]
- 5.Rodriguez G, Jain A, Vaidehi N. A fast recursive algorithm for molecular dynamics simulation. J Comput Phys. 1993;106:258–268. [Google Scholar]
- 6.Das R, Baker D. Macromolecular modeling with rosetta. Annu Rev Biochem. 2008;77:363–382. doi: 10.1146/annurev.biochem.77.062906.171838. [DOI] [PubMed] [Google Scholar]
- 7.Abagyan R. ICM—a new method for protein modeling and design: applications to docking and structure prediction from the distorted native conformation. J Comput Chem. 1994;15:488–506. [Google Scholar]
- 8.Yu H, van Gunsteren WF. Charge-on-spring polarizable water models revisited: from water clusters to liquid water to ice. J Chem Phys. 2004;121:9549–9564. doi: 10.1063/1.1805516. [DOI] [PubMed] [Google Scholar]
- 9.Patel S, Brooks CL. CHARMM fluctuating charge force field for proteins: I parameterization and application to bulk organic liquid simulations. J Comput Chem. 2004;25:1–15. doi: 10.1002/jcc.10355. [DOI] [PubMed] [Google Scholar]
- 10.Liu D, Nocedal J. On the limited memory BFGS method for large scale optimization. Math Program. 1989;45:503–528. [Google Scholar]
- 11.Tyka MD, Jung K, Baker D. Efficient sampling of protein conformational space using fast loop building and batch minimization on highly parallel computers. J Comput Chem. 2012;33:2483–2491. doi: 10.1002/jcc.23069. [DOI] [PMC free article] [PubMed] [Google Scholar]
- 12.DiMaio F, Echols N, Headd J, Terwilliger T, Adams P, Baker D. Improved protein crystal structures at low resolution by integrated refinement with Phenix and Rosetta. Nat Methods. doi: 10.1038/nmeth.2648. (in press) [DOI] [PMC free article] [PubMed] [Google Scholar]
- 13.Jaskolski M, Gilski M, Dauter Z, Wlodawer A. Stereochemical restraints revisited: how accurate are refinement targets and how much should protein structures be allowed to deviate from them? Acta Crystallogr D. 2007;63:611–620. doi: 10.1107/S090744490700978X. [DOI] [PubMed] [Google Scholar]
- 14.Tronrud DE, Berkholz DS, Karplus PA. Using a conformation-dependent stereochemical library improves crystallographic refinement of proteins. Acta Cryst. 2010;D66:834–842. doi: 10.1107/S0907444910019207. [DOI] [PMC free article] [PubMed] [Google Scholar]
- 15.Tyka MD, Keedy DA, André I, Dimaio F, Song Y, Richardson DC, Richardson JS, Baker D. Alternate states of proteins revealed by detailed energy landscape mapping. J Mol Biol. 2011;405:607–618. doi: 10.1016/j.jmb.2010.11.008. [DOI] [PMC free article] [PubMed] [Google Scholar]
- 16.Rohl CA, Strauss CEM, Misura KMS, Baker D. Protein structure prediction using Rosetta. In: Brand L, Johnson ML, editors. Numerical computer methods. Vol. 383. Academic Press; 2004. pp. 66–93. [DOI] [PubMed] [Google Scholar]
- 17.Chen VB, Arendall WB, Headd JJ, Keedy DA, Immormino RM, Kapral GJ, Murray LW, Richardson JS, Richardson DC. MolProbity: all-atom structure validation for macromolecular crystallography. Acta Crystallogr D. 2010;66:12–21. doi: 10.1107/S0907444909042073. [DOI] [PMC free article] [PubMed] [Google Scholar]
- 18.Khatib F, Cooper S, Tyka MD, Xu K, Makedon I, Popovic Z, Baker D, Players F. Algorithm discovery by protein folding game players. Proc Natl Acad Sci U S A. 2011;108:18949–18953. doi: 10.1073/pnas.1115898108. [DOI] [PMC free article] [PubMed] [Google Scholar]
- 19.Leaver-Fay A, O'Meara M, Tyka M, Jacak R, Song Y, Kellogg E, Thompson J, Davis I, Pache R, Lyskov S, Gray J, Kortemme T, Richardson J, Havranek J, Snoeyink J, Baker D, Kuhlman B. Scientific benchmarks for guiding macromolecular energy function improvement. In: Keating Amy E., editor. Methods in enzymology. Vol. 523. Academic Press; 2013. pp. 109–143. [DOI] [PMC free article] [PubMed] [Google Scholar]
Associated Data
This section collects any data citations, data availability statements, or supplementary materials included in this article.


