

Abstract
The novel immunosuppressant sotrastaurin is a selective inhibitor of protein kinase C isoforms that are critical in signalling pathways downstream of the T cell receptor. Sotrastaurin inhibits nuclear factor (NF)-κB, which directly promotes the transcription of forkhead box protein 3 (FoxP3), the key regulator for the development and function of regulatory T cells (Tregs). Our center participated in a randomized trial comparing sotrastaurin (n = 14) and the calcineurin inhibitor Neoral (n = 7) in renal transplant recipients. We conducted ex vivo mixed lymphocyte reaction (MLR) and flow cytometry studies on these patient samples, as well as in vitro studies on samples of blood bank volunteers (n = 38). Treg numbers remained stable after transplantation and correlated with higher trough levels of sotrastaurin (r = 0·68, P = 0·03). A dose-dependent effect of sotrastaurin on alloresponsiveness was observed: the half maximal inhibitory concentration (IC50) to inhibit alloactivated T cell proliferation was 45 ng/ml (90 nM). In contrast, Treg function was not affected by sotrastaurin: in the presence of in vitro-added sotrastaurin (50 ng/ml) Tregs suppressed the proliferation of alloactivated T effector cells at a 1:5 ratio by 35 versus 47% in the absence of the drug (P = 0·33). Signal transducer and activator of transcription 5 (STAT)-5 phosphorylation in Tregs remained intact after incubation with sotrastaurin. This potent Treg function was also found in cells of patients treated with sotrastaurin: Tregs inhibited the anti-donor response in MLR by 67% at month 6, which was comparable to pretransplantation (82%). Sotrastaurin is a potent inhibitor of alloreactivity in vitro, while it did not affect Treg function in patients after kidney transplantation.
Keywords: autoimmunity, kidney transplantation, regulatory T cells, sotrastaurin
Introduction
Various immunosuppressive regimens are used in autoimmune disease and clinical transplantation, balancing between clinical efficacy and safety profiles.
In solid organ transplantation, regimens to prevent rejection of the donor organ usually include two to four classes of immunosuppressive drugs, of which calcineurin inhibitors (CNI) are the cornerstone. However, well-known side effects include nephrotoxicity, glucose intolerance, malignancy, hypertension and neurotoxicity [1]. Therefore, there is a strong clinical need for safer and more selective immunosuppressive agents that specifically target a particular molecule or pathway. Interference in the protein kinase C (PKC) signalling pathway by the novel immunosuppressant sotrastaurin provides this opportunity. PKC is a family of serine and threonine kinases that phosphorylate a wide variety of target proteins which are activated after T cell receptor and co-stimulation receptor (i.e. CD28) triggering [2]. PKC members are divided into three subclasses due to their structure and type of activation: classical, novel and atypical PKC. The classical isoforms α and β and the novel isoform θ are essential for T and B cell activation [3]. Most isoforms are expressed ubiquitously, whereas PKC θ is found predominantly in haematopoietic (and muscular) cells. After accumulation of PKC ε and PKC η in the immunological synapse [4], PKC θ is translocated to the membrane upon T cell receptor activation and activates the nuclear factor (NF)-κB transcription factor. NF-κB binds to the promoter of interleukin (IL)-2, interferon (IFN)-γ and also of forkhead box protein 3 (FoxP3) genes, prominent players in immune reactivity and regulation [5–7]. Sotrastaurin is a low molecular mass synthetic compound that potently inhibits the PKC α, β and the θ isoforms resulting in selective NF-κB inactivation, in contrast to calcineurin inhibitors, which inhibit both the NF-κB, p38 and nuclear factor of activated T cells (NFAT) signalling pathways [8,9]. Currently, the effect of sotrastaurin on FoxP3+ regulatory T cells and their function is unknown. It has been reported that calcineurin inhibitors affect the expansion and function of controlling regulatory CD4+CD25highFoxP3+ T cells (Tregs) while others, such as rabbit anti-thymocyte globulin (rATG) and mammalian target of rapamycin (mTOR) inhibitors, create a milieu by which these suppressor cells can proliferate [10–12]. Because Tregs require T cell receptor-mediated NF-κB activation and cytokines of the IL-2 family for their development, maintenance and suppressive function, their number and function might be influenced by sotrastaurin.
Sotrastaurin has recently been tested in psoriasis [13] and kidney transplantation [14,15]. Oncology trials in melanoma and lymphoma patients (ClinicalTrials.gov NCT01430416 and NCT01402440) are on their way. Our center participated in a randomized, multi-center trial comparing sotrastaurin and the calcineurin inhibitor neoral in de novo renal transplant recipients [15]. We conducted an ex vivo study on patient samples (stage 1 phase) to investigate the frequency and function of FoxP3+CD4+CD25high T cells. We also performed in vitro functional studies on samples of blood bank volunteers to study the different effects of sotrastaurin on T effector and regulatory cells.
Materials and methods
Patients
Twenty-one patients were randomized to receive either sotrastaurin 300 mg twice daily (n = 14) or neoral [starting dose 4 mg/kg/day, aimed trough levels 100–200 ng/ml (month 1), 75–150 ng/ml (months 2–3), 50–100 ng/ml (months 4–5) and 25–50 ng/ml (months 6–12), n = 7] 1 day after living (un)related de novo kidney transplantation. This cohort involved all (adult) patients in our center participating in an open-label, multi-centre, randomized Phase II trial [15] (trial number CAEB071A2206, stage 1) (Table 1). Both regimens included steroids, basiliximab [anti-CD25 monoclonal antibody (mAb)] and the mTOR-inhibitor everolimus [starting dose 1·5 mg twice daily, aimed trough levels 4–8 ng/ml)]. Patient blood samples were collected pre-, 2, 3 and 6 months after transplantation. Blood sampling was approved by the local ethical committee on human research. All patients gave written informed consent (Medical Ethic Committee number MEC-2007-219).
Table 1.
Baseline characteristics
| Sotrastaurin n = 14 | Neoral n = 7 | |
|---|---|---|
| Recipient age in years median (range) | 52 (19–65) | 43 (20–54) |
| Recipient male: female | 7:7 | 5:2 |
| Donor age in years median (range) | 49·5 (24–61) | 54 (41–61) |
| Donor male : female | 3:11 | 4:3 |
| Type of transplantation LR : LUR | 6:8 | 5:2 |
| HLA mismatch mean ± s.e.m. | A: 0·79 (0·15) B: 1·0 (0·21) DR: 1·07 (0·22) | A: 0·71 (0·36) B: 0·57 (0·20) DR: 1·0 (0·22) |
LR: living related; LUR: living unrelated; HLA: human leucocyte antigen; s.e.m.: standard error of the mean.
Peripheral blood mononuclear cells (PBMC) from patient heparinized blood samples were isolated by density gradient using Ficoll-Paque (density gradient 1077 g/ml). After isolation the PBMC samples were frozen in 10% dimethylsulphoxide (DMSO) (Merck, Schuchardt, Germany) and stored at −140°C until analysis. PBMC from healthy blood bank donors were also isolated and served as control.
Immunosuppressive drugs for in vitro testing
Neoral infusion (SandImmune®; Novartis Pharma, Switzerland) and sotrastaurin (Novartis Pharma) powder were dissolved in RPMI-1640 (Gibco BRL, Paisley, UK) and DMSO, respectively, and stored at −80°C until use. On the day of the experiment, stock solutions were dissolved in RPMI-1640.
Isolation of CD4+CD25high T cells
Defrosted PBMC were resuspended in cold magnetic-activated cell sorting (MACS) buffer according to the manufacturer's protocol (Miltenyi Biotec, Bergisch Gladbach, Germany) and supplemented with 7 μl CD25-microbeads (directed against epitope A of the CD25 molecule; Miltenyi Biotec)/107 PBMCs to isolate the CD25high T cells. After 15 min at 4°C, the cells were washed with MACS buffer and resuspended in 1 ml MACS buffer. Subsequently, the POSSEL-D protocol was performed on the autoMACS (Miltenyi Biotec). The CD4+CD25high population was defined as cells with high CD25 expression with a slightly lower CD4 expression. The untouched residual fraction consisted of CD25low T cells and was used as the responder/effector (Teff) population in the mixed lymphocyte reaction (MLR).
Flow cytometry
Patient samples were analysed for the presence of T, B and natural killer (NK) cells by eight-colour flow cytometry using a mixture of monoclonal antibodies conjugated directly with fluorescein isothiocyanate (FITC), phycoerythrin (PE), allophycocyanin (APC), peridinin chlorophyll protein-cyanine (PerCP-Cy5·5), phycoerythrin-cyanine (PE-Cy7) and allophycocyanin-cyanine (APC-Cy7) (BD multi-test TruCount tubes; BD Biosciences, San Jose, CA, USA). Ethylenediamine tetraacetic acid (EDTA) blood was incubated for 15 min with CD3, CD16/56, CD45, CD4, CD8 and CD19, followed by a 15-min Pharmlyse buffer step to lyse the red blood cells. Samples were measured on a fluorescence activated cell sorter (FACS)Canto II flow cytometer (BD Biosciences) for data analysis.
The number of Tregs was determined as follows: cells isolated after MACS isolation were incubated with CD25 epitope B (clone M-A251; BD Biosciences), an epitope not competing with basiliximab [16], CD4 (BD Biosciences), FoxP3 (clone PCH101; eBioscience, San Jose, CA, USA) and CD127 (BD Biosciences) monoclonal antibodies at room temperature for 30 min. The percentage of CD4+CD25high T cells was measured in the PBMC population and subsequently in the isolated and residual fractions. Subsequently the percentage of FoxP3+CD4+CD25high CD127low Tregs was calculated as a percentage of total CD3+CD4+ cells. The absolute number of Tregs was determined using the CD3+CD4+ numbers of the aforementioned EDTA method. Samples were analysed using FACS Diva version 6·0 software (BD Biosciences).
Mixed lymphocyte reactions (MLR)
The proliferation capacity of PBMC and responder CD25low T cells was tested by adding phytohaemagglutinin (PHA, 1 μg/ml/well) in a 200 μl/well round-bottomed 96-well plate (Nunc, Roskilde, Denmark) in triplicate. Proliferation was assessed after 72 h incubation at 37°C in a humidified atmosphere of 5% CO2; [3H]-thymidine (0·5 μCi/well; Amersham Pharmacia Biotech) was added for the last 8 h before harvesting. [3H]-thymidine incorporation into DNA was assessed using a Betaplate counter (MicroBeta liquid scintillation spectrophotometer (Wallac, Turku, Finland).
Dose–response curves for both sotrastaurin and neoral were determined in 38 different MLR assays with PBMC of blood bank volunteers (Sanquin, Rotterdam, the Netherlands). Responder cells were preincubated with 0, 25, 50, 100 or 250 ng/ml of sotrastaurin or neoral for 60 min. Assays were set up with 100 μl of 5·104 responder cells stimulated with 5·104 irradiated (45 Gy) [human leucocyte antigen (HLA) 2-2-2 mismatched] for 7 days. [3H]-thymidine 0·5 μCi/well was added 16 h before harvesting. The suppressive capacity of CD4+CD25high T cells was determined in MLR against donor cells. In co-culture experiments, CD4+CD25high T cells were titrated to CD4+CD25low responder T cells at 1:5 or 1:10 ratios, in the absence and presence of different concentrations of both sotrastaurin and neoral. Proliferation was measured after 7 days of stimulation (as described above).
Whole blood staining for phosphorylated signal transducer and activator of transcription (pSTAT-5)
Whole blood samples (100 μl) of three healthy volunteers were activated with IL-2 (2000 U/ml) (PeproTech, Rocky Hill, NJ, USA) with and without sotrastaurin 100 ng/ml for 30 min at 37°C. Red blood cells were lysed and fixed for 10 min at 37°C with Lyse/Fix Buffer (BD Biosciences). Next, cells were washed in FACSflow buffer (BD Biosciences) and permeabilized with cold 70% methanol for 30 min at −20°C. Cells were washed twice in FACSflow buffer (BD Biosciences) supplemented with 0·5% bovine serum albumin. IL-2-induced phosphorylation of STAT-5 was studied in CD3+CD4+CD25highCD127low T cells. Cells were incubated simultaneously for 30 min at room temperature with the following antibodies: pSTAT-5 (Y694)-PE, CD3-PerCP, CD4-PB, CD25 epitope B-PE-Cy7 and CD127 FITC, washed in FACSflow buffer and analysed on the FACSCanto II flow cytometer (BD Biosciences). Twenty thousand gated lymphocyte events/cells were acquired from each tube. Cells were analysed using BD FACS Diva version 6·0 software. The effect of IL-2 activation on pSTAT-5 was calculated as the pSTAT-5-PE percentage of the cytokine-stimulated sample minus the unstimulated sample (background).
Correlation between trough levels of sotrastaurin and absolute numbers of FoxP3+CD4+CD25high CD127low Tregs
Trough levels were obtained in EDTA collection tubes before the morning sotrastaurin dose on day 4; weeks 1, 2, 3; and months 1, 2, 3, 4, 5 and 6. Blood sample tubes were inverted several times to mix the contents and frozen at −70C°. Trough levels were quantified in whole blood by validated liquid chromatography methods with tandem mass spectrometry (LC-MS/MS). The absolute number of FoxP3+CD127lowCD4+CD25high Tregs was measured at months 3 and 6, as described above. For each sotrastaurin-treated patient the area under the curve of trough levels was determined until months 3 and 6 (AUC0–3 m and AUC0–6 m). The Treg numbers at month 3 were tested for correlation with the AUC0–3 m and the Treg numbers at month 6 were tested for correlation with AUC0–6 m.
Statistical analysis
The suppressive capacity of Tregs was expressed as the percentage inhibition of T effector proliferation expressed in counts per minute (cpm), calculated by applying the following formula: (cpm Teff) − (cpm Teff + Treg)]/(cpm Teff) × 100. Statistical analysis of the flow cytometry and MLR data was performed using Graphpad Prism (version 5). Paired t-test, Mann–Whitney U-test or Wilcoxon's matched-pairs signed-rank test were performed to identify differences between groups. In the dose–response curve experiments, half maximal inhibitory concentration (IC50) values were calculated with the median of 38 IC50 values, using Fit Spline point-to-point analysis. The relationship between AUC of sotrastaurin trough levels and Treg numbers was tested with Pearson's r correlation test.
The statistical significance level was determined as P ≤ 0·05.
Results
Proliferation of PBMC and inhibition by sotrastaurin in vitro
The inhibitory capacity of sotrastaurin was tested in MLR (n = 38). PBMC of healthy blood bank donors were used as the responder population and stimulated with irradiated HLA mismatched PBMC (Fig. 1). Responder PBMC were incubated with sotrastaurin 0, 25, 50, 100 or 250 ng/ml 60 min before the stimulator cells were added. A dose-dependent effect of the study drug on alloresponsiveness was observed: the mean proliferative response decreased in the presence of 25, 50 100 and 250 ng/ml sotrastaurin from 37250 to 21617, 18487, 9500 and 3191 cpm, respectively (all P < 0·0001; mean percentage of inhibition 40, 49, 74 and 92, respectively, Fig. 1). For each experiment the IC50 was calculated. The median IC50 for sotrastaurin was 90 nM (45 ng/ml) (molecular mass 499 acetate).
Fig. 1.
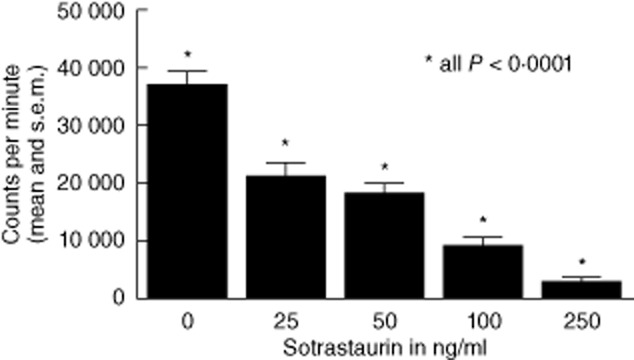
Proliferation of peripheral blood mononuclear cells (PBMC) and inhibition by sotrastaurin in vitro (n = 38 healthy individuals). All proliferation assays revealed more than 10 000 counts per minute. A dose-dependent effect of the study drug on alloresponsiveness was observed (all P < 0·0001). Half maximal inhibitory concentration (IC50) 90 nM (45 ng/ml).
Expression of phosphorylated (p)STAT-5
To study the effect of sotrastaurin on the IL-2-driven STAT-5 activation by Tregs, whole blood samples of three healthy volunteers were incubated with and without 100 ng/ml sotrastaurin in the presence of IL-2. In the absence of this cytokine STAT-5 was not phosphorylated in Tregs (all <4% pSTAT-5). After stimulation with IL-2, 47·5% (median) of Tregs phosphorylated STAT-5, which was similar in the presence of sotrastaurin (median 50·5%, Fig. 2).
Fig. 2.

(a) Representative example of signal transducer and activator of transcription 5 (STAT-5) phosphorylation by the CD127lowCD4+CD25high regulatory T cell (Treg) population after stimulation with interleukin (IL)-2 both in the absence and presence of sotrastaurin (100 ng/ml). (b) No STAT-5 phosphorylation by Tregs was measured in the unstimulated samples (n = 3, all <4%). After stimulation with IL-2 47·5% (median) of Tregs phosphorylated STAT-5, which was similar after incubation with sotrastaurin (median 50·5%). STR, sotrastaurin.
Sotrastaurin and the suppressive function of CD4+CD25high T cells in vitro
To study the effect of sotrastaurin on the function of CD4+CD25high Treg, PBMC and CD25low populations, co-culture experiments were performed in blood bank donor samples (n = 11).
Alloreactive response in MLR to irradiated stimulator cells was compared between PBMC and CD4+CD25low responder populations after depletion of CD4+CD25high T cells. Depletion of the Treg fraction from the PBMC resulted in a 91·3% increase in the proliferative response (P < 0·05). Subsequently, the suppressive capacity of these isolated Tregs was determined in co-culture experiments with CD25low responder cells in a 1 : 5 ratio. We set the Teff proliferation as 100%, and compared this to the proliferation after addition of sotrastaurin and after co-culture with Tregs. Tregs significantly inhibited alloproliferation in the absence (median inhibition 47%, P = 0·002) and presence of 50 ng/ml sotrastaurin (median inhibition 35%, P = 0·002). This difference in inhibition was not statistically significant (P = 0·33) (Fig. 3).
Fig. 3.
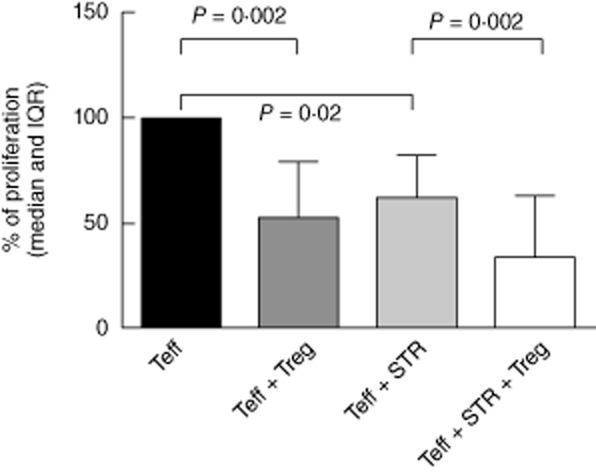
Co-culture assay of CD4+CD25low: CD4+CD25high T cells in mixed lymphcocyte reaction (MLR), with and without sotrastaurin (STR) 50 ng/ml (n = 11). To test the effect of sotrastaurin on the inhibitory function of regulatory T cells (Tregs), we set the proliferation of CD4+CD25low T cells as 100% and analysed whether the addition of STR and/or the co-culture with Tregs led to a lower proliferation (median % of proliferation and interquartile range). The percentage of inhibition by Tregs was 47% (P = 0·002) without the drug and 35% (P = 0·002) in the presence of STR. This difference in inhibition was not statistically significant (P = 0·33). T effector (Teff) CD4+CD25low T cell; Treg: co-cultured with CD4+CD25high T cells in a 1 : 5 ratio; STR: sotrastaurin 50 ng/ml; IQR: interquartile range.
Patient data: absolute numbers of peripheral lymphocytes and Tregs in sotrastaurin- and neoral-treated patients
Fourteen patients were treated with sotrastaurin and seven patients were treated with neoral. Blood samples were collected pre-, 3 and 6 months after transplantation. At 6 months, 17 patients still used their study drug regimen (10 sotrastaurin versus seven neoral patients). The reasons for discontinuing the study drug were various, among them adverse events related to the use of sotrastaurin, neoral and everolimus. The absolute numbers of different lymphocyte subsets were measured using flow cytometry. The numbers of CD3+ T cells, CD4+ helper T cells, CD8+ cytotoxic T cells, CD16+56+ NK cells, CD19+ B cells and the ratio of CD4+/CD8+ T cells did not change significantly over this 6-month period (Table 2).
Table 2.
Flow cytometric results of patients' peripheral lymphocyte composition
| Sotrastaurin | Neoral | |||||
|---|---|---|---|---|---|---|
| Cells/μl | Pre-† | 3 months | 6 months | Pre- | 3 months | 6 months |
| CD3+ range | 851 | 1077 | 845 | 878 | 789 | 1034 |
| 263–1911 | 227–1833 | 345–1589 | 685–1115 | 127–1483 | 435–1710 | |
| CD3+4+ range | 508 | 694 | 483 | 544 | 499 | 590 |
| 123–725 | 105–1135 | 245–969 | 439–905 | 81–826 | 342–1085 | |
| CD3+8+ range | 150 | 249 | 236 | 232 | 251 | 434 |
| 80–1469 | 60–725 | 65–920 | 156–483 | 37–608 | 86–945 | |
| CD16+56+ range | 278 | 127 | 169 | 141 | 123 | 152 |
| 63–563 | 59–391 | 77–250 | 101–391 | 65–330 | 45–245 | |
| CD19+ range | 98 | 107 | 67 | 144 | 111 | 136 |
| 39–330 | 24–277 | 29–183 | 22–213 | 20–460 | 12–341 | |
| CD45+ range | 1245 | 1374 | 1067 | 1273 | 1267 | 1422 |
| 370–2396 | 377–2136 | 510–1831 | 958–1415 | 227–2038 | 573–2112 | |
| CD4+/8+ range | 2·7 | 2·1 | 2·3 | 2·4 | 1·6 | 2·0 |
| 0·3–6·2 | 0·5–5·5 | 0·4–4·7 | 1·1–4·7 | 1·4–4·4 | 0·8–4·0 | |
Absolute numbers of peripheral lymphocytes in sotrastaurin- (n = 10) and neoral (n = 7)-treated patients (in cells/μl). The numbers of CD3+ T cells, CD4+ helper T cells, CD8+ cytotoxic T cells, CD16+56+ natural killer (NK) cells, CD19+ B cells and the ratio of CD4+/CD8+ T cells did not change significantly over a 6-month period (all P > 0·05).
Pre: pretransplantation.
The Treg population was defined as cells with high CD25 expression in combination with slightly less CD4 expression in combination with high FoxP3 and no or low expression of CD127 (IL-7R-α) expression (Fig. 4a). For sotrastaurin-treated patients the absolute number of FoxP3+CD127low Tregs remained stable: median numbers were 23, 16 and 28 cells/μl pre-, 3 and 6 months after transplantation (Fig. 4b). In neoral-treated patients, the number of FoxP3+CD127low Tregs decreased significantly at month 3 but returned to levels pretransplantation at month 6 (median 12 and 18 cells/μl 3 and 6 months after transplantation, P = 0·008 for neoral 3 months versus pretransplantation (Fig. 4b).
Fig. 4.
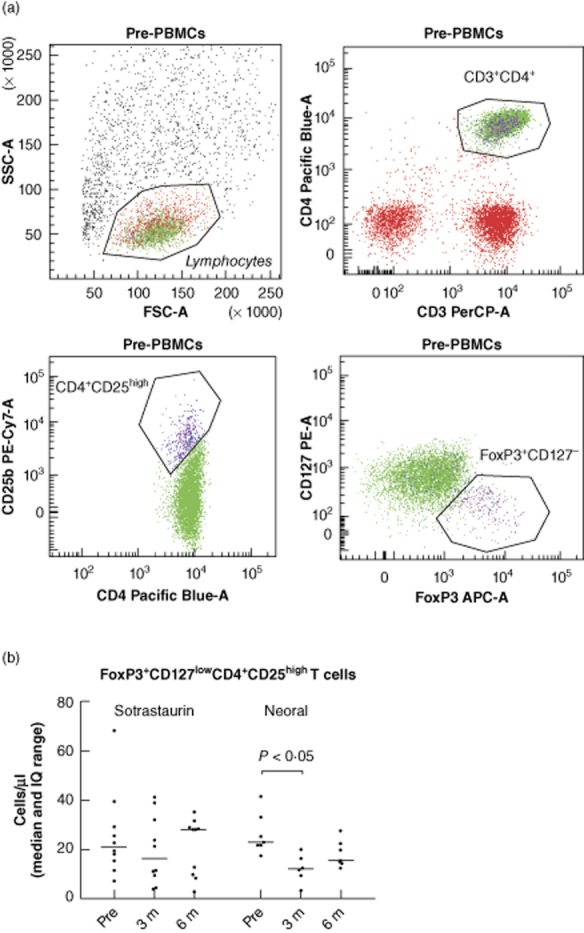
(a) Representative example of flow cytometry; the CD4+CD25high population was defined as cells with high CD25 expression with a slightly lower CD4 expression. Within this population, regulatory T cells (Tregs) express high forkhead box P3 (FoxP3) and are negative for or have low expression of CD127 expression. (b) The absolute number of FoxP3+CD127lowCD4+CD25high T cells in patient samples. Their numbers remained stable in sotrastaurin-treated patients, while in neoral-treated patients the number of FoxP3+CD127low Tregs decreased significantly at month 3 and returned to levels pretransplantation at month 6 (P < 0·05); n = 17 (10 sotrastaurin- and seven neoral-treated patients). STR, sotrastaurin.
Correlation between trough levels of sotrastaurin and number of Tregs
Trough levels of sotrastaurin correlated with Treg numbers: the AUC of trough levels at 0–3 months correlated with the absolute number of FoxP3+CD127lowCD4+CD25high T regulatory cells at 3 months (n = 10, Pearson's r = 0·65, P = 0·04).
The AUC of trough levels at 0–6 months also correlated with Treg numbers at 6 months (n = 10, Pearson's r = 0·68, P = 0·03) (Fig. 5).
Fig. 5.
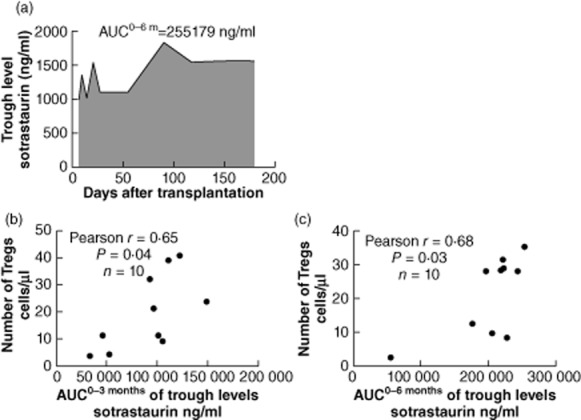
Correlation of sotrastaurin trough levels and regulatory T cell (Treg) numbers. Representative example of area under the curve (AUC) of sotrastaurin trough levels measured at day 4, weeks 1, 2, 3 and months 1, 2, 3, 4, 5 and 6 after transplantation (a). The AUC of sotrastaurin trough levels 0–3 months correlated with the absolute number of CD4+CD25high high forkhead box P3 (FoxP3)+ Tregs at 3 months (n = 10, Pearson's r = 0·65, P = 0·04) (b). The AUC of sotrastaurin trough levels 0–6 months correlated with the absolute number of CD4+CD25highFoxP3+ T regulatory cells at 6 months (n = 10, Pearson's r = 0·68, P = 0·03) (c).
Donor alloreactivity in patients treated with sotrastaurin and neoral
The functional capacity of patients' effector and regulator T cells was tested in MLR. Of two sotrastaurin- and two neoral-treated patients, the number of isolated CD4+CD25high T cells was insufficient to determine their inhibitory capacity at each timepoint. The proliferative response of effector CD25low cells in samples of three patients was <1000 cpm. Co-culture experiments with isolated CD4+CD25high Tregs in a 1 : 10 ratio were performed (n = 4 sotrastaurin and n = 6 neoral). We analysed whether co-culture with Tregs and time after transplantation influenced the proliferation in sotrastaurin- versus neoral-treated patients. The inhibitory capacity of Tregs in sotrastaurin-treated patients remained intact: the median percentages of inhibition by Tregs were 82% pretransplantation, 71% at 3 months and 67% at 6 months against donor cells (months 3 and 6, P > 0·05 due to small sample size) (Fig. 6).
Fig. 6.
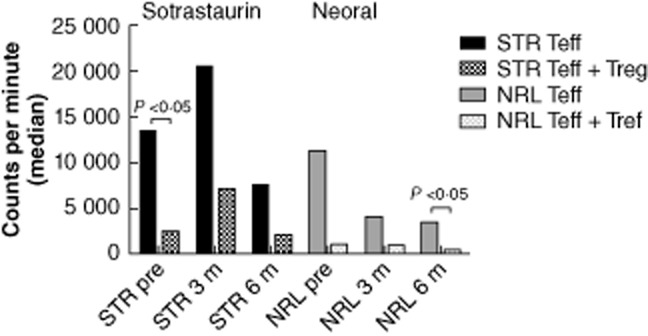
Proliferation of CD25low T cells (filled bars) in patient samples compared to co-culture with CD4+CD25high T cells in a 1:10 ratio (dotted bars). Of two sotrastaurin- and two neoral-treated patients, the number of isolated CD4+CD25high T cells was insufficient to determine their inhibitory capacity at each time-point. The proliferative response of effector CD25low T cells in samples of three patients was <1000 cpm. Samples of 10 patients (n = 4 sotrastaurin and n = 6 neoral) were included. In co-culture experiments against donor cells the inhibitory capacity of regulatory T cells (Tregs) remained stable. The median percentages of inhibition by Tregs were 82% pretransplantation (P < 0·05), 71% at 3 months and 67% at 6 months against donor cells in sotrastaurin-treated patients (P > 0·05 due to small sample size). STR: sotrastaurin; NRL: neoral; Teff: effector T cell; Treg: regulatory T cell.
Discussion
The protein kinase C inhibitor sotrastaurin is a novel, calcineurin-independent drug in autoimmune disease, oncology and clinical organ transplantation. Currently, the effect of sotrastaurin on cell populations that control immune responses is unknown. We therefore investigated the number and function of regulatory T cells in samples of healthy volunteers and in renal allograft recipients during sotrastaurin treatment.
First, we determined the IC50 of sotrastaurin in MLR to confirm previous reported findings: Evenou et al. have shown that sotrastaurin potently inhibited alloreactivity of mouse and human T cells [6]. In a two-way MLR performed with human T cells, the IC50 of sotrastaurin to inhibit [3H]-thymidine incorporation after 6 days was 37 nM. The studies by Matz et al. also revealed dose-dependent inhibition by sotrastaurin of carboxyfluorescein succinimidyl ester (CFSE)-labelled CD4+ T cells, after allogeneic stimulation [17]. In one-way MLR with irradiated stimulator cells, we demonstrated that sotrastaurin blocked alloreactivity dose-dependently (Fig. 1). In the high concentration of 250 ng/ml, the mean percentage of inhibition was 92%. The mean IC50 of sotrastaurin in our experiments was 89 nM.
Subsequently, we demonstrated that sotrastaurin left the suppressive capacity of regulatory T cells intact in our co-culture experiments: CD4+CD25high T cells inhibited the proliferative response of CD4+CD25low responder cells by 35% in the presence of sotrastaurin, compared to 47% when no drug was added (Fig. 3). This observation is strengthened further by the intact capacity of Tregs to phosphorylate STAT-5 in the presence of sotrastaurin (Fig. 2). Protein kinase C inhibition thus seems to have a differential effect on regulatory and effector T cell functions.
The explanation for the observed Tregs ‘sparing result’ is not fully understood. In Tregs, IL-2 is required for the induction and maintenance of FoxP3 expression to exert their suppressive function [18,19]. Transcription of IL-2 is regulated via NF-κB, and as PKC activates the NF-κB transcription factor it might be expected that the PKC inhibitor sotrastaurin diminishes IL-2 production. Matz et al. indeed demonstrated a significant decrease in IL-2 expression in PMA/ionomycin-stimulated T cells treated with sotrastaurin [17]. The question arises as to how Tregs can escape from the inhibitory effect of sotrastaurin on their main factor for expansion and function? Circulating Tregs already express FoxP3 protein and therefore sotrastaurin can no longer hamper these Tregs in their activities (Fig. 6), while the development of de novo FoxP3+ Tregs in patients on immunosuppressive drugs might be affected. Indeed, we found that in neoral-treated patients the number of circulating FoxP3+CD127low Tregs was lower at 3 months after transplantation (Fig. 4b). This was not found in sotrastaurin-treated patients, suggesting that the immune system bypassed the IL-2 blockade via activation of other intracellular signalling pathways, e.g. NFAT and p38. Both intracellular signalling molecules control the production of IL-2. However, in patients treated with the less selective immunosuppressive agent neoral, IL-2 production is inhibited via blockade of all major signalling pathways, i.e. NFAT, p38 and NF-κB1 [9,20]. Another explanation for ‘Treg sparing’ might be the differential signalling cascades downstream of the IL-2 receptor activation. Sewgobind et al. found that IL-2-induced STAT-5 phosphorylation had a different effect on Treg and Teff function [21]. Inhibition of IL-2-induced STAT-5 phosphorylation by the Janus kinase (JAK) inhibitor tofacitinib abrogated Teff function, while leaving the suppressive capacity of Tregs relatively intact. Molinero and Alegre have recently reviewed the role of NF-κB in alloreactivity and reported that development of thymic naive Tregs requires functional NF-κB, whereas the peripheral conversion into inducible Tregs may take place in the absence of NF-κB signalling [22]. This finding suggests that in our transplant patients conversion of T cells into inducible Tregs can occur during sotrastaurin treatment and that subsequently the balance between natural and induced Tregs will change, while leaving Treg numbers intact. The observed trough level-dependent effect of sotrastaurin on Treg numbers suggests that PKC inhibition shifts signalling pathways within the T cells towards a more regulator phenotype (Fig. 5). The pathway responsible might be the inhibition of mTOR activation via NF-κB [23] blockade by sotrastaurin. NF-κB is important for mTOR activation, which is a negative regulator of Treg cell expansion. Therefore, blockade of the PKC–NF-κB activation pathway by sotrastaurin could lead to a differential effect on T cells with a regulatory phenotype [24–27].
Our work focused on the effects of the novel immunosuppressant sotrastaurin on the development and function of CD4+CD25highFoxP3+ Tregs. We conclude that PKC inhibition potently blocks effector T cell function while leaving the inhibitory function of Tregs intact.
Acknowledgments
The clinical study was supported financially by Novartis.
Disclosure
None declared.
Author contributions
A. de W. was involved in recruiting study patients, performed the experiments and wrote the manuscript. M. K. treated the study patients. R. K. and J. Z. performed the experiments. W. W. was the principal investigator in our centre for the clinical trial and revised the manuscript. C. B. designed and supervised the experiments and revised the manuscript.
References
- 1.Halloran PF. Immunosuppressive drugs for kidney transplantation. N Engl J Med. 2004;351:2715–2729. doi: 10.1056/NEJMra033540. [DOI] [PubMed] [Google Scholar]
- 2.Baier G. The PKC gene molecule: molecular biosystematics to resolve its T cell functions. Immunol Rev. 2003;192:64–79. doi: 10.1034/j.1600-065x.2003.00018.x. [DOI] [PubMed] [Google Scholar]
- 3.Spitaler M, Cantrell DA. Protein kinase C and beyond. Nat Immunol. 2004;5:785–790. doi: 10.1038/ni1097. [DOI] [PubMed] [Google Scholar]
- 4.Quann EJ, Liu X, Altan-Bonnet G, Huse M. A cascade of protein kinase C isozymes promotes cytoskeletal polarization in T cells. Nat Immunol. 2011;12:647–654. doi: 10.1038/ni.2033. [DOI] [PMC free article] [PubMed] [Google Scholar]
- 5.Altman A, Isakov N, Baier G. Protein kinase C θ: a new essential superstar on the T-cell stage. Immunol Today. 2000;21:567–573. doi: 10.1016/s0167-5699(00)01749-7. [DOI] [PubMed] [Google Scholar]
- 6.Evenou JP, Wagner J, Zenke G, et al. The potent protein kinase C-selective inhibitor AEB071 (sotrastaurin) represents a new class of immunosuppressive agents affecting early T-cell activation. J Pharmacol Exp Ther. 2009;330:792–801. doi: 10.1124/jpet.109.153205. [DOI] [PubMed] [Google Scholar]
- 7.Guckel E, Frey S, Zaiss MM, Schett G, Ghosh S, Voll RE. Cell-intrinsic NF-κB activation is critical for the development of natural regulatory T cells in mice. PLOS ONE. 2011;6:e20003. doi: 10.1371/journal.pone.0020003. [DOI] [PMC free article] [PubMed] [Google Scholar]
- 8.Hamawy MM. Molecular actions of calcineurin inhibitors. Drug News Perspect. 2003;16:277–282. doi: 10.1358/dnp.2003.16.5.829315. [DOI] [PubMed] [Google Scholar]
- 9.Vafadari R, Hesselink DA, Cadogan MM, Weimar W, Baan CC. Inhibitory effect of tacrolimus on p38 mitogen-activated protein kinase signaling in kidney transplant recipients measured by whole-blood phosphospecific flow cytometry. Transplantation. 2012;93:1245–1251. doi: 10.1097/TP.0b013e318250fc62. [DOI] [PubMed] [Google Scholar]
- 10.Baan CC, van der Mast BJ, Klepper M, et al. Differential effect of calcineurin inhibitors, anti-CD25 antibodies and rapamycin on the induction of FoxP3 in human T cells. Transplantation. 2005;80:110–117. doi: 10.1097/01.tp.0000164142.98167.4b. [DOI] [PubMed] [Google Scholar]
- 11.Sewgobind VD, Kho MM, van der Laan LJ, et al. The effect of rabbit anti-thymocyte globulin induction therapy on regulator T cells in kidney transplant patients. Nephrol Dial Transplant. 2009;24:1635–1644. doi: 10.1093/ndt/gfn778. [DOI] [PubMed] [Google Scholar]
- 12.Battaglia M. Potential T regulatory cell therapy in transplantation: how far have we come and how far can we go? Transpl Int. 2010;23:761–770. doi: 10.1111/j.1432-2277.2010.01127.x. [DOI] [PubMed] [Google Scholar]
- 13.Skvara H, Dawid M, Kleyn E, et al. The PKC inhibitor AEB071 may be a therapeutic option for psoriasis. J Clin Invest. 2008;118:3151–3159. doi: 10.1172/JCI35636. [DOI] [PMC free article] [PubMed] [Google Scholar]
- 14.Friman S, Arns W, Nashan B, et al. Sotrastaurin, a novel small molecule inhibiting protein kinase C: randomized Phase II study in renal transplant recipients. Am J Transplant. 2011;11:1444–1455. doi: 10.1111/j.1600-6143.2011.03538.x. [DOI] [PubMed] [Google Scholar]
- 15.Tedesco-Silva H, Kho M, Hartmann A, et al. Sotrastaurin, a novel protein kinase C- inhibitor: evaluation of a CNI-free combination with everolimus in renal transplant recipients. Am J Transplant. 2013;13:1757–1768. doi: 10.1111/ajt.12255. [DOI] [PubMed] [Google Scholar]
- 16.Abadja F, Alamartine E, Berthoux F, Mariat C, Genin C, Lambert C. Quantification of circulating regulatory T cells by flow cytometry in kidney transplant patients after basiliximab induction therapy. Transplantation. 2010;89:366. doi: 10.1097/TP.0b013e3181bbbd67. [DOI] [PubMed] [Google Scholar]
- 17.Matz M, Weber U, Mashreghi MF, et al. Effects of the new immunosuppressive agent AEB071 on human immune cells. Nephrol Dial Transplant. 2010;25:2159–2167. doi: 10.1093/ndt/gfp775. [DOI] [PubMed] [Google Scholar]
- 18.Thornton AM, Donovan EE, Piccirillo CA, Shevach EM. IL-2 is critically required for the in vitro activation of CD4+ CD25+ T cell suppressor function. J Immunol. 2004;172:6519. doi: 10.4049/jimmunol.172.11.6519. [DOI] [PubMed] [Google Scholar]
- 19.Burchill MA, Yang J, Vogtenhuber C, Blazar BR, Farrar MA. IL-2 receptor beta-dependent STAT5 activation is required for the development of Foxp3+ regulatory T-cells. J Immunol. 2007;178:280–290. doi: 10.4049/jimmunol.178.1.280. [DOI] [PubMed] [Google Scholar]
- 20.Dong C, Davis RJ, Flavell RA. MAP kinases in the immune response. Annu Rev Immunol. 2002;20:55. doi: 10.1146/annurev.immunol.20.091301.131133. [DOI] [PubMed] [Google Scholar]
- 21.Sewgobind VDKD, Quaedackers ME, Van der Laan LJW, et al. The Jak inhibitor CP-690,550 preserves the function of CD4+CD25brightFoxP3+ regulatory T cells and inhibits effector T cells. Am J Transplant. 2010;10:1785–1795. doi: 10.1111/j.1600-6143.2010.03200.x. [DOI] [PubMed] [Google Scholar]
- 22.Molinero LL, Alegre ML. Role of T cell-nuclear factor κB in transplantation. Transplant Rev (Orlando) 2012;26:189–200. doi: 10.1016/j.trre.2011.07.005. [DOI] [PMC free article] [PubMed] [Google Scholar]
- 23.Minhajuddin M, Bijli KM, Fazal F, et al. Protein kinase C-delta and phosphatidylinositol 3-kinase/Akt activate mammalian target of rapamycin to modulate NF-kappaB activation and intercellular adhesion molecule-1 (ICAM-1) expression in endothelial cells. J Biol Chem. 2009;284:4052–4061. doi: 10.1074/jbc.M805032200. [DOI] [PMC free article] [PubMed] [Google Scholar]
- 24.Delgoffe GM, Kole TP, Zheng Y, et al. The mTOR kinase differentially regulates effector and regulatory T cell lineage commitment. Immunity. 2009;30:83244. doi: 10.1016/j.immuni.2009.04.014. [DOI] [PMC free article] [PubMed] [Google Scholar]
- 25.Baier G, Telford D, Giampa L, et al. Molecular cloning and characterization of PKC theta, a novel member of the protein kinase C (PKC) gene family expressed predominantly in hematopoietic cells. J Biol Chem. 1993;268:4997–5004. [PubMed] [Google Scholar]
- 26.Park S, Zhao D, Hatanpaa KJ, et al. RIP1 activates PI3K-Akt via a dual mechanism involving NF-kappaB-mediated inhibition of the mTOR-S6K-IRS1 negative feedback loop and down-regulation of PTEN. Cancer Res. 2009;69:4107–4111. doi: 10.1158/0008-5472.CAN-09-0474. [DOI] [PMC free article] [PubMed] [Google Scholar]
- 27.Zeng H, Yang K, Cloer C, Neale G, Vogel P, Chi H. mTORC1 couples immune signals and metabolic programming to establish T(reg)-cell function. Nature. 2013;499:485–490. doi: 10.1038/nature12297. [DOI] [PMC free article] [PubMed] [Google Scholar]