Abstract
Besides the overall mass density, strength of trabecular bone depends significantly on its microstructure. However, due to dose constraints in medical CT imaging, it is impossible to gain sufficient information about very fine bone structures in vivo on the micrometer scale. Here we show that a recently developed method of X-ray vector radiography (XVR), an imaging method which uses X-ray scattering information to form an image, allows predictions on the bone microstructure without the explicit need to spatially resolve even individual trabeculae in the bone. We investigated thick human femoral bone samples and compared state-of-the-art μCT data with XVR imaging. A model is presented which proves that XVR imaging yields information directly correlated with the trabecular microstructure. This opens up possibilities of using XVR as a tool to help early diagnosis of bone diseases, such as osteoporosis.
Osteoporosis is an under-diagnosed, serious bone disease that affects a substantial amount of the population. Estimated 200 million people worldwide are affected by osteoporosis today1. An early diagnosis is crucial to ensure a proper treatment before fractures might occur. The gold standard used in today's diagnostics of osteoporosis is dual-energy X-ray absorptiometry (DXA) and the T-score value calculated from the resulting bone mineral density (BMD)2. One often recommended location for diagnosis is the proximal femur area3,4,5,6, as it is subject to large mechanical loads and poses an area of high risk for a fracture when suffering from osteoporosis. Even though DXA is able to assess bone quality to some degree, it is only able to give information about the BMD, whereas bone strength also depends on other factors, such as contributions caused by its structure7.
Grating-based phase-contrast X-ray imaging is a recently developed method that is able to provide complementary information compared to conventional radiography8,9,10. Using grating-based X-ray imaging, one can also obtain information about the local scattering strength of microstructures within a sample on a scale smaller than the actual pixel size. In analogy to visible light microscopy, this has been called dark-field X-ray imaging11. The recorded small angle scattering (SAS) signal often varies under rotation of the sample and we have previously called this direction-dependent dark-field imaging X-ray vector radiography (XVR)12. As the microstructure of the trabeculae plays an essential role in determination of bone strength (e.g. in pathologies like osteoporosis), we used trabecular bone in this study12. In bone research the so-called degree of anisotropy (DAB) is an important parameter to characterize the structural properties of trabcular bone13,14,15,16. One property of the XVR signal is that it often shows a preferred scattering orientation and thus an anisotropy of the signal can be measured17. To avoid confusion, the term anisotropy will always refer to the anisotropy of the XVR signal (DAXVR) in this article.
We have previously shown that thin slices of human trabecular bone do indeed display an anisotropic scattering behaviour under rotation and that XVR is able to record the different scattering orientations. In contrast to absorption based imaging modalities, such as μCT, XVR maintains its ability to give structural information even at coarse resolution and consequently low radiation exposure12. Naturally, human bone does not only consist of thin slices, but rather of a complex assembly of trabeculae in various directions. While it is possible to obtain information about this trabecular structure ex-vivo using μCT, this method is not suitable for diagnostics due to the very high dose required to directly resolve the individual trabeculae in great detail. For possible use of XVR as a diagnostical tool, it is vital to have a good understanding of how the XVR signal is being formed within a whole volume of trabecular bone. In this study we compare state-of-the-art μCT of thick human femoral bone samples with the respective XVR results.
Figure 1 sketches the fundamental differences between a μCT system and an experimental XVR setup. For the remainder of this article, we use a Cartesian coordinate system with its z-axis parallel to the propagation direction, y-axis parallel to the grating lines and the x-axis orthogonal to both of them. By using an elaborate numerical analysis, we correlate the XVR signal to the present trabecular microstructure within the sample.
Figure 1. Schematics of the micro-CT system (a) and experimental XVR setup (b) used for the measurements.
The micro-CT system utilizes a microfocus X-ray tube and divergent illumination to magnify a sample. The XVR setup employs a grating interferometer consisting of three gratings and is run with a conventional X-ray tube. Contrary to the micro-CT system, the sample is rotated in the plane perpendicular to the optical axis.
Results
In analogy to conventional absorption-based imaging, which is governed by the Lambert-Beer-Law, the visibility signal recorded during an XVR scan, V, can be described with an exponential function. The oscillating term is used to include anisotropic scattering within the sample18:
 |
 |
In eq. (1) and (2), (ω − φ) is the relative angle between the grating lines and the main scattering orientation in the sample. The degree of anisotropy (DAXVR) of the XVR signal can be defined as the amplitude of the oscillating part (a1) to the constant part (a0), which by this definition assumes values between 0 and 1:
 |
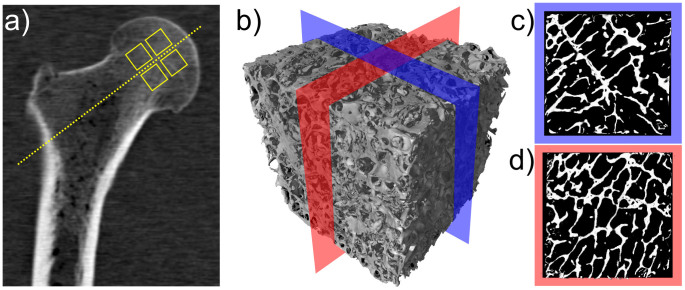
For our measurements, human femur head bone samples were acquired from three different donors at the pathological institute of Klinikum Rechts der Isar, Munich. Eight cubes (P1–P8) of 1 cm3 each were cut out around a defined axis through the centre of the femoral head as shown in fig. 2(a). Furthermore, a 3-D μCT scan rendering (b) as well as two cuts (c,d) are displayed. In agreement with local laws and institutional requirements, the samples were harvested to be used for educational and research purposes in consent with their respective donors.
Figure 2.
(a) Slice of a clinical CT of the upper part of an entire femur bone. The samples used in this study were prepared from the region around the rotational axis of the femoral head. This location is indicated by the four boxes. (b) Three-dimensional surface rendering of a high resolution μCT of a 1 cm3 cube of human femur bone sample P7. (c,d) Two-dimensional cuts (10 mm × 10 mm) through both horizontal axes, taken from the centre region as indicated in (b).
In the following, our aim is to connect the X-ray vector radiography signal to the actual microstructure. Starting from raw high-resolution CT absorption data from trabecular bone samples, we have a three dimensional volume of linear attenuation coefficients μ(x, y, z). We assume that scattering occurs mainly at borders between different materials in the sample, i.e. bone and soft tissue/air, which are perpendicular to the incident X-ray beam. In the case of the investigated bones, the different materials could be easily distinguished by their linear absorption coefficient since the predominant materials were bone, soft tissue and air.
From the two gradients of μn perpendicular to the incident beam, Gx,n and Gy,n, we can calculate the direction of biggest change φn(x, y) and its magnitude An(x, y) in different planes n:
 |
Using the superposition principle for XVR imaging18,19 to add the individual planes, we can calculate a function ψ(x, y), from which the orientation and anisotropy of the XVR signal can be derived:
 |
An elaborate description of the model is given in the Methods section.
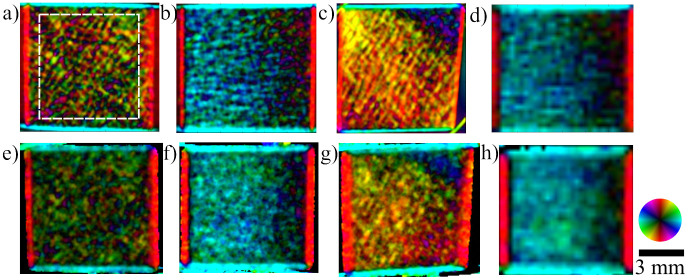
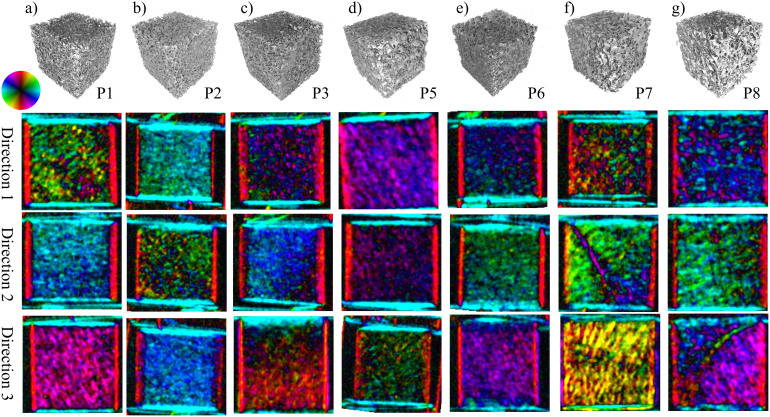
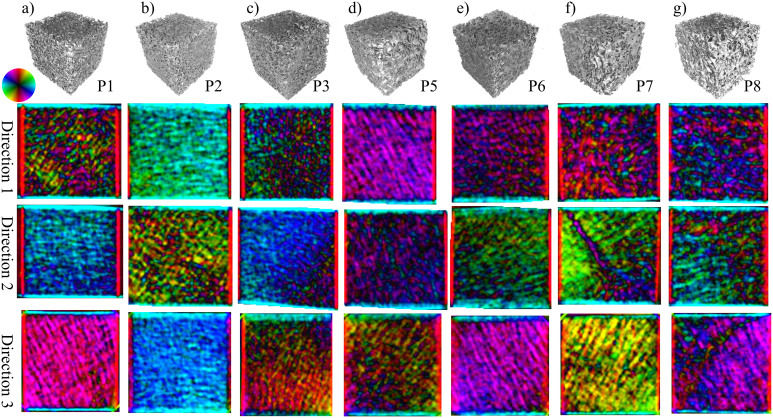
XVR measurements were performed on all eight cubes from three orthogonal sides each, resulting in a grand total of 24 independent scans. Likewise, the described model was applied to the μCT data along the three corresponding planes for each sample. A comparison between these two methods for specimen P4 can be seen in fig. 3. The main structural orientation is coded in the colour wheel, i.e. a horizontal structure that scatters in the vertical direction shows as light blue whereas a vertical structure appears as red. The brightness corresponds to the anisotropy, a higher anisotropy of the signal resulting in a brighter colour. As a consequence of this, completely isotropic scattering shows as black on the images. Additionally, the XVR and μCT calculation results of the remaining samples P1–P8, excluding P4, are visualized in fig. 4 and fig. 5, respectively.
Figure 3. Calculation using μCT data (a–d) and the corresponding X-ray Vector Radiography (XVR) images (e–h).
Three orthogonal sample orientations of the same specimen are shown. The colour encodes the orientation of the strongest signal, the brightness codes the anisotropy. A structure only scattering into the horizontal plane appears red with maximum brightness, whereas a completely isotropic signal appears dark. A decline in anisotropy towards the right side can be seen in images (b) and (f) as a decline in brightness. Images (c) and (g) show closely matching orientations of μCT calculation and XVR imaging for varying structural orientation. The area over which the anisotropy was averaged for a quantitative analysis is indicated in (a). The artefacts around the sample are caused by the sample holder. The effects of a greatly increased pixel size is shown for XVR measurements (h) and the corresponding μCT calculation (d).
Figure 4. μCT surface rendering and three XVR images from three orthogonal directions of specimen P1–P8 (a–g).
Sample P4 is shown separately in figure 3. Various features can be seen in the different samples and orientations. For example, an area with structural orientation deviating by almost 90° from the surrounding area is visible in the samples shown in (f) and (g) from direction 2 and 3, respectively. The raw μCT data show a strongly irregular trabecular structure present in these particular areas (also see fig. 2(b–d) for sample P7), which we believe corresponds to the epiphyseal plate.
Figure 5. Shown is a μCT rendering and the results of three calculations of the XVR signal, based on μCT data.
The samples and directions correspond to those shown in figure 4. The direction and anisotropy of the main structural orientation is encoded in the same way as for the XVR results in fig. 3.
We calculated the average anisotropy over a square area in the centre of the bone as indicated in fig. 3(a). The values for XVR measurements and calculations based on μCT data are listed in table 1. The correlation between the averaged anisotropy of both methods is illustrated in fig. 6(a). Each dot represents a pair of corresponding XVR/μCT data from one of the eight bone cubes and one of the three available sample orientations. The linear regression line has coefficients and respective standard errors a = (0.018 ± 0.019) and b = (0.827 ± 0.089).
Table 1. Mean anisotropy values of XVR measurements and μCT calculations, the values were derived from an area as indicated in figure 3(a) for each sample. The three orthogonal directions that were measured are indicated as 1,2 and 3, consistent with the notation used in figures 4 and 5.
| Sample | P1 | P2 | P3 | P4 | P5 | P6 | P7 | P8 | |
|---|---|---|---|---|---|---|---|---|---|
| calculation | 1 | 0.156 | 0.261 | 0.124 | 0.162 | 0.268 | 0.141 | 0.182 | 0.170 |
| 2 | 0.239 | 0.175 | 0.242 | 0.164 | 0.127 | 0.122 | 0.181 | 0.154 | |
| 3 | 0.311 | 0.376 | 0.167 | 0.278 | 0.128 | 0.270 | 0.263 | 0.234 | |
| XVR | 1 | 0.156 | 0.259 | 0.118 | 0.121 | 0.214 | 0.124 | 0.131 | 0.172 |
| 2 | 0.262 | 0.121 | 0.263 | 0.196 | 0.102 | 0.137 | 0.191 | 0.178 | |
| 3 | 0.263 | 0.326 | 0.163 | 0.218 | 0.087 | 0.201 | 0.253 | 0.224 | |
Figure 6. Mean anisotropy of XVR measurements plotted against mean anisotropy based on μCT calculations.
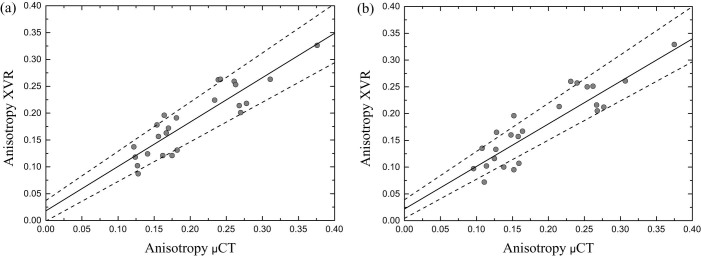
The area over which was averaged is indicated in figure 3(a). (a) The average anisotropy was calculated using the original XVR data with pixel size of 127 μm2 and corresponding μCT calculation. A linear fit line with coefficients a = (0.018 ± 0.019) and b = (0.826 ± 0.089) is added. (b) Rebinned XVR data corresponding to a very coarse detector pixel size of 508 μm2 was used to calculate the mean anisotropy. The parameters used in the μCT calculation was adjusted accordingly. The coefficients of the linear regression line are very similar to the original data presented in (a) with a = (0.022 ± 0.017) and b = (0.816 ± 0.085).
The mean orientation  was calculated over the same area and the discrepancy
  of every pair of measurement and calculation was averaged and a mean error of the orientation
  was found.
Furthermore, to demonstrate the preservation of the scattering information at very coarse resolutions, we rebinned the raw data before doing the stepping curve analysis and XVR processing. This corresponds to using a detector with pixel size of 508 μm2 in the XVR measurement. The resulting images for one sample orientation are shown exemplarily in figures 3(d) and 3(h). For the μCT calculation the the rebinning parameter was changed accordingly (also see Methods section). An average anisotropy was calculated for the rebinned XVR data and corresponding μCT calculation and the correlation is shown in figure 6(b). The coefficients of the linear regression line are a = (0.022 ± 0.017) and b = (0.816 ± 0.085).
Discussion
This study provides evidence that in trabecular bone the edges of the trabeculae in beam direction are indeed responsible for the formation of the X-ray vector radiography signal. We have shown a correct prediction of the preferred scattering orientation and anisotropy using μCT data. Comparing the XVR data to those calculated from the μCT measurement, the structure orientations and anisotropy values are in good agreement. It is to note that an area in which the trabeculae display an outstanding orientation compared to the bulk can both be seen in the XVR measurement and calculated by the presented method. Fig. 4(f) and fig. 5(f) depict XVR measurement and μCT calculation results of a sample that possesses these scattering characteristics in direction 2. Comparison with the raw μCT data reveals that there is indeed a strongly irregular layer of bone present throughout most of the sample in this particular area (see fig. 2(c)). The observed orientation can be traced back to the epiphyseal plate.
The quantitative analysis of the average anisotropy values shown in fig. 6 shows a good correlation between the two methods. We have shown that the correlation does not suffer as the pixelsize of the XVR data is increased and the presented model can explain the formation of the XVR signal even for very low resolutions. Furthermore, the anisotropy was calculated correctly not only for the average values but also for the distribution over an image. The distribution is not necessarily equal over the entire sample, e.g. the XVR measurement shown in fig. 3(e) exhibits a strong decline in anisotropy towards the right, a feature that is also found in the corresponding μCT calculation (see fig. 3(b)). This study of anisotropy also confirms that our initial assumption of completely anisotropic scattering is valid, as isotropic scattering in the sample, i.e. from microspheres of size below the resolution of the μCT scan would lower the anisotropy measured by the XVR setup substantially.
Limitations of the presented methods concern the fact that the dark field signal depends on both the linear absorption coefficient μ and the real part of the refractive index n20. In the calculations we assumed a parallel beam geometry, whereas a laboratory setup like the used XVR setup in general has a cone beam geometry (although with a small cone angle of 2°). In a more divergent geometry, a summation of the individual slices along one axis would not be correct any more and needs to be kept in mind for large samples. The presented study uses sufficiently small samples to warrant the assumption of a parallel beam addition, as the beam offset within the sample stays below the length scale of an individual pixel.
In conclusion, we have shown that the XVR signal of trabecular bone is primarily given by the existing trabecular structure in thick samples. This validation supports the idea of using X-ray vector radiography to gather supplementary information about the trabecular structures of femoral bone. Contrary to μCT, this additional structural information can be obtained without the need of having to directly resolve the structures. The most striking advantage of XVR is that it is possible to acquire this scattering information at very coarse resolutions, comparable to DXA. Information about the bone microstructure, next to the bone density information obtained with DXA, is currently not easily accessible and, as we have shown, the scattering orientation and anisotropy of the XVR signal are two properties related to this microstructure. This shows up the possibilities of XVR radiography as a possible supplementary tool in the field of bone quality assessment, and we believe that XVR might help improve diagnosis of osteoporosis in the future.
Methods
X-ray absorption micro CT
High resolution X-ray computed tomography (μCT) data of the samples was obtained using a v|tome|x s 240 system by GE Sensing & Inspection Technologies GmbH (Germany), installed at the Technische Universität München. A sketch of the system is shown in figure 1(a).
For this purpose, the X-ray tube was operated at an acceleration voltage of 90 kV and current of 150 μA. The geometry of the setup and resulting constraints in resolution lead to an isotropic voxel size of 18.53 μm for every sample. This is sufficient to resolve the trabecular structure of human vertebral bones21. The duration of a single CT scan was approximately 70 minutes with 2000 projections being taken over 360°. Figs. 2(b–d) show a rendered 3D volume of sample P7 as well as two cuts through its middle. As can be seen, the trabecular structure is well resolved.
X-ray vector radiography
The used setup is sketched in figure 1(b). A detailed description of a typical XVR setup and the measurement procedures can be found in e.g.17.
Our experiments were performed at the Technische Universität München at a laboratory setup operating a high power X-ray tube by Comet AG, Switzerland. For the experiments, the X-ray tube was operated at 60 kV and 30 mA with a 3.0 mm aluminum filter. The two absorption gratings consisted of 160 – 170 μm thick gold lines on 500 μm (G0) and 150 μm (G2) thick silicon substrates, filled with SU-8 photoresist. Complementing the set of gratings is a phase grating (G1) made of 8 μm nickel lines on a 200 μm thick silicon substrate. This results in a phase shift of π/2 at the design energy of 45.7 keV. The absorption gratings had a periodicity of 10 μm and the phase grating had a periodicity of 5.0 μm. All gratings had a duty cycle of 0.5. The setup is built to operate at the first fractional Talbot distance with equidistant grating locations G0 to G1 and G1 to G2 of 92.7 cm. The samples were placed 28 cm behind G1 towards G2. A Varian PaxScan 2520D with a CsI scintillator and pixel pitch of 127 μm was used as X-ray detector.
Micro CT data processing
There is a variety of edge detection filters in image processing, we used the Roberts Cross Operator to locate differences in density which shall be introduced here briefly22: Let μn be the slice with index n of the X-ray absorption data perpendicular to the beam direction in the XVR setup (z-axis). Then we can define for every slice the two gradients Gx and Gy as a convolution of the absorption data with the respective filter kernel:
 |
From these two gradients of μn we can calculate the direction of biggest change φn(x, y) and its magnitude An(x, y):
 |
We assume that every edge within the sample produces a fully anisotropic signal (a0 = a1) in direction φn(x, y) with magnitude An(x, y). The XVR signal of the whole sample can be seen as a superposition of each slice's contribution18,19. Consequently, it is necessary to find a way to combine the calculated signals derived from the actual microstructure and originating from different slices in the propagation direction of the beam. It is also known that any XVR signal can be described as a linear superposition of various fully anisotropic signals a1,i cos (2φ,i), which do not necessarily have the same phase, φ,i, or strength, a,i18,19:
 |
The factor 2 in the cosine's argument in eq.(8) accounts for the fact that due to the grating structure the signal does not vary with respect to a 180° rotation of the sample around the beam. With the previously mentioned assumption that scattering occurs fully anisotropic at each gradient and using the complex notation for a wave we can calculate a function that is expected to be proportional to the oscillating part of the XVR signal:
 |
From these oscillating functions ψ(x, y) we can extract the main structural orientation one would derive from the XVR signal φtot(x, y), which is equal to their argument in any given pixel P(x, y). The second important information one can obtain using XVR is the anisotropy of the signal. As defined earlier, it is the ratio of the oscillating part (a1) to the average signal (a0) after taking the negative logarithm of the recorded XVR signal. The absolute value of ψ(x, y) is proportional to a1(x, y), whereas the average part a0(x, y) is proportional to the sum of the amplitudes An(x, y) along the beam axis under the assumption of completely anisotropic scattering. Therefore, we can state that:
 |
 |
 |
Since the proportionality constants in eq.(11) and eq.(12) depend only on the relative values given by the μCT software and thus are the same, we can get the anisotropy by combining these equations:
 |
When comparing the anisotropy values calculated using this method with the ones directly obtained by a XVR measurement one needs to consider two effects which reduce the recorded anisotropy. Firstly, most pixelated detection mechanisms such as the used detector possess a certain lateral smearing of their response to a point signal, which can be described in terms of a point spread function (PSF). For this reason, a PSF was applied to the two-dimensional array of ψ(x, y) before calculating the orientation and anisotropy values by using the convolution operator (⊗):
 |
The unknown PSF of the detector was approximated with a two-dimensional Gaussian function of defined full width at half maximum (FWHM) at 10 pixels, corresponding to 185 μm. Secondly, there is a difference in resolution between the μCT and the XVR scan. For the purposes of this work, the resolution of the μCT scans was much higher compared to the XVR setup. This needs to be considered in the calculations, as a single detector pixel of the XVR setup integrates the recorded intensity over an area of 127 × 127 μm2. A binning of 5 × 5 pixels (20 × 20 pixels for the data set presented in Figure 6(b)) into a single pixel was applied on the complex valued function ψ(x, y) before calculating the orientation and anisotropy values. The size of the binning was chosen to account for the magnification introduced in the used XVR setup. Both of these effects can be seen as a lateral superposition of the signals in the individual pixels. These corrections affect mainly the calculated average anisotropy, the average orientation of the calculated signal remains nearly constant with varying parameters of the corrections. Samples with lower average anisotropy generally show a bigger decrease in anisotropy than those with a higher average anisotropy. This can easily be explained by the fact that samples with an overall lower anisotropy also had a greater variance in their scattering orientation. The reduction in anisotropy is stronger when signals with greatly different scattering orientations are summed up. As the width of the PSF is increased, a summation is done over a greater number of individual scattering orientations. Consequently, samples with a rapidly varying scattering orientation show a stronger decline in average anisotropy than very homogeneously scattering samples. In figure 3, orientation (a) of the sample resembles a very inhomogeneous scattering orientation, whereas orientation (b) shows a very homogeneous distribution of the scattering orientation. The overall average decrease of the average anisotropy for a PSF with FWHM of 5 pixels compared to the uncorrected case was 0.025 with a standard deviation of 0.013. For a PSF with FWHM of 10 pixels, these values nearly double with a decrease of 0.041 and standard deviation of 0.024, respectively.
The mean orientation of a sample was calculated by applying equations (9) and (10):
 |
Using this notation, every pixel is weighted equally, although different weighting factors may be used, e.g. the average scattering strength a0.
Author Contributions
F.S., A.M., G.P. and F.P. conceived the experiment. T.B., E.G.C. and J.S.B. supplied and prepared the samples. P.B.N. provided clinical CT data to aid with sample preparation. E.E. performed the measurements. F.S. performed the data analysis with significant input from A.M., G.P. and F.P. The paper was written by F.S., A.M. and F.P. with input from all co-authors.
Acknowledgments
We acknowledge financial support through the Deutsche Forschungsgemeinschaft (DFG) Cluster of Excellence Munich-Centre for Advanced Photonics (MAP), the DFG Gottfried Wilhelm Leibniz program and the European Research Council (ERC, FP7, StG 240142). This work was carried out with the support of the Karlsruhe Nano Micro Facility (KNMF, www.kit.edu/knmf), a Helmholtz Research Infrastructure at Karlsruhe Institute of Technology (KIT). This work was supported in parts by grants of the DFG BA 4085/1-2.
References
- Yasothan U. & Kar S. Osteoporosis: overview and pipeline. Nat. Rev. Drug Discov. 7, 725–726 (2008). [DOI] [PubMed] [Google Scholar]
- Kanis J. A. et al. Assessment of fracture risk. Osteoporos. Int. 16, 581–589 (2005). [DOI] [PubMed] [Google Scholar]
- Kanis J. A. Diagnosis of osteoporosis and assessment of fracture risk. Lancet 359, 1929–1936 (2002). [DOI] [PubMed] [Google Scholar]
- Bergot C., Bousson V., Meunier A., Laval-Jeantet M. & Laredo J. D. Hip fracture risk and proximal femur geometry from DXA scans. Osteoporos. Int. 13, 542–550 (2002). [DOI] [PubMed] [Google Scholar]
- O'Gradaigh D., Debiram I., Love S., Richards H. K. & Compston J. E. A prospective study of discordance in diagnosis of osteoporosis using spine and proximal femur bone densitometry. Osteoporos. Int. 14, 13–18 (2003). [DOI] [PubMed] [Google Scholar]
- Cheng X. et al. Assessment of the strength of proximal femur in vitro: relationship to femoral bone mineral density and femoral geometry. Bone 20, 213–218 (1997). [DOI] [PubMed] [Google Scholar]
- Sornay-Rendu E., Boutroy S., Munoz F. & Delmas P. D. Alterations of cortical and trabecular architecture are associated with fractures in postmenopausal women, partially independent of decreased BMD measured by DXA: the OFELY study. JBMR 22, 425–433 (2007). [DOI] [PubMed] [Google Scholar]
- Momose A. Phase-sensitive imaging and phase tomography using X-ray interferometers. Opt. Express 11, 2303–2314 (2003). [DOI] [PubMed] [Google Scholar]
- Weitkamp T., Diaz A., David C. & Pfeiffer F. X-ray phase imaging with a grating interferometer. Opt. Express 12, 2912–2914 (2005). [DOI] [PubMed] [Google Scholar]
- Pfeiffer F., Weitkamp T., Bunk O. & David C. Phase retrieval and differential phase-contrast imaging with low-brilliance X-ray sources. Nature Phys. 2, 258–261 (2006). [Google Scholar]
- Pfeiffer F. et al. Hard-X-ray dark-field imaging using a grating interferometer. Nature Mat. 7, 134–137 (2008). [DOI] [PubMed] [Google Scholar]
- Potdevin G. et al. X-ray vector radiography for bone micro-architecture diagnostics. Phys. Med. Biol. 57, 3451–3461 (2012). [DOI] [PubMed] [Google Scholar]
- Cruz-Orive L. M., Karlsson L. M., Larsen S. r. E. & Wainschtein F. Characterizing anisotropy: a new concept. Micron Micros. Acta 23, 75–76 (1992). [Google Scholar]
- Inglis D. & Pietruszczak S. Characterization of anisotropy in porous media by means of linear intercept measurements. Int. J. Solids Struct. 40, 1243–1264 (2003). [Google Scholar]
- Ketcham R. a. & Ryan T. M. Quantification and visualization of anisotropy in trabecular bone. J. Microsc. 213, 158–171 (2004). [DOI] [PubMed] [Google Scholar]
- Varga P. & Zysset P. K. Sampling sphere orientation distribution: an efficient method to quantify trabecular bone fabric on grayscale images. Med. Image Anal. 13, 530–541 (2009). [DOI] [PubMed] [Google Scholar]
- Jensen T. H. et al. Directional X-ray dark-field imaging. Phys. Med. Biol. 55, 3317–3323 (2010). [DOI] [PubMed] [Google Scholar]
- Revol V., Kottler C., Kaufmann R., Neels A. & Dommann A. Orientation-selective X-ray dark field imaging of ordered systems. J. App. Phys. 112, 114903 (2012). [Google Scholar]
- Malecki A. et al. Coherent Superposition in Grating-Based Directional Dark-Field Imaging. PLoS ONE 8 (2013). [DOI] [PMC free article] [PubMed] [Google Scholar]
- Lynch S. K. et al. Interpretation of dark-field contrast and particle-size selectivity in grating interferometers. Appl. Opt. 50, 4310–4319 (2011). [DOI] [PMC free article] [PubMed] [Google Scholar]
- Laib A. & Rüegsegger P. Calibration of trabecular bone structure measurements of in vivo three-dimensional peripheral quantitative computed tomography with 28-μm-resolution microcomputed tomography. Bone 24, 35–39 (1999). [DOI] [PubMed] [Google Scholar]
- Pande S., Singh Bhadouria V. & Ghoshal D. A Study on Edge Marking Scheme of Various Standard Edge Detectors. IJCA 44, 33–37 (2012). [Google Scholar]


