

Abstract
Hypertension is a clinical syndrome characterized by increased arterial tone. Although the mechanisms are varied, the generally accepted view is that increased CaV1.2 channel function is a common feature of this pathological condition. Here, we investigated the mechanisms underlying vascular dysfunction in a mouse model of genetic hypertension. Contrary to expectation, we found that whole-cell CaV1.2 currents (ICa) were lower in hypertensive (BPH line) than normotensive (BPN line) myocytes. However, local CaV1.2 sparklet activity was higher in BPH cells, suggesting that the relatively low ICa in these cells was produced by a few hyperactive CaV1.2 channels. Furthermore, our data suggest that while the lower expression of the pore-forming α1c subunit of CaV1.2 currents underlies the lower ICa in BPH myocytes, the increased sparklet activity was due to a different composition in the auxiliary subunits of the CaV1.2 complexes. ICa currents in BPN cells were produced by channels composed of α1c/α2δ/β3 subunits, while in BPH myocytes currents were probably generated by the opening of channels formed by α1c/α2δ/β2 subunits. In addition, Ca2+ sparks evoked large conductance, Ca2+-activated K+ (BK) currents of lower magnitude in BPH than in BPN myocytes, because BK channels were less sensitive to Ca2+. Our data are consistent with a model in which a decrease in the global number of CaV1.2 currents coexist with the existence of a subpopulation of highly active channels that dominate the resting Ca2+ influx. The decrease in BK channel activity makes the hyperpolarizing brake ineffective and leads BPH myocytes to a more contracted resting state.
Key points
A hallmark of essential hypertension is an anomalous vascular tone due to the increase in intracellular Ca2+ ([Ca2+]i) and/or Ca2+ sensitivity in vascular smooth muscle. Down-regulation of K+ channels together with increased CaV1.2 channel function has been proposed as one pathogenic mechanism.
Using a mouse model of essential hypertension (BPH line), we found a decrease in the global smooth muscle Ca2+ influx due to fewer CaV1.2 channels. However, these CaV1.2 channels are hyperactive, allowing a larger local Ca2+ influx at rest that triggers an increased Ca2+ release from intracellular stores (sparks).
Large conductance, Ca2+-activated K+ (BK) channels of BPH myocytes show reduced Ca2+ sensitivity, so that its activation by the increased [Ca2+]i is impaired.
Our results suggest that changes in the molecular composition of both CaV1.2 and BK channels could explain vascular dysfunction during hypertension in BPH mice.
Introduction
Arterial myocytes contract in response to increases in intravascular pressure. The cellular and molecular mechanisms of this myogenic response, in particular the identity of the mechanosensor and the transduction pathway leading to changes in vessel diameter, remain poorly understood. Candidates to initiate the myogenic response include non-selective cation channels such as TRPC6 and TRPM4 (Welsh et al. 2002; Earley et al. 2004; Spassova et al. 2006), G-protein coupled receptors (Schnitzler et al. 2008; Kauffenstein et al. 2012) and activation of several integrins (Martinez-Lemus et al. 2005). However, regardless of the molecular nature of the sensor/transducer, vascular smooth muscle cell (VSMC) depolarization and a rise in intracellular calcium are well established as cornerstones of the myogenic response. Membrane depolarization activates sarcolemmal voltage-gated CaV1.2 channels, allowing a local elevation in intracellular Ca2+ ([Ca2+]i) (Harder et al. 1987; Fleischmann et al. 1994; Rubart et al. 1996; Jaggar et al. 1998). The influx of Ca2+ via a single CaV1.2 channel or channel cluster can be optically detected in the form of a ‘CaV1.2 sparklet’ (Navedo et al. 2005; Amberg et al. 2007). The simultaneous activation of multiple CaV1.2 sparklets induces a cell-wide increase in [Ca2+]i that activates myosin light chain kinase and thus triggers contraction. The actions of the stretch activated channels and CaV1.2 channels on arterial myocyte membrane potential and [Ca2+]i are opposed by three types of K+ channels: the large conductance, Ca2+-activated K+ (BK) channels, inwardly rectifying K+ (Kir) channels and voltage-gated K+ (Kv) channels (Nelson & Quayle, 1995; Jackson, 2000; Moreno-Dominguez et al. 2009; Tajada et al. 2012). BK currents are activated by Ca2+ sparks caused by the opening of a small cluster of ryanodine receptors (RyRs) located in the sarcoplasmic reticulum (SR). Activation of BK, Kv and Kir channels hyperpolarizes smooth muscle, which decreases CaV1.2 channel activity, Ca2+ influx and [Ca2+]i, and thus causes relaxation.
Essential hypertension involves a gradual, sustained increase in total peripheral resistance caused by an increased vascular tone. The mechanisms underlying this pathological change in vascular function have been the subject of intense investigation. The generally accepted view is that down-regulation of KV and KIR channels and up-regulation of CaV1.2 channels are early events in the development of vascular dysfunction during hypertension (Martens & Gelband, 1996; Cox et al. 2001; Weston et al. 2010; Tajada et al. 2012). On the basis of these data a model has been proposed in which decreased K+ channel function depolarizes arterial smooth muscle. The combination of membrane depolarization and higher CaV1.2 channel expression conspires to generate pathologically high levels of CaV1.2 activity and consequently Ca2+ influx, [Ca2+]i, contraction and vasoconstriction. This chain of events culminates in a Ca2+-dependent increase in peripheral vascular resistance that contributes to the development of hypertension (Lozinskaya & Cox, 1997; Pesic et al. 2004).
In this study, we tested this model using a mouse model of genetic hypertension. These mice were obtained by phenotypic selection from natural variants. Starting from a mixture of an eight-way cross of unrelated, inbred normotensive mice, three inbred lines of mice with low (BPL/1J), high (BPH/2J) and normal (BPN/3J) blood pressure were developed, and maintained with inbreeding (Schlager & Sides, 1997). Here we use BPH mice (for blood pressure high) and their normotensive controls (BPN). We tested the hypothesis that this increased vascular reactivity is caused by changes in the molecular composition and function of CaV1.2 and BK channels in arterial myocytes. Consistent with this hypothesis, we found that whole-cell CaV1.2 currents (ICa) in BPN cells were produced by channels composed of α1c/α2δ/β3 subunits, while in BPH myocytes currents were probably generated by the opening of channels formed by α1c/α2δ/β2 subunits. Similarly, expression of the accessory β1 subunit of BK channels is lower in BPH than in BPN myocytes. These changes have important functional consequences. In BPH myocytes, a small number of CaV1.2 channels account for the majority of Ca2+ influx into these cells. Thus, although spatially averaged Ca2+ influx via CaV1.2 channels is lower, local Ca2+ sparklet activity is higher in BPH than in BPN myocytes. Furthermore, loss of the BKβ1 subunit in BPH myocytes rendered BK channels incapable of responding to the large Ca2+ sparks produced in these cells. This leads to increased vascular tone. Our data support a new model in which increases in local Ca2+ signals resulting from alterations in the molecular composition of CaV1.2 and BK channels cause vascular dysfunction during hypertension.
Methods
Isolation of vascular smooth muscle cells
Colonies of BPN and BPH mice (Jackson Laboratories, Bar Harbor, ME, USA) were housed in the animal facility of the School of Medicine of Valladolid, under temperature-controlled conditions (21°C) and with unlimited access to water and food. All animal protocols were approved by the Institutional Care and Use Committee of the University of Valladolid, and are in accordance with the European Community guiding principles in the care and use of animals.
Mice under isofluorane anaesthesia (5% at 2.5 l min−1 O2) were killed by decapitation. We dissociated VSMCs from mesenteric arteries as previously described (Moreno-Dominguez et al. 2009). Briefly, the protocol uses a smooth muscle dissociation solution (SMDS) with the following constituents (in mm): NaCl, 145; KCl, 4.2; KH2PO4, 0.6; MgCl2, 1.2; Hepes, 10; glucose, 11; pH 7.4 (adjusted with NaOH). Segments of third-order mesenteric arteries were carefully dissected out of BPH and BPN mice and cleaned from adipose, connective and endothelial tissues. Arteries were either frozen (−80°C) for ulterior RNA extraction or kept in ice-cold SMDS and cut into small segments. These segments were then placed in SMDS to which 0.4–0.6 mg ml−1 papain (Worthington, Lakewood, NJ, USA), 1 mg ml−1 bovine serum albumin (BSA; Sigma, St Louis, MO, USA) and 1 mg ml−1 1,4-dithioerythritol (DTE; Sigma) had been added and incubated in it for 9–15 min at 37°C. This was followed by a second 12–16 min incubation in SMDS with 10 μm Ca2+, 0.4–0.8 mg ml−1 collagenase F (Sigma) and 1 mg ml−1 BSA. After rinsing the arteries twice with SMDS (10 μm Ca2+), single cells were obtained by gentle trituration with a wide-bore glass pipette. Cells were maintained at 4°C until used, typically 1–6 h after isolation.
Real-time PCR and Western blot analysis
RNA was extracted from approximately 30–40 second- and third-order mesenteric arteries obtained from 5–6 mice. After careful dissection and cleaning of adipose and connective tissues, endothelium was removed by perfusing the arterial lumen for 10 min with a 0.1% Triton X-100 solution at a pressure of 80 mmHg. Arteries were then opened longitudinally and the inner surface of the arteries was scraped manually with a plastic, 20 μl pipette tip. This minimized the possible contamination of VSMCs with other cell types, as previously demonstrated (Cidad et al. 2010). After endothelium removal, arteries were homogenized in a Precellys 24 homogenizator (Bertin Tecnologies, Montigny-le-Bretonneux, France) using ceramic beads (CK 14). Total RNA was isolated using the TRIzol reagent as per the manufacturer's instructions (Invitrogen, Life Technologies, Carlsbad, CA, USA). After DNAse I (Ambion, Austin, TX, USA) treatment, 500–750 ng of RNA was reverse transcribed with MuLvRT (2.5 u μl−1) in the presence of 1 u μl−1 RNAse inhibitor, 2.5 μm random hexamers, 1× PCR buffer, 5 mm MgCl2 and 4 mm mixed dNTPs at 42°C for 60 min, to get cDNA (RT+). All reagents were from Applied Biosystems. Real-time PCR was performed with inventoried TaqMan® expression assays (Applied Biosystems, Foster City, CA, USA) using either a Rotor-Gene RG 3000 (Corbett Life Science, Qiagen, Valencia, CA, USA) thermocycler (for α and β1 subunits of BK) or TaqMan Low Density Arrays and an ABI Prism 7900HT sequence detection system (Applied Biosystems) at the Parque Científico de Madrid (Madrid, Spain). Data were analysed using the threshold cycle (Ct) relative quantification method (ΔΔCt) (Livak & Schmittgen, 2001). Expression data of genes were normalized to the level of ribosomal RNA 18S or GADPH transcript. The relative abundance of the genes was calculated from 2(−ΔCt), where ΔCt=Cttranscript of interest−Ct18S or GADPH. Differences between hypertensive and normotensive VSMCs were calculated from 2(−ΔΔCt), where ΔΔCt=ΔCt(BPH)–ΔCt(BPN). For Western blot analysis, protein extraction was performed using a previously described method (Johnson et al. 2009) using 40 arteries from 3–4 animals. Immunoblots were performed as described elsewhere (Tajada et al. 2012) using CaV1.2 (75-053, 1:1000; Neuromab, Davis, CA, Biotechnology Inc., USA), α2δ (SC-271697, 1:500; Santa Cruz, CA, USA) or β2 (SC81890, 1:200; Santa Cruz) antibodies. Data for 3–5 experiments using different samples were quantified with densitometric analysis of the bands (Quantity-One software, Bio-Rad, Hercules, CA, USA) using β-actin as loading control.
Electrophysiological methods
Whole-cell calcium currents were recorded at room temperature in isolated myocytes (or in transfected HEK cells) using the whole cell patch clamp configuration. Inward Ba2+ currents were evoked by stepwise depolarizing pulses in 10 mV intervals between −70 mV and +70 mV from a holding potential of −80 mV. Glass coverslips with HEK transfected cells were placed at the bottom of a small recording chamber (0.2 ml) on the stage of an inverted microscope and perfused by gravity with the bath solution, while freshly isolated VSMCs were placed directly on the recording chamber and left to settle for a few minutes before starting superfusion with the external solution. Patch pipettes were made from borosilicate glass (2.0 mm O.D.; World Precision Instruments, Sarasota, FL, USA) and double pulled with the P-97 automatic puller (Sutter Instruments, Novato, CA, USA) to resistances ranging from 2 to 4 MΩ for HEK cells and from 4 to 8 MΩ for VSMCs when filled with the internal solution, containing (mm): 130 CsCl, 2 MgCl2, 10 Hepes, 10 EGTA, 2 Na2-GTP and 2 Mg-ATP (pH 7.2 with CsOH). For perforated patch recordings, pipette tips were dipped in a solution containing (mm): 40 CsCl, 95 caesium aspartate, 8 CaCl2, 10 Hepes (pH 7.2 with CsOH), and backfilled with the same solution containing 300 μg ml−1 amphotericin B. The composition of the bath solution was (mm): 140 NaCl, 4.7 KCl, 10 BaCl2, 10 Hepes and 10 glucose (pH 7.4 with NaOH).
Whole-cell currents were recorded using an Axopatch 200 patch-clamp amplifier, filtered at 2 kHz (−3 dB, four-pole Bessel filter), and sampled at 10 kHz. Recordings were digitized with a Digidata 1322A interface, driven by CLAMPEX 10 software (Axon Instruments, Molecular Devices, Sunnyvale, CA, USA).
Spontaneous BK currents were measured using the whole-cell patch clamp technique in the amphotericin B (300 μg ml−1) perforated patch configuration with the gap-free acquisition mode at −40 mV. Cells were continuously superfused with BK external solution containing (mm): 130 NaCl, 5 KCl, 1 MgCl2, 2 CaCl2, 10 Hepes and 10 glucose (pH 7.4 with NaOH). We analysed BK currents with an amplitude ≥6 pA, which based on the unitary current of BK channels at −40 mV (≈2 pA) (Nelson et al. 1995), requires the simultaneous opening of at least three BK channels. The composition of the internal solution was (in mm): 10 NaCl, 110 potassium aspartate, 30 KCl, 1 MgCl2, 10 Hepes and 0.5 EGTA (pH 7.3 with KOH).
Inside-out recordings of BK single channel currents were carried out with a pipette solution containing (in mm): 125 KCl, 5 EGTA and 10 Hepes (pH 7.2 with KOH). After patch excision, the bath solution was switched to a solution of identical composition to that of the pipette but containing different amounts of CaCl2 to get a free [Ca2+] of 1, 5.5 or 10 μm. To obtain 100 μm free Ca2+, HEDTA instead of EGTA was used as Ca2+ buffer. Total Ca2+ was calculated using the Maxchelator software (C. Patton, Stanford University). Titrated stock solutions of CaCl2 and EGTA (HEDTA) were used to minimize errors due to impurities of EGTA (HEDTA) and hydration of CaCl2. Single channel analysis was performed with PCLAMP software. Single-channel amplitudes and open probabilities were measured from amplitude histograms generated with FETCHAN. Open probabilities were expressed as NPo, where N represents the number of single channels present in the patch, and Po is the open probability of a single channel. The number of BK channels per patch was estimated from patches held at +80 mV in the presence of 100 μm Ca2+, which maximizes the open probability (Po) of these channels.
Imaging of Ca2+ sparklets and sparks
Ca2+ sparklet images were acquired using a through-the-lens total internal reflectance fluorescence (TIRF) microscope built around an inverted Olympus IX-71 microscope equipped with an Olympus PlanApo TIRF (60×, NA = 1.49) oil immersion lens and an Andor iXON 597 EMCCD camera. Images were acquired at 100 Hz using TILL Image software. Cells were continuously superfused with a solution with the following constituents (in mm): 140 NaCl, 5 KCl, 1 MgCl2, 10 glucose and 10 Hepes, adjusted to pH 7.4. During experiments, this solution was exchanged for a solution containing a similar composition, except that KCl was substituted for CsCl, NaCl was substituted by N-methyl-d-glucamine (NMDG), CaCl2 was 20 mm and 1 μmol l−1 thapsigargin was added to eliminate Ca2+ release from intracellular stores. To monitor [Ca2+]i, cells were patch-clamped under the whole-cell configuration using pipettes filled with a solution composed of (in mm): 87 caesium aspartate, 20 CsCl, 1 MgCl2, 5 MgATP, 10 EGTA, 10 Hepes and 0.2 fluo-5F (F14221; Invitrogen) adjusted to pH 7.2 with CsOH. Excitation of fluo-5F was achieved with a 488 nm solid state argon laser. Excitation and emission light was separated with the appropriate set of filters (Navedo et al. 2005).
Background-subtracted fluorescence signals were converted to concentration units using the ‘Fmax’ equation (Maravall et al. 2000):
where F is fluorescence, Fmax is the fluorescence intensity of fluo-5F in the presence of a saturating free Ca2+ concentration, Kd is the dissociation constant of the fluorescence indicator used (1280 nmol l−1) and Rf is the ratio of Fmax to the fluorescence intensity of fluo-5F in a solution where the Ca2+ concentration is nominally 0 (Fmin). Kd and Rf values for fluo-5F were determined in vitro. Fmax was determined at the end of experiments by exposing cells to a solution to which the Ca2+ ionophore ionomycin (10 μm) and 20 mm external Ca2+ had been added.
Ca2+ sparklets were detected and analysed as previously described (Navedo et al. 2005). Briefly, Ca2+ sparklets had an amplitude equal to or larger than the mean basal [Ca2+]i plus 2.5 times its standard deviation. For a [Ca2+]i elevation to be considered a sparklet, a grid of 3 × 3 contiguous pixels had a [Ca2+]i value at or above the amplitude threshold. These detection criteria for Ca2+ sparklets are similar to those used by other investigators (Cheng et al. 1999; Demuro & Parker, 2004; Navedo et al. 2005). Analogous to single-channel data analysis, the activity of Ca2+ sparklets is determined by calculating the ‘nPs’ of each sparklet site, where n is the number of quantal levels and Ps is the probability that a quantal Ca2+ sparklet event is active.
Imaging of Ca2+ sparks was performed on cells loaded with the fluorescent Ca2+ indicator fluo-4-AM (F14201; Invitrogen). VSMCs were loaded with 3 μm fluo 4-AM for 15 min at room temperature in the perfusion chamber. Fluorescence was recorded using a livescan swept field confocal system (Nikon) coupled to a Nikon TE300 inverted microscope equipped with a Nikon 60× water immersion lens (NA = 1.4; Nikon, Melville, NY, USA). Ca2+ sparks were imaged using the line-scan mode of the confocal microscope. Images were analysed using custom software written in IDL language (Research Systems, Boulder, CO, USA). Ca2+ sparks were identified using a computer algorithm similar to that used in sparklets records. Images were normalized by dividing the fluorescence intensity of each pixel (F) by the average resting fluorescence intensity (F0) of a confocal image to generate an F/F0 image.
Culture and transfection of HEK293 cells
HEK293 cells were maintained in Dulbeco's modified Eagle's medium (DMEM) supplemented with 10% fetal bovine serum (Gibco, Paisley, UK), 100 U ml−1 penicillin, 100 μg ml−1 streptomycin, 0.25 μg ml−1 amphotericin B and 2 mm l-glutamine. Cells were grown as a monolayer to confluences up to 80% in a 35 mm Petri dish prior to transfection. Transient transfections were performed using lipofectamine 2000 (Invitrogen) according to the manufacturer's instructions. Cells were transfected with plasmids encoding CaV1.2 (1 μg), green fluorescent protein (GFP, 0.2 μg), and α2δ-1, β2 or β3 subunits (molar ratio Cav1.2/α2δ-1/βx 1:2:2). CaV1.2, α2δ-1, β2 and β3 plasmids were provided by Dr A. Castellano (Instituto de Biomedicina de Sevilla, IBIS, Universidad de Sevilla, Spain).
Results
Higher CaV1.2 sparklet activity and density in BPH than in BPN myocytes
We used TIRF microscopy to image CaV1.2 sparklets in BPN and BPN arterial myocytes. Figure 1A shows TIRF images and the time course of [Ca2+]i in several sites within two representative myocytes. Upward deflections in the [Ca2+]i records indicate Ca2+ influx events in these sites. CaV1.2 sparklet density was approximately 1.6-fold higher in BPH than in BPN myocytes (Fig. 1B). Amplitude histograms of CaV1.2 sparklets in BPN and BPH cells are shown in Fig. 1C. The data were fit with the sum of six (BPN) or seven (BPH) Gaussian functions. The quantal unit of Ca2+ influx was 40 nm for BPN and BPH CaV1.2 sparklets, suggesting that the amplitude of the elementary event was similar in normotensive and hypertensive cells. Note, however, that the frequency of multiquantal events was higher in BPH than in BPN cells, suggesting a higher probability of coincidental CaV1.2 channel openings in BPH than in BPN cells. The distribution of CaV1.2 sparklet activity (nPs) was bimodal (Fig. 1D). The mean nPs values for the low activity sites were similar in BPN and BPH myocytes (0.063 ± 0.015 and 0.079 ± 0.012, respectively). However, high activity sites had nPs values of 0.47 ± 0.07 in BPN and 0.93 ± 0.11 in BPH cells (P < 0.02). CaV1.2 sparklet duration followed a double exponential distribution (Fig. 1E). The time constants of the exponential fits were longer for BPH (24 ± 2.7 and 168 ± 13 ms) than for BPN sparklets (14 ± 4.2 and 94 ± 10 ms).
Figure 1. Characterization of calcium sparklets in BPN and BPH myocytes.
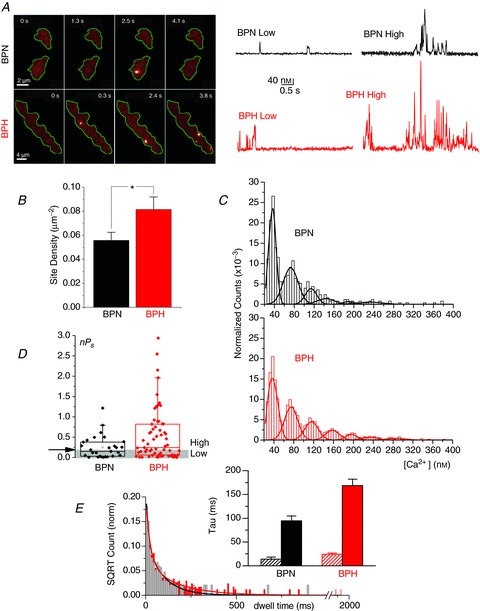
A, representative image sequences from BPN and BPH myocytes loaded with fluo-5F (200 μm) showing Ca2+ sparklets. Right, representative [Ca2+]i traces of sparklet amplitudes showing low and high open probability sites. B, bar plot of the mean ± SEM of the Ca2+ sparklet site density. BPH (n= 31), BPN (n= 22) from 6 to 12 animals. Through all the figures, *P < 0.05, **P < 0.01, ***P < 0.001. C, all-points histograms generated from Ca2+ sparklets obtained from BPN (n= 22) and BPH (n= 31) records. Data were fitted with a multicomponent Gaussian function with a quantal unit elevation of 38 nm both in BPN and in BPH. D, box plot showing summarized data of the open probability (nPs) of Ca2+ sparklets from BPN (n= 28 cells) and BPH (n= 64 cells) from 8–11 mice. Ca2+ sparklet sites were grouped in low open probability (0 < nPs < 0.2) and high open probability (nPs > 0.2). See A. E, dwell time histograms showing the open time distribution of Ca2+ sparklets from BPN and BPH myocytes (n= 22 and 31 cells, respectively, from 6–12 animals). Data were fitted by the sum of two exponential functions (BPN in black and BPH in red). The inset shows the values of the time constants of the two exponential components with the confidence interval of the fit.
Together, these CaV1.2 sparklet data suggest that local Ca2+ influx activity is higher in BPH than in BPN myocytes. This is due to higher CaV1.2 sparklet density and activity due to a higher frequency of longer CaV1.2 sparklet events in BPH than in BPN myocytes.
Lower ICa in BPH than in BPN myocytes
A testable prediction of the local CaV1.2 sparklet data above is that CaV1.2 currents (ICa) are larger in BPH than in BPN myocytes. To do this, we used the patch-clamp technique in its whole-cell configuration. CaV1.2 currents were evoked by a 50 ms voltage step from the holding potential of −80 mV to potentials ranging from −70 to +70 mV using 10 mm Ba2+ as the charge carrier. The average I–V relationships obtained from 60 BPN and 47 BPH myocytes are shown in Fig. 2A. Records from representative BPN and BPH myocytes are also shown in the figure. Surprisingly, we found that ICa was larger in BPN than in BPH cells (at +10 mV, BPN = 10.27 ± 0.58 pA pF−1vs. BPH = 5.83 ± 0.37 pA pF−1). This difference was also apparent when whole currents were recorded under the perforated patch configuration (at +10 mV, BPN = 4.96 ± 0.52 pA pF−1vs. BPH = 2.50 ± 0.28 pA pF−1). The currents evoked by this protocol were blocked in the same proportion in BPN and BPH myocytes with nifedipine (1 μm), confirming that they were produced by CaV1.2 channels and suggesting that differences in current density can be explained by differences in CaV1.2 channel activity (Fig. 2B).
Figure 2. Differences in Cav1.2 currents between BPN and BPH VSMCs.
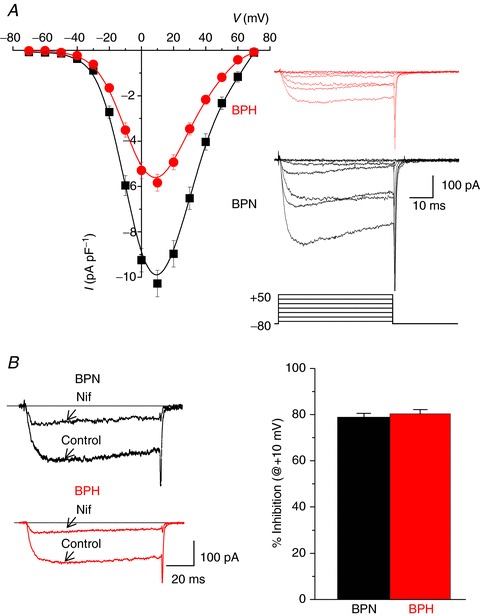
A, mean current density–voltage relationships obtained in BPH (n= 60) and BPN (n= 47) myocytes from 15 to 25 mice using 10 mm Ba2+ as charge carrier. Data are mean ± SEM. The inset shows representative traces of currents elicited by 50 ms depolarizing pulses from −70 to +50 mV in 20 mV steps. B, representative currents from BPN and BPH myocytes elicited by depolarizing pulses to +10 mV recorded in control conditions and in the presence of 1 μm nifedipine in the bath solution. The fraction of nifedipine-sensitive current at +10 mV was not different between both strains, as depicted in the bars plot, representing the mean ± SEM of 22 BPN cells and 20 BPH cells, from 12–15 mice.
In combination with the CaV1.2 sparklet data above, these ICa data suggest that while the local Ca2+ influx activity at a specific site is higher in BPH than in BPN myocytes, the spatially averaged Ca2+ flux is lower in the hypertensive than in the normotensive cells.
The CaV1.2 channel activator BayK increases but does not equalize ICa in BPH than in BPN myocytes
Classical biophysics state that the whole-cell Ca2+ current is defined by the following equation:
where N is the number of functional channels, Po is the open probability and iCa is the amplitude of the current produced by the opening of a single CaV1.2 channel. Our sparklet data suggest that iCa is similar in BPN and BPH myocytes (Fig. 1C). Thus, we tested the hypothesis that N is higher in BPN than in BPH myocytes. The dihydropyridine BayK is a selective activator of CaV1.2 channels in VSMCs (Moosmang et al. 2003) that increases its Po to ≈ 1. Thus, if BPN and BPH cells have similar N, then BayK should equalize ICa in these cells.
Figure 3A shows average I–V relationships obtained before and after the application of BayK in BPN and BPH cells. A set of representative ICa records is also shown in the figure. Although BayK increased the amplitude of the ICa evoked by depolarization in BPN and BPH cells, it did not equalize the amplitude of the current in these cells (at −10 mV, BPN = 15.55 ± 1.21 pA pF−1vs. BPH = 11.00 ± 1.17 pA pF−1). Similarly, we found that ‘tail’ICa values were larger in BPN than in BPH at most voltages examined under control conditions and in the presence of BayK (Fig. 3B). The voltage dependence of tail currents reflects the voltage dependence of Po. As expected, BayK shifted the curve to the left, and this effect was similar in BPN and BPH myocytes. However, the increase in maximal current was significantly larger in BPH myocytes (5.72 ± 0.65-fold in BPH vs. 3.51 ± 0.50-fold in BPN, Fig. 3B).
Figure 3. Effects of BayK on CaV1.2 currents from BPN and BPH VSMCs.
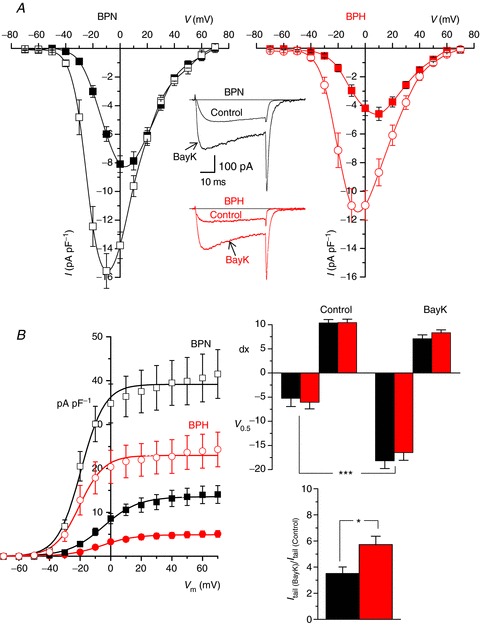
A, mean current density–voltage relationships obtained from BPN and BPH myocytes in control conditions (filled symbols) and in the presence of 5 μm BayK (open symbols). Each point is the mean ± SEM of 20 cells in each group from 14–16 animals. Representative traces recorded at a pulse potential of 0 mV from one BPN and one BPH VSMC before and after BayK application are also shown. B, tail current density to voltage relationships for BPN and BPH cells in control conditions (filled symbols) and in the presence of BayK was obtained from the same cells as in A. Tail currents were obtained upon repolarization to −80 mV after stepping to the indicated voltages. Solid lines represent the data fit to Boltzmann functions. Bar plots on the right show the mean ± SEM of the fit parameters obtained from each individual cell in control conditions and in the presence of BayK (V0.5 is the voltage for half activation and dx is the slope factor of the Boltzmann function). The lower bar plot represents the effect of BayK expressed as the fold increase of the maximal tail current amplitude at +70 for BPN (black bar) and BPH cells (red bar).
These ICa data are consistent with the hypothesis that the number of functional CaV1.2 channels (i.e. N) is higher in BPN than in BPH myocytes, which contributes to larger ICa in normotensive than in hypertensive cells.
Larger Ca2+ sparks but lower BK currents in BPH than in BPN myocytes
Having detected major differences in local and global Ca2+ signalling between BPH and BPN myocytes, we investigated whether these differences were associated with changes in Ca2+ release from the SR of these cells. CaV1.2 channels regulate SR Ca2+ release, but only indirectly by controlling SR Ca2+ load. Higher Ca2+ influx increases SR Ca2+ load, which translates into higher Ca2+ spark activity. Thus, if Ca2+ spark activity is regulated by local CaV1.2 sparklet activity, our expectation was that Ca2+ spark activity should be higher in BPH than in BPN myocytes. Alternatively, if Ca2+ spark activity is not regulated locally, but rather by the magnitude of ICa, then Ca2+ spark activity should be higher in BPN than in BPH myocytes. Accordingly, differences in Ca2+ spark activity should translate into differences in BK activity in BPN and BPH myocytes.
To test these hypotheses, we recorded Ca2+ sparks and BK currents from these cells. In Fig. 4A, we show two confocal images of representative BPN and BPH myocytes. The time course of [Ca2+]i of two Ca2+ sparks in each cell are shown to the right of each image. Ca2+ spark amplitude was larger in BPH (453 ± 12.8 nm) than in BPN (261 ± 8.4 nm) myocytes (Fig. 4B). However, spontaneous transient outward currents (STOCs) elicited by the activation of BK channels were smaller in BPH myocytes (Fig. 4C). BK current amplitude was 10.55 ± 0.36 pA in BPH and 13.60 ± 0.43 pA in BPN myocytes (Fig. 4D). These findings are consistent with the view that high local CaV1.2 sparklet activity in BPH myocytes translates into larger Ca2+ spark amplitude in these cells. Furthermore, these data suggest that local Ca2+ influx is a major determinant of SR Ca2+ release in arterial smooth muscle. However, the larger Ca2+ sparks seem to be uncoupled from BK channel activation in BPH cells.
Figure 4. Calcium sparks and BK activity in BPN and BPH myocytes.
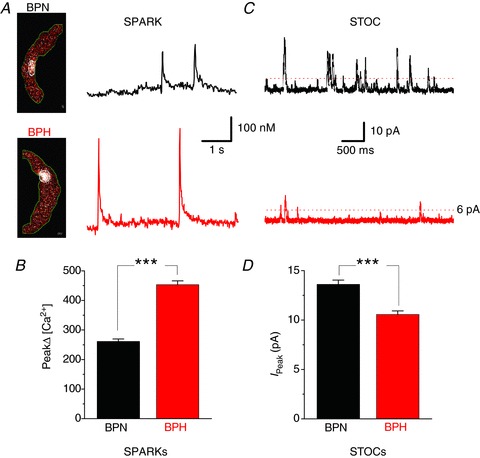
A, representative confocal images of Ca2+ sparks from BPN and BPH myocytes. The traces to the right show the time course of [Ca2+]i in the regions of the images delimited by the white circle located in the middle of each image. B, bar plot summarizing mean ± SEM of Ca2+ sparks, obtained from BPN (n= 25 myocytes) and BPH (n= 27 myocytes from 6–8 mice). C, representative recordings of spontaneous whole-cell BK currents (STOCs) from BPN (black) and BPH (red) myocytes obtained with the amphotericin-perforated patch configuration at a holding potential of −40 mV. Only BK currents with an amplitude ≥6 pA were analysed. D, mean ± SEM BK currents peak amplitudes obtained from five cells in each group from three animals.
The Ca2+ sensitivity of BK channels is lower in BPH than in BPN myocytes
Potential mechanisms for lower BK current amplitude in BPH myocytes, in spite of larger Ca2+ sparks, include a reduced number of BK channels in BPH cells, a lower Ca2+ sensitivity of these channels in BPH than in BPN myocytes or a combination of these two mechanisms. To test these hypotheses, we recorded BK channel currents from inside–out patches at various voltages and Ca2+ concentrations on the cytosolic side of the channels. An example of BK channel currents recorded at +40 mV from patches excised from BPN and BPH myocytes at several Ca2+ concentrations (1, 5.5, 10 and 100 μm) is shown in Fig. 5A. The activity (NPo) of BK channels in these patches over a wider range of potentials is illustrated in Fig. 5B. Average data of half activation voltages obtained in membrane patches from BPN and BPH cells at the Ca2+ concentrations tested are shown in Fig. 5C. The inset shows also maximal NPo values (100 μm Ca2+, +80 mV). These data indicate that BPN myocytes have both a higher BK channel density and a higher Ca2+ sensitivity than BPH myocytes, and are consistent with the observation of a decrease of BK α and β1 subunit mRNA expression in BPH myocyes (Fig. 5D).
Figure 5. Characterization of BK channel calcium sensitivity in isolated patched from BPN and BPH myocytes.
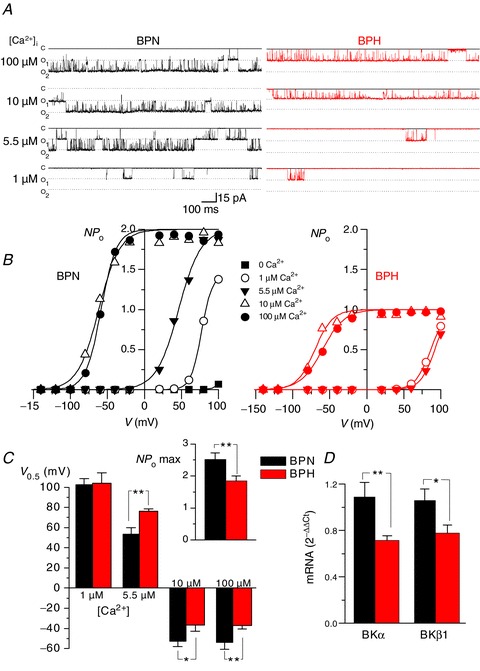
A, Ca2+ sensitivity of BK channels in inside-out patches (Holding Potential =+40 mV) from BPN (left) and BPH (right) myocytes. The figure shows representative records in the presence of different Ca2+ concentrations in the bath solution (100, 10, 5.5 and 1 μm). B, curves of channel open probability (NPo) obtained at all the different Ca2+ concentrations as a function of membrane potential were obtained from the same patches depicted in A. Solid lines represent the fit of the data to a Boltzmann function. C, the bar plot represents the mean ± SEM values of the voltage of half-maximal activation (V0.5) for BK channels at 1, 5.5, 10 and 100 μm Ca2+ as indicated. Data were obtained from the fit of the NPoversus voltage curves from six BPN and six BPH patches obtained from 5–8 different mice in each group. The inset on the right shows the mean ± SEM of the number of BK channels per patch in BPN (n= 33) and BPH (n= 31) cells, estimated from the channel count at the highest calcium concentration (maximal open probability). D, expression of mRNA for both α and β1 subunits of BK channels was obtained with real-time PCR experiments in extracts from BPN and BPH mesenteric myocytes. The levels of expression were corrected for expression of the housekeeping gene RP18S and normalized to the values in the BPN sample, which was used as calibrator. Data are mean ± SEM of triplicate determinations in four independent samples.
Together with the Ca2+ spark data, these data suggest that smaller STOCs in BPH than in BPN cells are due to a decrease in Ca2+ sensitivity of BK channels during the development of hypertension. The decrease in Ca2+ sensitivity in hypertensive cells is such that even larger Ca2+ sparks cannot compensate for the decrease in Ca2+ sensitivity.
Changes in the molecular composition of CaV1.2 channels during the development of hypertension
We examined whether differences in CaV1.2 channel activity between BPH and BPN myocytes were due to changes in the expression of accessory subunits using a multipronged strategy involving pharmacological, electrophysiological and biochemical approaches. Gabapentin (GBP) is a drug that binds to the α2δ subunit of CaV1.2 channels (Davies et al. 2007). Since elevation in the expression of the α2δ-1 subunit has been reported during hypertension (Bannister et al. 2012), we investigated the effects of GBP on ICa in BPN and BPH myocytes.
Application of 100 μm GBP induced an increase in ICa (Fig. 6A), both in BPN and in BPH myocytes, although the effect was much larger in BPH cells. The actions of GBP on ICa were voltage independent (data not shown), reversible and reproducible. As a control, we examined the effects of the reducing agent dithiothreitol (DTT, 2 mm), which cleaves the disulphide bridge that binds the α2 and the δ subunits, eliminating the binding site of GBP (Marais et al. 2001; Fig. 6B). Note that after the application of DTT, GBP fails to increase ICa, suggesting that GBP is acting on α2δ. We explored in detail the different response to GBP in BPN and BPH myocytes by characterizing the GBP concentration–ICa response curves (Fig. 6C, left panel). While the relationship between GBP and ICa was bell-shaped in BPN cells, in BPH myocytes it was sigmoidal. To determine whether the different GBP response could reflect a different composition of auxiliary subunits in the Cav1.2 channel complex, similar experiments were performed in HEK cells transfected with different combinations of Cav1.2 auxiliary subunits (Fig. 6C, right panel). HEK cells expressing the α1C or α1C and β2 subunits of the channel did not respond to GBP, suggesting that the actions of the drug are not directly on these subunits of the channel. Rather, GBP increased ICa only in cells expressing α1C and α2δ-1. However, as in BPN and BPH myocytes, the concentration–response curves for cells expressing α1C/α2δ-1/β2 or α1C/α2δ-1/β3 were significantly different. The concentration–response curve of cells expressing β3 and β2 were bell-shaped and sigmoidal, respectively. These data suggest that the differences in the response to GBP between BPN and BPH mice can be due to a different proportion of β2 subunits, and they are consistent with the view that the dominant molecular combination giving rise to BPH ICa is α1C/α2δ/β2 subunits, while in BPN these currents are produced by channels formed of α1C/α2δ/β3 or α1C/α2δ subunits.
Figure 6. Effect of GBP on CaV 1.2 currents from BPN and BPH myocytes and from HEK transfected cells.
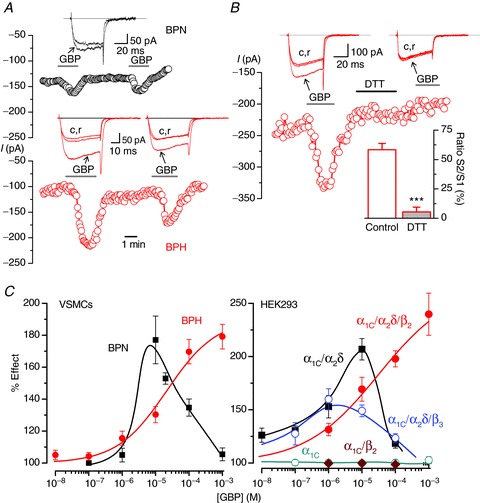
A, time course of peak current amplitude recorded in 0 mV pulses applied at 0.2 Hz in a BPN (black symbols) and a BPH (red) myocyte. GBP at 100 μm was present as indicated. Representative traces in each condition are shown in the insets. B, effects of 2 mm DTT on the GBP response. An experiment similar to those shown in A is represented in the figure. DTT was applied to the bath during the indicated time. The bar plot in the inset shows the average effect (mean ± SEM) obtained in seven cells (from three BPN and three BPH mice) and expressed as the amplitude of the second GBP application (S2) normalized to the first one (S1) in cells when control or DTT was applied between both stimulations. C, left, concentration–response relationship for the effect of GBP on the amplitude of the Ba2+ currents elicited by a pulse to 0 mV in BPN (black squares) and BPH (red circles) myocytes (n= 10–30 cells per data point, from 4–15 mice). Data are expressed as a percentage of control, in the absence of the drug. Right, dose–response curves for the effect of GBP obtained in similar experiments performed in HEK cells transfected with the indicated Cav1.2 subunit composition (n= 4–12 cells per point).
To support this observation, we determined the level of mRNA and protein expression of different subunits of the Cav1.2 channel complex in BPN and BPH arteries. Figure 7A shows the results of real-time mRNA analysis of pore-forming and accessory CaV1.2 channel subunits. At the mRNA level, the α2δ-1, β2 and β3 auxiliary subunits are the more abundant in BPN myocytes (Fig. 7A, left panel). When mRNA expression was analysed in BPH myocytes (Fig. 7A, right panel), we found differences in the expression of only α1C, α2δ-3 and β2 subunits. Not all these differences in mRNA translated into differences in protein expression (Fig. 7B). α1C and α2δ-1 protein levels correlated with mRNA levels in BPN and BPH myocytes. Consistent with the ICa data above, α1C protein expression was about 20% higher in BPN than in BPH arteries. Interestingly, in spite of the lower level expression of mRNA, and in agreement with the GBP data, β2 protein expression was higher in BPH than in BPN myocytes.
Figure 7. mRNA and protein expression of CaV1.2 subunits in BPN and BPH VSMCs.
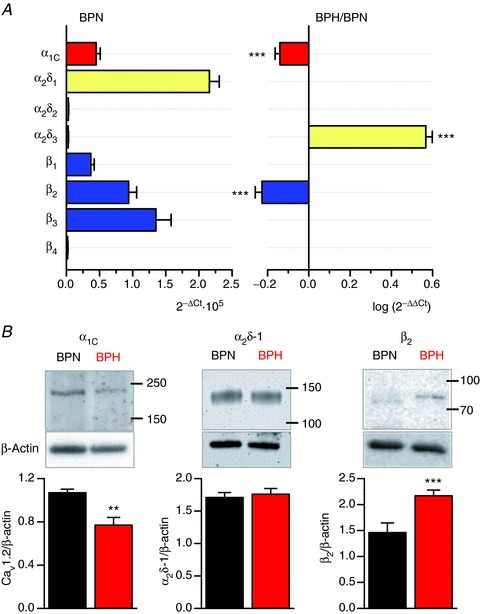
A, the left graph shows the relative abundance of the principal (α1C) and the accessory subunits of L-type Ca2+ channels in BPN mesenteric myocytes, relative to the mRNA levels of RP18S, which was used as housekeeping gene. On the right, mRNA expression levels in BPH arteries were calculated using BPN expression levels as calibrator, so that only genes whose expression changes are shown in the figure. In this way, a value of 0 indicates no change, negative values indicate decreased expression and positive values increased expression relative to BPN. Each data point was obtained from quadruplicate determinations from at least three different samples. B, representative Western blots illustrating expression of the α1C subunit, and the accessory subunits α2δ-1 and β2 in BPN and BPH lysates. Blots were cut at 50 kDa to allow probing for β-actin as a loading control. The lower panels show the densitometric analyses of several experiments in each case (α1Cn= 6, α2δ-1 n= 5 and β2n= 4).
Discussion
Our data support a new model in which changes in the molecular composition of CaV1.2 and BK channels alter local Ca2+ signalling in arterial smooth muscle during essential hypertension (Fig. 8). A key feature of this model is that Ca2+ influx into hypertensive myocytes is dominated by a small group of CaV1.2 channels with a disproportionately high level of activity. Differences in local CaV1.2 channel activity between BPN and BPH myocytes are probably due to disparity in the ancillary subunits associated with these channels. In addition, myocytes from BPH mice present also a lower expression of BK β1 subunits, which lowers their Ca2+ sensitivity and renders them insensitive to their physiological activators: Ca2+ sparks.
Figure 8. Schematic view of the possible differences between BPN and BPH myocytes.
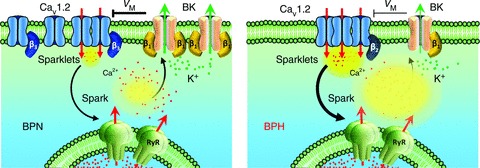
BPH Cav1.2 spatial organization in bigger clusters increases local Ca+2 sparklet amplitude, which determines an increase in the activity of RyR channels and leads to bigger Ca2+ sparks. Under normal conditions, Ca2+ sparks activate BK channels, producing STOCs that lead to membrane hyperpolarization. However, the correlation between Ca2+ sparks and STOCs is lost in BPH due to the reduced Ca2+ sensitivity of BK channels. This difference can be attributed to the decreased expression of the BK β1 subunit in BPH cells, and leads to a reduction of the negative feedback exerted by BK channels on resting membrane potential, and hence to a membrane depolarization. The data presented here also suggest that the differences in the activity, the spatial distribution and the modulation of Cav1.2 could be determined, at least in part, by a different subunit composition.
An important finding in this study is that ICa was lower in hypertensive than in normotensive myocytes. The lower ICa can result from the expression of fewer functional channels as well as a lower Po and/or iCa of CaV1.2 channels. Although we did not record currents from single CaV1.2 channels, our observation that the amplitude of elementary CaV1.2 sparklets was similar in BPN and BPH cells suggests that changes in iCa did not contribute to differences in ICa between these cells. Rather, our electrophysiological (i.e. tail currents in the presence of BayK) and Western blot data suggest that BPH cells express 30–40% fewer CaV1.2 channels than BPN cells. Note, however, that the membrane potential of BPH cells (≈−35 mV) is ∼10 mV more depolarized than in BPN cells (≈−45 mV) (Tajada et al. 2012). Even with this difference in membrane potential, the predicted ICa at −35 mV for BPH myocytes is ∼75% of that predicted for BPN cells. Of interest, although BPH myocytes have a lower global ICa, pressure myography data obtained in equivalent BPN and BPH mesenteric arteries show that the active pressure-induced vasoconstriction and hence the myogenic tone were larger in BPH arteries (Tajada et al. 2012). From these data, we propose that in spite of a decrease in the global number of CaV1.2 channels, the increased vascular tone characteristic of hypertension can be supported by a subpopulation of highly active channels that dominate the resting Ca2+ influx. This subpopulation, together with changes in other conductances (such as BK channels and Kir channels), can determine the more depolarized resting Em and the increased reactivity of depolarized resting membrane potential mesenteric arteries. This complex interplay can become even more intricate if we consider the contribution of endothelial cell function to vascular reactivity. Although here we are studying isolated VSMCs, it has been shown that the mechanisms involving endothelial cell Ca2+ events (leading to hyperpolarization and dilation) are dependent on intraluminal pressure (Bagher et al. 2012), revealing a physiological role for myo-endothelial junctions that awaits further characterization in hypertensive vessels.
Our data are at odds with other studies investigating ICa in other animal models of essential hypertension (e.g. SHR, Dahl salt-sensitive rats) that have found that even short-term exposure to high intravascular pressures appears to upregulate the α1C subunit and the number of functional CaV1.2 channels in VSMCs (Lozinskaya & Cox, 1997; Martens & Gelband, 1996; Simard et al. 1998; Pesic et al. 2004). In two of these studies, it was suggested that depolarization per se increases α1C subunit expression in VSMCs from small arteries, suggesting that a chronic increase in intravascular pressure both activates existing CaV1.2 channels and increases the number of channels in VSMCs during the progression of hypertension (Pesic et al. 2004; Sonkusare et al. 2006). However, it is important to note that increased CaV1.2 channel expression is not consistently found in all animal models of hypertension. For example, ICa density has been reported to increase in young SHR, when blood pressure values are normal, but the difference disappears in old, hypertensive animals (Ohya et al. 1993). Also, in SHR rats, and in spite of the finding of an increased CaV1.2 channel function, a lower level of CaV1.2 expression has been reported (Hermsmeyer et al. 1995). In combination with our data, this study suggests that increased global Ca2+ influx (e.g. ICa) is not required for the genesis or the maintenance of the hypertensive phenotype.
However, the CaV1.2 channel is not homogeneous. Instead, subpopulations of CaV1.2 channels operate in a continuously high open probability mode, producing distinct sites of Ca2+ sparklet activity (Navedo et al. 2005; Santana & Navedo, 2009). The changes in ICa density observed in BPH cells, together with the apparent higher sensitivity to BayK-8644, could be a priori explained by the existence of less active channels in BPH VSMCs. However, our findings clearly show that BPH CaV1.2 channels at resting membrane potentials (∼−70 mV) present a higher open probability, with longer mean open time and are organized in bigger clusters. Paradoxically, fewer channels in BPH cells allow an increased Ca2+ influx at rest. These data suggest that global changes in the number or activity of CaV1.2 channels are not good predictors of local changes, and even local changes of CaV1.2 channels are not good predictors of physiological outputs if the full context of changes in other relevant proteins is unknown.
The physiological implications of this difference are profound. CaV1.2 channels in high activity Ca2+ influx mode could increase local and global [Ca2+]i, increasing SR Ca2+ content and thus the frequency and amplitude of RyR-mediated Ca2+ sparks. In BPN myocytes, Ca2+ sparks evoke large BK currents that hyperpolarize VSMCs and thereby close CaV1.2 channels. However, down-regulation of the BKα subunit decreases BK currents in BPH myocytes and, more importantly, down-regulation of the BKβ1 subunit decreases the sensitivity of these channels to Ca2+, rendering them less capable to respond to the larger and more frequent Ca2+ sparks in these cells. The half-activation voltage (V0.5) of BK currents, both in BPN and in BPH myocytes, has a steep Ca2+ dependence, as previously reported (Rothberg & Magleby, 2000). Interestingly, the V0.5 of BK currents from BPH myocytes is not different from BPN cells at 1 μm Ca2+, but it is significantly depolarized at higher [Ca2+]. These differences are very similar to those reported when BK currents mediated by BK(α+β1) or BKα alone are compared, since the V0.5 values for BK(α+β1) are higher than for BKα for [Ca2+]≥1 μm (Orio & Latorre, 2005; Orio et al. 2006). According to these observations, BPN myocytes would have a large proportion of BK channels composed of α+β1, while BPH myocytes showed a Ca2+ sensitivity closer to BK channels composed of α subunits alone.
Our findings raise an important question: how does a decrease in CaV1.2 channel activity translate into a higher activity of Ca2+ sparklets in BPH VSMCs? Data presented in this paper strongly suggest that the answer to this question relates to a different expression of CaV1.2 auxiliary subunits in the VSMCs from BPH mice. CaV1.2 channels are hetero-oligomeric complexes, consisting of up to four proteins. The principal subunit is α1, localized in the membrane and forming the conductive pore. The other three (β, α2δ and γ) are auxiliary subunits that modulate channel expression and activity. Not all the modulatory subunits are necessarily present in each channel complex, and the multiple possible combinations is a source of great versatility in terms of regulating channel trafficking, channel gating or channel modulation by other signalling molecules (Davies et al. 2007; Buraei & Yang, 2010). Changes in the expression of these auxiliary subunits have been already reported in the context of hypertension. In cerebral arteries of SHR rats, age-dependent development of hypertension is associated with an unequal elevation in α2δ-1 and α1C mRNA and protein, with α2δ-1 increasing more than α1C. The elevation in α2δ-1 expression promotes surface trafficking of CaV1.2 channels, leading to an increase in current density and a reduction in current inactivation that induces vasoconstriction (Bannister et al. 2012). Changes in the expression of β3 subunits have been also linked to calcium channel upregulation in mice made hypertensive by angiotensin II infusion (Kharade et al. 2013). Similarly, studies on β3−/− mice have shown that VSMCs express fewer CaV1.2 channels compared with WT mice. This implies that β subunits contribute to the basal expression of CaV1.2 channels in VSMCs in vivo (Murakami et al. 2003).
In this work, we have tested the hypothesis that the observed differences in global and local activity of CaV1.2 channels from BPH cells could be the consequence of changes in the composition of auxiliary subunits in the channel complexes. We have used GBP as a tool to explore the functional contribution of α2δ subunits to CaV1.2 channels in VSMCs. The comparison of GBP effects on native currents with the effects obtained on currents elicited in a heterologous expression system combining different subunit compositions has revealed interesting insights about the possible differences between BPN and BPH CaV1.2 channels. Although GBP binding to α2δ-1 and α2δ-2 subunits is well established (Marais et al. 2001; Dooley et al. 2007), the acute effects of GBP on Ca2+ currents are controversial. GBP has been shown to inhibit a variety of Ca2+ currents, including L-, N- and P/Q-type (Cheng & Chiou, 2006). However, other studies show no acute effect of GBP on Ca2+ currents (Hendrich et al. 2008). On the contrary, in our study, we found that GBP increased CaV1.2 channel currents, this effect being significantly different in BPH and BPN VSMCs.
Two indirect lines of evidence demonstrate that the effects of GBP on CaV1.2 channels are due to its specific binding to α2δ subunits. First, in HEK cells we could not see any effect of the drug in any CaV1.2 channel subunit combination in which the α2δ subunit was not present. Second, when we explored the effect on the native currents, we demonstrate the loss of the effect upon removal of the α2 subunit by treatment with DTT. DTT is a reducing agent that cleaves the α2δ accessory subunit by breaking the disulphide bridge that holds them together, eliminating the binding site of GBP from the CaV1.2 channel complex (Marais et al. 2001; Davies et al. 2007).
The concentration–response relationship for the acute effect of GBP is biphasic in BPN VSMCs and in HEK cells co-expressing α1/α2δ-1 or α1/α2δ-1/β3 subunits, with a maximal effect at ∼10 μm. A biphasic relationship discloses a complex interaction, with low-dose positive effects and high-dose negative effects. The simplest model to explain such a relationship would require two different binding sites for the drug, and this is currently not supported by the literature, since only one binding site has been reported (Marais et al. 2001; Davies et al. 2006). However, the reported Kd is in the nanomolar range, and GBP concentrations used in those studies (up to 1 μm) would not reveal another possible binding site at higher concentrations. Nevertheless, the striking result in our work is that the biphasic relationship disappears in BPH VSMCs and in HEK cells co-expressing α1/α2δ-1/β2 subunits, suggesting that the different response to GBP between BPN and BPH cells can be due to a different proportion of the β2 subunits in the functional CaV1.2 channels. These results do not correlate with the β2 subunit mRNA changes observed in BPN VSMCs, but are in good agreement with the differences in protein expression described by Western blots. Since β3 and β2 are the main β subunits expressed in VSMCs (Murakami et al. 2003), our data are compatible with the hypothesis that CaV1.2 channels are mainly formed by α1/α2δ/β3 complexes in BPN VSMCs and α1/α2δ/β2 complexes in BPH VSMCs. The putative increase in the number of α1/α2δ/β2 complexes in BPH cells could be responsible for the differences in the local activity of CaV1.2 channels in those cells. In this regard, it is known that the size and the plasma membrane density of CaV1.2 channel clusters depend significantly on the type of β subunit present in the complex (Kobrinsky et al. 2009).
To conclude, hypertension may be regarded as a narrative involving increased VSMC contractility, elevated blood pressure and increased mortality. However, the story can be told in different ways through the involvement of different characters that change in subtle and varied ways with time to achieve the same result of increased contractility. It is therefore not surprising that we are still far from understanding how to change the end of the story and ensure longer patient survival. These changes are complex, but our study suggests that changes in local Ca2+ signalling could play a critical role in the development of vascular dysfunction during hypertension. How these changes contribute individually to the hypertensive phenotype is unclear, but taken as a whole, the data presented in this study clearly demonstrate that changes have to be interpreted in a global context, and that all differences must be integrated to properly understand the phenotypic change.
Acknowledgments
We thank Esperanza Alonso and Rodrigo de Pedro for excellent technical assistance.
Glossary
Abbreviations
- BK channel
large conductance, Ca2+-activated K+ channel
- BSA
bovine serum albumin
- [Ca2+]i
intracellular Ca2+
- DTE
1,4-dithioerythritol
- DTT
dithiothreitol
- GBP
gabapentin
- Kir channel
inwardly rectifying K+ channel
- Kv channel
voltage-gated K+ channel
- RyR
ryanodine receptor
- SMDS
smooth muscle dissociation solution
- SR
sarcoplasmic reticulum
- STOC
spontaneous transient outward current
- TIRF
total internal reflectance fluorescence
- VSMC
vascular smooth muscle cell
Additional Information
Competing interests
None.
Author contributions
P.C., L.F.S., M.T.P-G. and J.R.L-L. designed and performed the experiments, analysed and interpreted the data, wrote the manuscript, and contributed to the discussion and review of the manuscript. S.T. and O.C contributed to the design of the experiments, performed the experiments, analysed the data, and contributed to the review of the manuscript. The sparklets, sparks and STOCs experiments were carried out at the Department of Physiology & Biophysics, University of Washington, Seattle. All other experiments were carried out at the Department of Biochemistry and Molecular Biology and Physiology of the University of Valladolid. All authors approved the final submitted version.
Funding
Supported by Ministerio de Sanidad, ISCIII grant R006/009 (Red Heracles), Ministerio de Ciencia e Innovación grant BFU2010-15898 (MTPG) and Junta de Castilla y León grant VA094A11-2 (JRLL). ST is a fellow of the Spanish MICINN. Work in Dr. L. Fernando Santana's laboratory was supported by NIH grants HL085870 and P01HL095488.
References
- Amberg GC, Navedo MF, Nieves-Cintrón M, Molkentin JD, Santana LF. Calcium sparklets regulate local and global calcium in murine arterial smooth muscle. J Physiol. 2007;579:187–201. doi: 10.1113/jphysiol.2006.124420. [DOI] [PMC free article] [PubMed] [Google Scholar]
- Bagher P, Beleznai T, Kansui Y, Mitchell R, Garland CJ, Dora KA. Low intravascular pressure activates endothelial cell TRPV4 channels, local Ca2+ events, and IKCa channels, reducing arteriolar tone. Proc Natl Acad Sci U S A. 2012;109:18174–18179. doi: 10.1073/pnas.1211946109. [DOI] [PMC free article] [PubMed] [Google Scholar]
- Bannister JP, Bulley S, Narayanan D, Thomas-Gatewood C, Luzny P, Pachuau J, Jaggar JH. Transcriptional upregulation of α2δ-1 elevates arterial smooth muscle cell voltage-dependent Ca2+ channel surface expression and cerebrovascular constriction in genetic hypertension/novelty and significance. Hypertension. 2012;60:1006–1015. doi: 10.1161/HYPERTENSIONAHA.112.199661. [DOI] [PMC free article] [PubMed] [Google Scholar]
- Buraei Z, Yang J. The β subunit of voltage-gated Ca2+ channels. Physiol Rev. 2010;90:1461–1506. doi: 10.1152/physrev.00057.2009. [DOI] [PMC free article] [PubMed] [Google Scholar]
- Cheng H, Song LS, Shirokova N, Gonzalez A, Lakatta EG, Rios E, Stern MD. Amplitude distribution of calcium sparks in confocal images: theory and studies with an automatic detection method. Biophys J. 1999;76:606–617. doi: 10.1016/S0006-3495(99)77229-2. [DOI] [PMC free article] [PubMed] [Google Scholar]
- Cheng JK, Chiou LC. Mechanisms of the antinociceptive action of gabapentin. J Pharmacol Sci. 2006;100:471–486. doi: 10.1254/jphs.cr0050020. [DOI] [PubMed] [Google Scholar]
- Cidad P, Moreno-Dominguez A, Novensa L, Roque M, Barquin L, Heras M, Perez-Garcia MT, Lopez-Lopez JR. Characterization of ion channels involved in the proliferative response of femoral artery smooth muscle cells. Arteriosc Thromb Vasc Biol. 2010;30:1203–1211. doi: 10.1161/ATVBAHA.110.205187. [DOI] [PubMed] [Google Scholar]
- Cox RH, Folander K, Swanson R. Differential expression of voltage-gated K+ channel genes in arteries from spontaneously hypertensive and Wistar-Kyoto rats. Hypertension. 2001;37:1315–1322. doi: 10.1161/01.hyp.37.5.1315. [DOI] [PubMed] [Google Scholar]
- Davies A, Douglas L, Hendrich J, Wratten J, Tran VM, Foucault I, Koch D, Pratt WS, Saibil HR, Dolphin AC. The calcium channel α2δ-2 subunit partitions with Cav2.1 into lipid rafts in cerebellum: implications for localization and function. J Neurosci. 2006;26:8748–8757. doi: 10.1523/JNEUROSCI.2764-06.2006. [DOI] [PMC free article] [PubMed] [Google Scholar]
- Davies A, Hendrich J, Van Minh AT, Wratten J, Douglas L, Dolphin AC. Functional biology of the α2δ subunits of voltage-gated calcium channels. Trends Pharmacol Sci. 2007;28:220–228. doi: 10.1016/j.tips.2007.03.005. [DOI] [PubMed] [Google Scholar]
- Demuro A, Parker I. Imaging the activity and localization of single voltage-gated Ca2+ channels by total internal reflection fluorescence microscopy. Biophys J. 2004;86:3250–3259. doi: 10.1016/S0006-3495(04)74373-8. [DOI] [PMC free article] [PubMed] [Google Scholar]
- Dooley DJ, Taylor CP, Donevan S, Feltner D. Ca2+ channel α2δ ligands: novel modulators of neurotransmission. Trends Pharmacol Sci. 2007;28:75–82. doi: 10.1016/j.tips.2006.12.006. [DOI] [PubMed] [Google Scholar]
- Earley S, Waldron BJ, Brayden JE. Critical role for transient receptor potential channel TRPM4 in myogenic constriction of cerebral arteries. Circ Res. 2004;95:922–929. doi: 10.1161/01.RES.0000147311.54833.03. [DOI] [PubMed] [Google Scholar]
- Fleischmann BK, Murray RK, Kotlikoff MI. Voltage window for sustained elevation of cytosolic calcium in smooth muscle cells. Proc Natl Acad Sci U S A. 1994;91:11914–11918. doi: 10.1073/pnas.91.25.11914. [DOI] [PMC free article] [PubMed] [Google Scholar]
- Harder DR, Gilbert R, Lombard JH. Vascular muscle cell depolarization and activation in renal arteries on elevation of transmural pressure. Am J Physiol. 1987;253:F778–F781. doi: 10.1152/ajprenal.1987.253.4.F778. [DOI] [PubMed] [Google Scholar]
- Hendrich J, Van Minh AT, Heblich F, Nieto-Rostro M, Watschinger K, Striessnig J, Wratten J, Davies A, Dolphin AC. Pharmacological disruption of calcium channel trafficking by the α2δ ligand gabapentin. Proc Natl Acad Sci U S A. 2008;105:3628–3633. doi: 10.1073/pnas.0708930105. [DOI] [PMC free article] [PubMed] [Google Scholar]
- Hermsmeyer K, White AC, Triggle DJ. Decreased dihydropyridine receptor number in hypertensive rat vascular muscle cells. Hypertension. 1995;25:731–734. doi: 10.1161/01.hyp.25.4.731. [DOI] [PubMed] [Google Scholar]
- Jackson WF. Ion channels and vascular tone. Hypertension. 2000;35:173–178. doi: 10.1161/01.hyp.35.1.173. [DOI] [PMC free article] [PubMed] [Google Scholar]
- Jaggar JH, Wellman GC, Heppner TJ, Porter VA, Perez GJ, Gollasch M, Kleppisch T, Rubart M, Stevenson AS, Lederer WJ, Knot HJ, Bonev AD, Nelson MT. Ca2+ channels, ryanodine receptors and Ca2+-activated K+ channels: a functional unit for regulating arterial tone. Acta Physiol Scand. 1998;164:577–587. doi: 10.1046/j.1365-201X.1998.00462.x. [DOI] [PubMed] [Google Scholar]
- Johnson RP, El Yazbi AF, Takeya K, Walsh EJ, Walsh MP, Cole WC. Ca2+ sensitization via phosphorylation of myosin phosphatase targeting subunit at threonine-855 by Rho kinase contributes to the arterial myogenic response. J Physiol. 2009;587:2537–2553. doi: 10.1113/jphysiol.2008.168252. [DOI] [PMC free article] [PubMed] [Google Scholar]
- Kauffenstein G, Laher I, Matrougui K, Guerineau NC, Henrion D. Emerging role of G protein-coupled receptors in microvascular myogenic tone. Cardiovasc Res. 2012;95:223–232. doi: 10.1093/cvr/cvs152. [DOI] [PMC free article] [PubMed] [Google Scholar]
- Kharade SV, Sonkusare SK, Srivastava AK, Thakali KM, Fletcher TW, Rhee SW, Rusch NJ. The β3 subunit contributes to vascular calcium channel upregulation and hypertension in angiotensin II-infused C57BL/6 mice. Hypertension. 2013;61:137–142. doi: 10.1161/HYPERTENSIONAHA.112.197863. [DOI] [PMC free article] [PubMed] [Google Scholar]
- Kobrinsky E, Abrahimi P, Duong SQ, Thomas S, Harry JB, Patel C, Lao QZ, Soldatov NM. Effect of Cavβ subunits on structural organization of Cav1.2 calcium channels. PLoS ONE. 2009;4:e5587. doi: 10.1371/journal.pone.0005587. [DOI] [PMC free article] [PubMed] [Google Scholar]
- Livak KJ, Schmittgen TD. Analysis of relative gene expression data using real-time quantitative PCR and the 2-ΔΔCT method. Methods. 2001;25:402–408. doi: 10.1006/meth.2001.1262. [DOI] [PubMed] [Google Scholar]
- Lozinskaya IM, Cox RH. Effects of age on Ca2+ currents in small mesenteric artery myocytes from Wistar-Kyoto and spontaneously hypertensive rats. Hypertension. 1997;29:1329–1336. doi: 10.1161/01.hyp.29.6.1329. [DOI] [PubMed] [Google Scholar]
- Marais E, Klugbauer N, Hofmann F. Calcium channel α2δ subunits-structure and gabapentin binding. Mol Pharmacol. 2001;59:1243–1248. doi: 10.1124/mol.59.5.1243. [DOI] [PubMed] [Google Scholar]
- Maravall M, Mainen ZF, Sabatini BL, Svoboda K. Estimating intracellular calcium concentrations and buffering without wavelength ratioing. Biophys J. 2000;78:2655–2667. doi: 10.1016/S0006-3495(00)76809-3. [DOI] [PMC free article] [PubMed] [Google Scholar]
- Martens JR, Gelband CH. Alterations in rat interlobar artery membrane potential and K+ channels in genetic and nongenetic hypertension. Circ Res. 1996;79:295–301. doi: 10.1161/01.res.79.2.295. [DOI] [PubMed] [Google Scholar]
- Martinez-Lemus LA, Crow T, Davis MJ, Meininger GA. αvβ3- and α5β1-integrin blockade inhibits myogenic constriction of skeletal muscle resistance arterioles. Am J Physiol Heart Circ Physiol. 2005;289:H322–H329. doi: 10.1152/ajpheart.00923.2003. [DOI] [PubMed] [Google Scholar]
- Moosmang S, Schulla V, Welling A, Feil R, Feil S, Wegener JW, Hofmann F, Klugbauer N. Dominant role of smooth muscle L-type calcium channel Cav1.2 for blood pressure regulation. EMBO J. 2003;22:6027–6034. doi: 10.1093/emboj/cdg583. [DOI] [PMC free article] [PubMed] [Google Scholar]
- Moreno-Dominguez A, Cidad P, Miguel-Velado E, Lopez-Lopez JR, Perez-Garcia MT. De novo expression of Kv6.3 contributes to changes in vascular smooth muscle cell excitability in a hypertensive mice strain. J Physiol. 2009;587:625–640. doi: 10.1113/jphysiol.2008.165217. [DOI] [PMC free article] [PubMed] [Google Scholar]
- Murakami M, Yamamura H, Suzuki T, Kang MG, Ohya S, Murakami A, Miyoshi I, Sasano H, Muraki K, Hano T, Kasai N, Nakayama S, Campbell KP, Flockerzi V, Imaizumi Y, Yanagisawa T, Iijima T. Modified cardiovascular L-type channels in mice lacking the voltage-dependent Ca2+ channel β3 subunit. J Biol Chem. 2003;278:43261–43267. doi: 10.1074/jbc.M211380200. [DOI] [PubMed] [Google Scholar]
- Navedo MF, Amberg GC, Votaw VS, Santana LF. Constitutively active L-type Ca2+ channels. Proc Natl Acad Sci U S A. 2005;102:11112–11117. doi: 10.1073/pnas.0500360102. [DOI] [PMC free article] [PubMed] [Google Scholar]
- Nelson MT, Cheng H, Rubart M, Santana LF, Bonev AD, Knot HJ, Lederer WJ. Relaxation of arterial smooth muscle by calcium sparks. Science. 1995;270:633–637. doi: 10.1126/science.270.5236.633. [DOI] [PubMed] [Google Scholar]
- Nelson MT, Quayle JM. Physiological roles and properties of potassium channels in arterial smooth muscle. Am J Physiol. 1995;268:C799–C822. doi: 10.1152/ajpcell.1995.268.4.C799. [DOI] [PubMed] [Google Scholar]
- Ohya Y, Abe I, Fujii K, Takata Y, Fujishima M. Voltage-dependent Ca2+ channels in resistance arteries from spontaneously hypertensive rats. Circ Res. 1993;73:1090–1099. doi: 10.1161/01.res.73.6.1090. [DOI] [PubMed] [Google Scholar]
- Orio P, Latorre R. Differential effects of β1 and β2 subunits on BK channel activity. J Gen Physiol. 2005;125:395–411. doi: 10.1085/jgp.200409236. [DOI] [PMC free article] [PubMed] [Google Scholar]
- Orio P, Torres Y, Rojas P, Carvacho I, Garcia ML, Toro L, Valverde MA, Latorre R. Structural determinants for functional coupling between the β and α subunits in the Ca2+-activated K+ (BK) channel. J Gen Physiol. 2006;127:191–204. doi: 10.1085/jgp.200509370. [DOI] [PMC free article] [PubMed] [Google Scholar]
- Pesic A, Madden JA, Pesic M, Rusch NJ. High blood pressure upregulates arterial L-type Ca2+ channels: is membrane depolarization the signal. Circ Res. 2004;94:e97–104. doi: 10.1161/01.RES.0000131495.93500.3c. [DOI] [PubMed] [Google Scholar]
- Rothberg BS, Magleby KL. Voltage and Ca2+ activation of single large-conductance Ca2+-activated K+ channels described by a two-tiered allosteric gating mechanism. J Gen Physiol. 2000;116:75–99. doi: 10.1085/jgp.116.1.75. [DOI] [PMC free article] [PubMed] [Google Scholar]
- Rubart M, Patlak JB, Nelson MT. Ca2+ currents in cerebral artery smooth muscle cells of rat at physiological Ca2+ concentrations. J Gen Physiol. 1996;107:459–472. doi: 10.1085/jgp.107.4.459. [DOI] [PMC free article] [PubMed] [Google Scholar]
- Santana LF, Navedo MF. Molecular and biophysical mechanisms of Ca2+ sparklets in smooth muscle. J Mol Cell Cardiol. 2009;47:436–444. doi: 10.1016/j.yjmcc.2009.07.008. [DOI] [PMC free article] [PubMed] [Google Scholar]
- Schlager G, Sides J. Characterization of hypertensive and hypotensive inbred strains of mice. Lab Anim Sci. 1997;47:288–292. [PubMed] [Google Scholar]
- Schnitzler M, Storch U, Meibers S, Nurwakagari P, Breit A, Essin K, Gollasch M, Gudermann T. Gq-coupled receptors as mechanosensors mediating myogenic vasoconstriction. EMBO J. 2008;27:3092–3103. doi: 10.1038/emboj.2008.233. [DOI] [PMC free article] [PubMed] [Google Scholar]
- Simard JM, Li X, Tewari K. Increase in functional Ca2+ channels in cerebral smooth muscle with renal hypertension. Circ Res. 1998;82:1330–1337. doi: 10.1161/01.res.82.12.1330. [DOI] [PubMed] [Google Scholar]
- Sonkusare S, Palade PT, Marsh JD, Telemaque S, Pesic A, Rusch NJ. Vascular calcium channels and high blood pressure: pathophysiology and therapeutic implications. Vasc Pharmacol. 2006;44:131–142. doi: 10.1016/j.vph.2005.10.005. [DOI] [PMC free article] [PubMed] [Google Scholar]
- Spassova MA, Hewavitharana T, Xu W, Soboloff J, Gill DL. A common mechanism underlies stretch activation and receptor activation of TRPC6 channels. Proc Natl Acad Sci U S A. 2006;103:16586–16591. doi: 10.1073/pnas.0606894103. [DOI] [PMC free article] [PubMed] [Google Scholar]
- Tajada S, Cidad P, Moreno-Domínguez A, Pérez-García MT, López-López JR. High blood pressure associates with the remodelling of inward rectifier K+ channels in mice mesenteric vascular smooth muscle cells. J Physiol. 2012;590:6075–6091. doi: 10.1113/jphysiol.2012.236190. [DOI] [PMC free article] [PubMed] [Google Scholar]
- Welsh DG, Morielli AD, Nelson MT, Brayden JE. Transient receptor potential channels regulate myogenic tone of resistance arteries. Circ Res. 2002;90:248–250. doi: 10.1161/hh0302.105662. [DOI] [PubMed] [Google Scholar]
- Weston AH, Porter EL, Harno E, Edwards G. Impairment of endothelial SKCa channels and of downstream hyperpolarizing pathways in mesenteric arteries from spontaneously hypertensive rats. Br J Pharmacol. 2010;160:836–843. doi: 10.1111/j.1476-5381.2010.00657.x. [DOI] [PMC free article] [PubMed] [Google Scholar]