Abstract
Platelet-derived growth factor receptor α positive (PDGFRα+) cells are suggested to mediate purinergic inputs in GI muscles, but the responsiveness of these cells to purines in situ has not been evaluated. We developed techniques to label and visualize PDGFRα+ cells in murine gastric fundus, load cells with Ca2+ indicators, and follow their activity via digital imaging. Immunolabelling demonstrated a high density of PDGFRα+ cells in the fundus. Cells were isolated and purified by fluorescence-activated cell sorting (FACS) using endogenous expression of enhanced green fluorescent protein (eGFP) driven off the Pdgfra promoter. Quantitative PCR showed high levels of expression of purinergic P2Y1 receptors and SK3 K+ channels in PDGFRα+ cells. Ca2+ imaging was used to characterize spontaneous Ca2+ transients and responses to purines in PDGFRα+ cells in situ. ATP, ADP, UTP and β-NAD elicited robust Ca2+ transients in PDGFRα+ cells. Ca2+ transients were also elicited by the P2Y1-specific agonist (N)-methanocarba-2MeSADP (MRS-2365), and inhibited by MRS-2500, a P2Y1-specific antagonist. Responses to ADP, MRS-2365 and β-NAD were absent in PDGFRα+ cells from P2ry1(−/−) mice, but responses to ATP were retained. Purine-evoked Ca2+ transients were mediated through Ca2+ release mechanisms. Inhibitors of phospholipase C (U-73122), IP3 (2-APB), ryanodine receptors (Ryanodine) and SERCA pump (cyclopiazonic acid and thapsigargin) abolished Ca2+ transients elicited by purines. This study provides a link between purine binding to P2Y1 receptors and activation of SK3 channels in PDGFRα+ cells. Activation of Ca2+ release is likely to be the signalling mechanism in PDGFRα+ cells responsible for the transduction of purinergic enteric inhibitory input in gastric fundus muscles.
Key points
A new class of interstitial cells, PDGFRα+ cells, is distributed densely in the proximal stomachs of mice.
PDGFRα+ cells express the molecular apparatus necessary for transduction of inputs from enteric inhibitory motor neurons.
PDGFRα+ cells generate spontaneous Ca2+ transients and display dynamic Ca2+ oscillations in response to purines.
Purinergic responses are mediated by P2Y1 receptors and by Ca2+ release from intracellular Ca2+ stores.
Ca2+ release in PDGFRα+ cells is the likely means by which purinergic neurotransmitters activate Ca2+-activated K+ channels (SK) and hyperpolarization in GI muscles to elicit inhibitory motor responses.
Spontaneous Ca2+ transients may be a means of regulating basal excitability of fundus muscles and release of purines from motor neurons may contribute to the control of pressure during filling in the proximal stomach.
Introduction
Superimposed upon myogenic control in the gastrointestinal (GI) tract are a variety of hierarchical regulatory systems that generate the coordinated muscular movements of normal GI motility. Smooth muscle cells (SMCs), for example, are coupled via gap junctions to at least two distinct classes of interstitial cells, interstitial cells of Cajal (ICC) and PDGFRα+ cells (Komuro et al. 1999; Fujita et al. 2003). Thus, these three cell types form an electrical syncytium we have referred to as the SMC/ICC/PDGFRα+ (SIP) syncytium (Sanders et al. 2012). Inward and outward conductances in any of the SIP cells modulate to overall muscle excitability and responses to other regulatory inputs. ICCs serve as pacemaker cells (Ward et al. 1994; Torihashi et al. 1995) and mediate and integrate inputs from motor neurons (Burns et al. 1996; Ward et al. 1998, 2000; Ward & Sanders, 2006). It was recently shown that PDGFRα+ cells are likely to mediate purinergic inputs from enteric inhibitory motor neurons (Kurahashi et al. 2011).
PDGFRα+ cells share similar anatomical distributions with ICC, and the study of these cells was advanced when it was shown that antibodies to PDGFRα label cells formerly referred to generically as ‘fibroblast-like cells’ (Iino et al. 2009; Iino & Nojyo, 2009; Sanders, 2010; Kurahashi et al. 2011). ICC and PDGFRα+ cells share a similar mesenchymal origin, but they form distinct populations of mature cells based on ultrastructural properties, morphology, expression of specific proteins and function (Komuro et al. 1999; Horiguchi & Komuro, 2000; Iino & Nojyo, 2009; Kurahashi et al. 2011). Distributions of PDGFRα+ cells in the tunica muscularis have been described in several GI regions of laboratory animals and humans, including the colon, small intestine and sphincters (Iino et al. 2009; Iino & Nojyo, 2009; Cobine et al. 2011; Kurahashi et al. 2011, 2012; Blair et al. 2012; Grover et al. 2012), and double labelling immunohistochemistry has shown these cells to be closely associated with enteric motor neurons (Kurahashi et al. 2011, 2012; Blair et al. 2012). Their close associations with nerve terminals suggest these cells, like ICC, might receive and transduce neurotransmitter input from enteric motor neurons (Komuro, 1999; Horiguchi & Komuro, 2000; Iino & Nojyo, 2009; Kurahashi et al. 2011).
PDGFRα+ cells have abundant expression of small conductance Ca2+-activated K+ channels (SK3 channels) and P2Y1 receptors (Klemm & Lang, 2002; Vanderwinden et al. 2002; Fujita et al. 2003; Iino et al. 2009; Iino & Nojyo, 2009; Kurahashi et al. 2011, 2012), which are the major receptors and effectors mediating purinergic enteric inhibitory regulation of GI muscles (Gallego et al. 2006, 2011, 2012; Zhang et al. 2010; Hwang et al. 2012). Recently PDGFRα+ cells were isolated and shown to generate large amplitude apamin- and Ca2+-sensitive outward currents in response to purines (ATP, ADP and β-NAD; Kurahashi et al. 2011). The current density of SK-like currents in colonic smooth muscle cells was too small to account for large inhibitory junction potentials recorded from intact muscles in response to enteric inhibitory neurotransmission. Thus, it appears that PDGFRα+ cells may contribute significantly to purinergic enteric neural control of GI motility. Similar cells, expressing similar ion channels and manifesting similar functions, may also be important regulators of compliance in detrusor muscles of the bladder (Koh et al. 2012; Monaghan et al. 2012; Lee et al. 2013).
No studies to date have investigated the responsiveness of PDGFRα+ cells in intact muscles directly nor shown how purinergic signals are transduced into activation of SK-dependent outward currents. This is because it is very difficult to distinguish these cells in the mixed-cell populations that constitute GI muscles. In the present study we have used mice in which PDGFRα+ cells are constitutively labelled with enhanced green fluorescent protein (eGFP), loaded cells with fluorescent Ca2+ indicators, and investigated spontaneous Ca2+ signalling and responses to purines in this new class of interstitial cell. Our observations are compatible with the hypothesis that PDGFRα+ cells are responsive to the purines and pathways released and activated during enteric inhibitory neural responses.
Methods
Animals
PDGFRαtm11(EGFP)Sor/J mice, P2ry1(−/−) mice (B6.129P2-P2ry1tm1Bhk/J) and their wild-type siblings (C57BL/6) were obtained from the Jackson Laboratory (Bar Harbor, MN, USA). Animals between the ages of 5 and 7 weeks (age-matched) were anaesthetized by inhalation of isoflurane (Baxter, Deerfield, IL, USA) and killed by cervical dislocation.
The animals used and the experiments performed in this study were maintained in accordance with the National Institutes of Health Guide for the Care and Use of Laboratory Animals. All procedures were approved by the Institutional Animal Use and Care Committee at the University of Nevada.
Tissue preparation
Stomachs, including portions of the oesophagus and duodenum, were removed from mice via an abdominal incision immediately after cervical dislocation. The stomachs were bathed in Krebs–Ringer bicarbonate solution (KRB), opened along the lesser curvature and the gastric contents washed away with KRB solution. The fundus region was identified and isolated (3 mm from the fundus–corpus border) and the mucosa and sub-mucosa layers were removed by sharp dissection.
Drugs and solutions
Tissues were maintained and perfused with KRB containing (mmol l−1): NaCl, 120.35; KCl, 5.9; NaHCO3, 15.5; NaH2PO4, 1.2; MgCl2, 1.2; CaCl2, 2.5; and glucose, 11.5. KRB was bubbled with a mixture of 97% O2–3% CO2 and warmed to a physiological temperature of 37 ± 0.2°C. For experiments with 0 mm[Ca2+]o, no CaCl2 was added to the KRB, thus the solutions were nominally free of Ca2+, but there may have been trace amounts of Ca2+ in these solutions. We refer to this as a 0 mm external Ca2+ solution.
Atropine, Nω-nitro-l-arginine (l-NNA), adenosine triphosphate (ATP), adenine diphosphate (ADP), β-nicotinamide adenine dinucleotide (β-NAD), caffeine, 2-aminoethyl diphenylborinate (2-APB), cyclopiazonic acid (CPA) and thapsigargin were purchased from Sigma-Aldrich (St Louis, MO, USA). Ryanodine was purchased from Ascent Scientific (Princeton, NJ, USA). (N)-Methanocarba-2MeSADP (MRS-2365), 2-iodo-6-(methylamino)-9H-purin-9-yl]-2(phosphonooxy)bicy-clohexane-1-methanol dihydrogen phosphate ester tetraammonium salt (MRS-2500) and tetrodotoxin (TTX) were purchased from Tocris Bioscience (Ellisville, MO, USA) All drugs were dissolved in the manufacturer-recommended solvent to make stock solutions and the final concentration stated in the Results section.
Immunohistochemistry
Whole mounts of fundus tissues were processed for immunohistochemical analysis. Tissues were pinned onto the base of a Sylgard dish after sharp dissecting and were fixed in acetone or paraformaldehyde (4°C; 10 min) as previously described (Kurahashi et al. 2011). Following fixation, preparations were washed for 30 min in phosphate-buffered saline (PBS; 0.1 m pH 7.4). Non-specific antibody binding was reduced by incubation in 1% bovine serum albumin for 1 h at room temperature. The tissues were incubated with primary antibodies for 48 h at 4°C and with secondary antibodies for 1 h at room temperature. The antibodies and dilutions used were as described previously (Kurahashi et al. 2011). Whole mounts were examined using a Zeiss LSM 510 Meta laser-scanning confocal microscope. Confocal micrographs are digital composites of Z-series scans of 0.5–1.0 optical sections through a depth of 5–40 mm. Final images were constructed using Zeiss LSM software.
Cell isolation and fluorescence-activated cell sorting (FACS)
Fundus muscles of PDGFRα-eGFP mice were dissected as described above. Muscles were equilibrated in Ca2+-free Hanks’ solution consisting of (in mm): 125 NaCl, 5.36 KCl, 15.5 NaHCO3, 0.336 Na2HPO4, 0.44 KH2PO4, 10 glucose, 2.9 sucrose, and 11 Hepes adjusted to pH 7.2 with NaOH, for 30 min. The buffer was replaced with an enzyme solution containing 2 mg ml−1 collagenase type 2 (Worthington Biochemical, Lakewood, NJ, USA), 4 mg ml−1 bovine serum albumin (Sigma), and 4 mg ml−1 trypsin inhibitor (Sigma). The tissues were placed in a 37°C water bath for 15 min and then triturated through a pipette tip to disperse the cells. PDGFRα-positive (eGFP) cells were sorted by FACS with a Becton-Dickinson FACSAria II instrument using an excitation laser (488 nm) and emission filter (530/30 nm). Sorting was performed using a 130 μm nozzle at a sheath pressure of 12 p.s.i. and sort rate of 1000 to 3000 events s−1. Live cells, gated on exclusion of the Hoechst 33258 viability indicator (data not shown), were subsequently gated on eGFP fluorescence intensity.
RNA extraction and quantitative PCR
Total RNA was isolated from collected PDGFRα+ cells and unsorted cells (total cell population from tissue dispersions before cell sorting) from six mice using an illustra RNAspin Mini RNA Isolation Kit (GE Healthcare, Pittsburgh, PA, USA), and first-strand cDNA was synthesized using SuperScript III (Invitrogen, Carlsbad, CA, USA), according to the manufacturer's instructions. The PCR primers used and their GenBank accession numbers are listed in Supplemental Table S1 (available online). Using GoTaq DNA Polymerase (Promega, Madison, WI, USA), PCR products were analysed on 2% agarose gels and visualized by ethidium bromide. Quantitative PCR (qPCR) was performed with the same primers as PCR using SYBR green chemistry on the 7500 HT Real-time PCR System (Applied Biosystems, Grand Island, NY, USA). Regression analysis of the mean values of eight multiplex qPCRs for the log10 diluted cDNA was used to generate standard curves. Unknown amounts of mRNA were plotted relative to the standard curve for each set of primers and graphically plotted using Microsoft Excel (Microsoft, Redmond, WA, USA). This gave a transcriptional quantification of each gene relative to the endogenous glyceraldehyde-3-phosphate dehydrogenase (GAPDH) standard after log transformation of the corresponding raw data. A total of six mice were divided into two groups consisting of three mice each; qPCR analysis was run in duplicate in the two groups. There was high repeatability between the two groups, and the average was used for comparison between PDGFRα+ cells and unsorted cells.
Calcium imaging
Fluorescent dye loading
Gastric fundus muscle strips were pinned to the base of a Sylgard-coated dish. After an equilibration period of (1 h), the preparation was loaded with Oregon Green 488 BAPTA-2 AM (10 μg ml−1; Molecular Probes, Eugene, OR, USA), in a solution of 0.02% DMSO and 0.01% non-toxic detergent Cremophor EL for 30 min at 25°C. After incubation, the preparation was perfused with warm KRB solution at 37°C for 40 min to allow for de-esterification of the dye.
Visualization of Ca2+ transients
Preparations were visualized and imaged using an Eclipse E600FN microscope (Nikon Inc., Melville, NY, USA) equipped with ×20 to ×40 lenses (Nikon Plan Fluor). The indicator was excited at 488 nm (T.I.L.L. Polychrome IV, Grafelfing, Germany) and the fluorescence emission (>515 nm) was detected using a cooled, interline transfer CCD-camera system (Imago, T.I.L.L. Photonics, Grafelfing, Germany). Image sequences were collected after 4 × 4 binning of the 344 × 260 line image in TILLvisION software (T.I.L.L. Photonics GmbH, Grafelfing, Germany). Movies and image sequences of Ca2+ activity in fundus cells were analysed and constructed using custom software (Volumetry G7wv, GWH). Movies were further processed for playback viewing using Quick Time player 7 (Apple Inc., C4 USA). A pseudo-coloured blue–green lookup table was used to recolour the movie. The average fluorescence throughout the entire movie was subtracted from a duplicate copy of the movie, then temporal averaging (t± 0.08 s) was applied. The average frequency of Ca2+ transients was calculated for 20 s before and after drug application. The following abbreviations were used throughout the analysis and figures: cpm, cycles per minute; c, cells; asterisk (*) motion/focus artifact).
Statistical analysis
The figures were constructed from digitized data using Adobe Photoshop 4.0.1 (Adobe Co., Mountain View, CA, USA), Excel and PowerPoint 2011 (Microsoft, Redmond, WA, USA). The bar graphs represent the means from each experiment and ‘n’ values refer to the number of animals. Data are expressed as means ± standard error of the mean. Statistical significance was calculated using either Student's t test or a one-way ANOVA followed by a post Newman–Keuls test. P values of <0.05 were considered to represent significant changes.
Results
Distribution of PDGFRα+ cells in the gastric fundus
The distribution of PDGFRα+ cells in the fundus included intramuscular (IM) cells that were intermingled in circular muscle (CM) bundles, similar intramuscular cells that were present in longitudinal muscle (LM) bundles, and more stellate-shaped cells that were found in the plane between CM and LM, in the region of the myenteric plexus (MY). These cells were found in equivalent density and with similar distributions in wild-type and genetically engineered eGFP-PDGFRα+ mice. Immunohistochemistry using PDGFRα antibodies in wild-type fundus showed that intramuscular PDGFRα+ cells (PDGFRα+-IM) were arranged in parallel to smooth muscle bundles in the CM and LM layers (Fig. 1A and D). In the myenteric region, myenteric PDGFRα+ cells (PDGFRα+-MY) were characterized as extensively branching cells with multipolar cell bodies and long processes (Fig. 1G and J). PDGFRα immunopositive cells were distinct from ICC-IM (Kit+) (Fig. 1B and E) in the CM and LM muscle layers as shown by double labelling (Fig. 1C and F). No Kit-like immunoreactivity was resolved in the myenteric region (Fig. 1H); however, PDGFRα+-MY cells were prominent (Fig. 1G and I). These data clearly show that PDGFRα+ cells are a class of interstitial cells distinct from ICC in the gastric fundus.
Figure 1. Distribution of PDGFRα+ cells in the fundus.
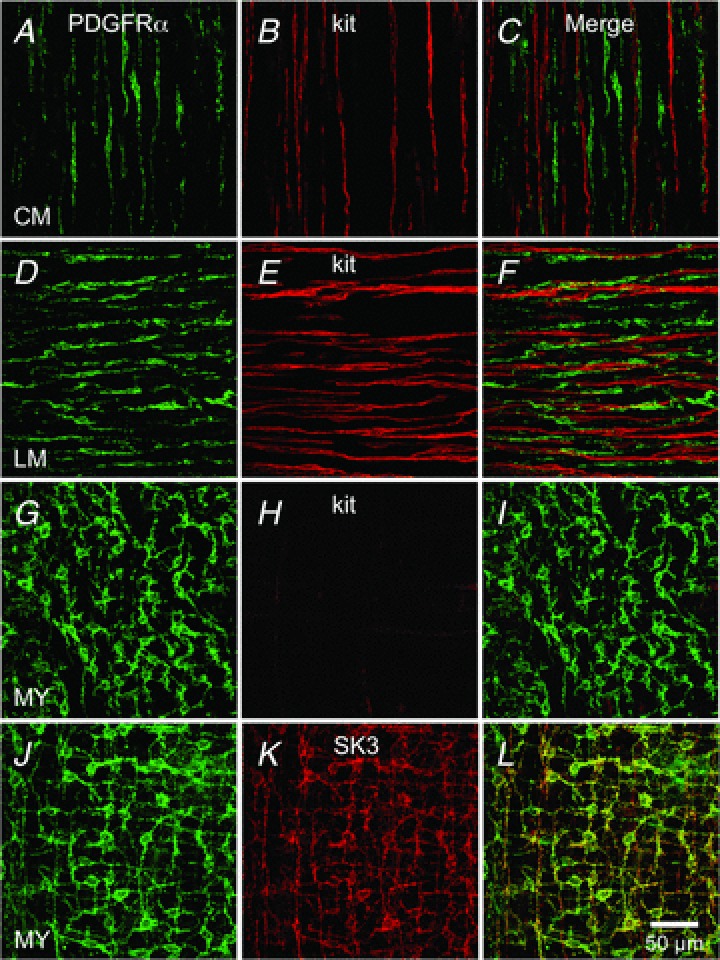
Whole mount double immunolabelling for PDGFRα (green) and Kit (red) in circular muscle layer (CM; A–C), in the longitudinal muscle layer (LM; D–F) and in the region of the myenteric plexus (MY; G–I). No co-localization was observed between PDGFRα+ cells and Kit+ cells in any muscle layer (C, F and I). J–L, immunolabelling for PDGFRα (green) and SK3 (red) in MY region of gastric fundus. Expression of SK3 channels is observed in PDGFRα cells in the fundus. Scale bar in L is 50 μm and pertains to all panels.
PDGFRα+ cells express SK3 channels
We and others have shown that SK3 channel immunoreactivity is prominent in PDGFRα+ cells from GI muscles and bladder of several species (i.e. colon, small intestine, detrusor) (Fujita et al. 2003; Iino & Nojyo, 2009; Kurahashi et al. 2011, 2012; Grover et al. 2012; Koh et al. 2012; Lee et al. 2013). SK3-like immunoreactivity was also present in PDGFRα+ cells in fundus muscles. PDGFRα+ cells co-labelled with SK3 antibodies labelled PDGFRα+-IM and PDGFRα+-MY throughout the fundus (Fig. 1K and L, Supplemental Fig. S1, available online).
Distribution of PDGFRα+ cells in relation to motor nerves
The distribution of PDGFRα+ cells in relation to enteric neurons was evaluated in whole mount preparations double immunolabelled for PDGFRα and the neuronal marker, PGP 9.5. PDGFRα+ cells were closely associated with PGP 9.5 immunoreactive neurons in CM and LM (Fig. 2A–C and Supplemental Fig. S2). PDGFRα+ cells were also in close proximity to neuronal nitric oxide synthase (nNOS)-positive inhibitory motor neurons, as observed in the double immunolabelling in all muscle layers (Fig. 2D–F and Supplemental Fig. S3). PDGFRα+ cells were also closely associated with vesicular acetylcholine transporter (vAChT)-positive neurons (Fig. 2G–I and Supplemental Fig. S4).
Figure 2. Relation of PDGFRα+ cells to motor nerves in the fundus.
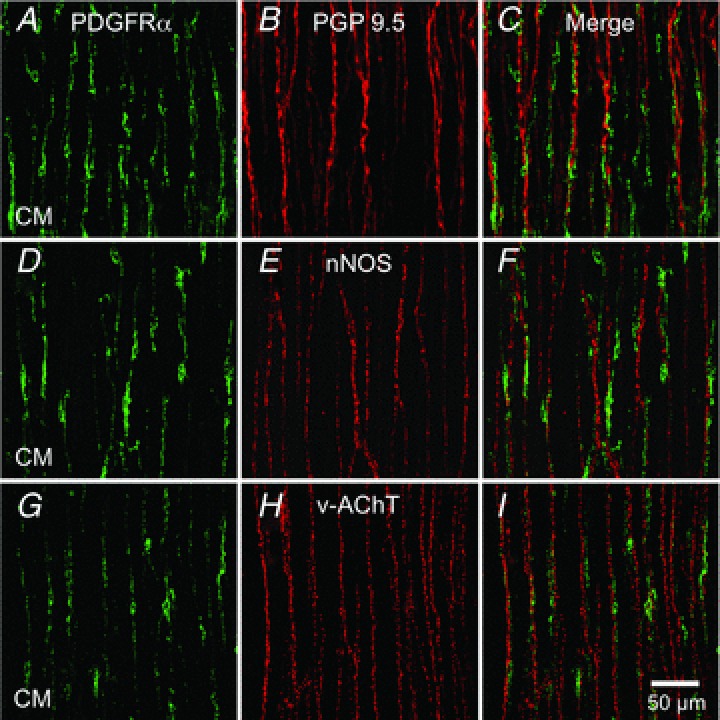
Whole mount double immunolabelling for PDGFRα (green) and the pan neuronal marker PGP 9.5 (red) (A–C), double immunolabelling for PDGFRα (green) and nNOS (red) (D–F), double immunolabelling for PDGFRα (green) and vAChT (red) (G–I) in circular muscle layer (CM) of the fundus. PDGFRα+ cells track closely along the processes of enteric motor neurons in both muscle layers. Scale bar in I is 50 μm and pertains to all panels.
Nuclear eGFP as a reporter for PDGFRα+ cells
Mice that express a histone 2B–eGFP fusion protein in cells expressing PDGFRα receptors were used to identify PDGFRα+ cells in fundus muscles. A network of fluorescent cells (with eGFP confined to the nuclei) was observed in fundus muscles of these mice (Fig. 3A, D and G), and double labelling with PDGFRα antibodies confirmed that eGFP nuclei cells are PDGFRα+ cells in all muscle layers (Fig. 3C, F and I).
Figure 3. Nuclear eGFP driven off promoter for Pdgfra is an accurate reporter for PDGFRα+ cells.
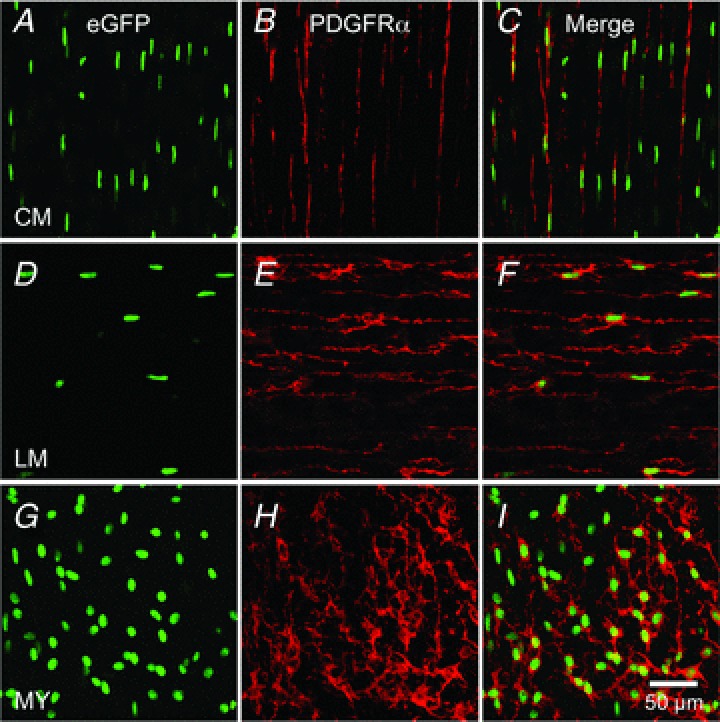
Whole mount immunolabelling for eGFP (green) and PDGFRα (red) in circular muscle layer (CM; A–C), in the longitudinal muscle layer (LM; D–F) and in the region of the myenteric plexus (MY; G–I) of murine gastric fundus. eGFP is confined to nuclei because it is fused to histone 2B, while PDGFRα is expressed in plasma membranes. Scale bar in I is 50 μm and pertains to all panels.
Molecular expression of P2Y receptors and SK channels in PDGFRα+ cells
It has been suggested that PDGFRα+ cells are involved in purinergic neurotransmission via P2Y1 and subsequent SK channel activation (Cobine et al. 2011; Kurahashi et al. 2011; Lee et al. 2013). Therefore we examined the expression of P2Y receptors and SK channels in PDGFRα+ cells. Fundus muscles were dispersed enzymatically, and PDGFRα+ cells were collected by FACS using the eGFP reporter in eGFP-PDGFRα+ muscles. Quantitative PCR (qPCR) was performed on cDNAs prepared from sorted PDGFRα+ cells and compared to unsorted cells representing the total cell population from fundus muscles. We evaluated the expression of P2Y receptors (i.e. P2ry1, P2ry2, P2ry4, P2ry6, P2ry12, P2ry13 and P2ry14) and found robust expression of P2ry1 in comparison to other receptors examined (fold change = 7.1 ± 0.76, PDGFRα+ sorted cells = 0.18 ± 0.02, unsorted cells = 0.025 ± 0.002, P value = 0.002; Fig. 4A). We also observed a higher expression of P2ry2 (fold change = 1.6 ± 0.16, PDGFRα+ sorted cells = 0.02 ± 0.002, unsorted cells = 0.012 ± 0.001, P value = 0.003; Fig. 4A) and P2ry4 receptors in PDGFRα+ cells (fold change = 1.67 ± 0.09, PDGFRα+ sorted cells = 0.009 ± 0.0005, unsorted cells = 0.005 ± 0.0003, P value = 0.003; Fig. 4A). Other P2Y receptors (P2ry6, P2ry12, P2ry13 and P2ry14) demonstrated no significant increase in expression in PDGFRα+ cells (fold change: P2ry6=−1.1 ± 0.1, P2ry12=−1.2 ± 0.08, P2ry13=−1.25 ± 0.09 and P2ry14=−1.0 ± 0.06; Fig. 4A). We also evaluated the expression of SK channels (Kcnn1, Kcnn2 and Kcnn3) and found high expression of Kcnn3 (SK3) subtype in PDGFRα+ cells in comparison to unsorted cells (fold change = 8.4 ± 0.75, PDGFRα+ sorted cells = 0.18 ± 0.016, unsorted cells = 0.02 ± 0.002, P value = 0.001; Fig. 4B). Kcnn1 and Kcnn2 demonstrated low expression in PDGFRα+ cells, Kcnn1 (fold change =−1.42 ± 0.06) and Kcnn2 (fold change =−5.18 ± 0.53; Fig. 4B). We also examined the expression of Kcnma1 (BK channel α subunit, α-Slo) in PDGFRα+ cells and found a low expression of α-Slo in this cell type (fold change =−11.8 ± 0.56; Fig. 4B). The data demonstrate robust expression of P2Y1 receptors and SK3 channels in PDGFRα+ cells of the fundus.
Figure 4. Expression of purinergic P2Y receptors and SK channels in PDGFRα+ cells.
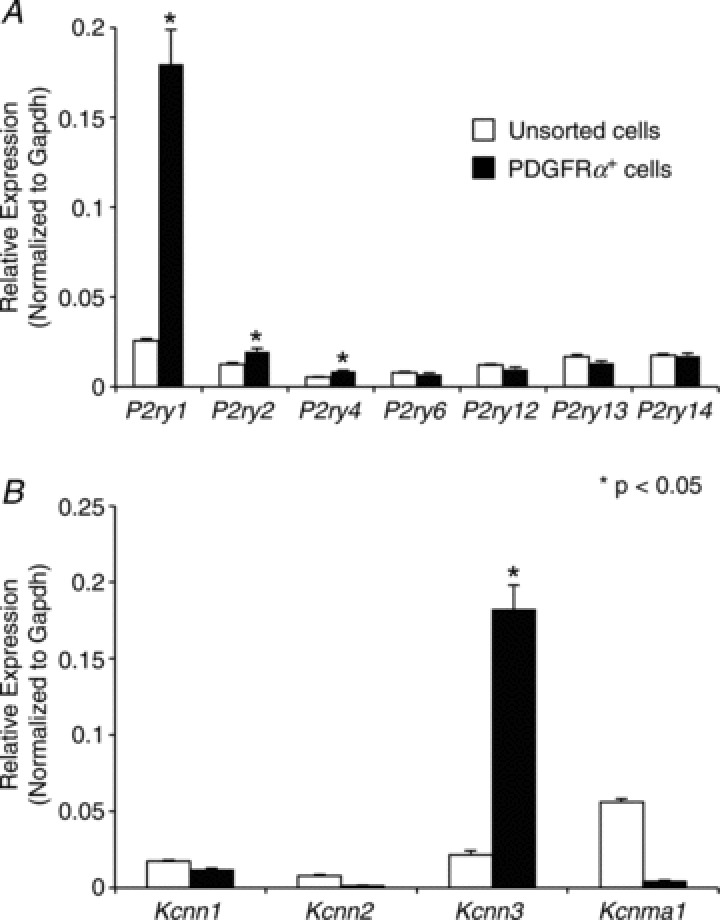
A, relative expression comparison of P2Y receptor transcripts (P2ry1, P2ry2, P2ry3, P2ry4, P2ry6, P2ry12, P2ry13 and P2ry14) in sorted PDGFRα+ cells vs. unsorted cells (i.e. dispersions of fundus muscles prior to sorting) revealed by qPCR. Note P2ry1 relative expression was 7.1-fold higher in PDGFRα+ cells (n= 6, P value = 0.002). B, qPCR comparison of SK1, SK2, SK3 and α-Slo expression (Kcnn1, Kcnn2, Kcnn3 and Kcnma1) in sorted-PDGFRα+ cells vs. unsorted cells. Note: Kcnn3 expression was 8.4-fold higher in sorted PDGFRα+ cells (n= 6, P value = 0.001). The relative expression of each gene was normalized to the house-keeping gene GAPDH.
Ca2+ signalling in PDGFRα+ cells
Ca2+ imaging was performed on muscles of eGFP-PDGFRα+ mice to examine spontaneous Ca2+ transients and purinergic responses of PDGFRα+ cells. This technique allowed unequivocal identification of PDGFRα+ cells (eGFP expression in nuclei) and did not obscure resolution of cytoplasmic Ca2+ transients. PDGFRα+-MY (Fig. 5A) were found at an average density of 408 ± 28 cells mm-2 (n= 14) and with average minimum separation between cell bodies of 34.6 ± 1.8 μm (n= 14; c= 213; Fig. 5B).
Figure 5. Spontaneous Ca2+ transients in PDGFRα+ cells.
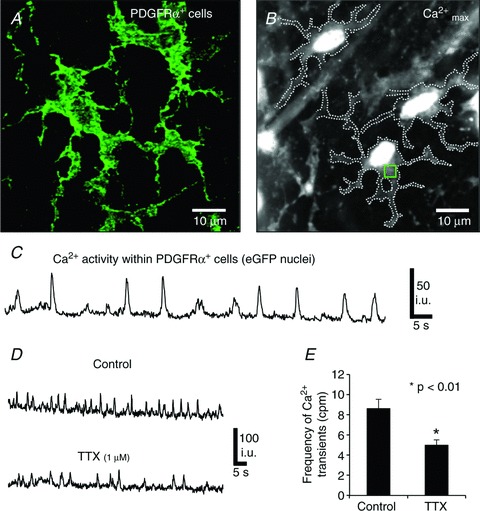
A, PDGFRα+ cells in the myenteric region at high magnification (×100). B, An image of maximum Ca2+ fluorescence within eGFP-PDGFRα+ cells. Dotted lines demarcate the cell edges and the square (green) refers to the region of interest in which Ca2+ transients were measured (ROI). C, spontaneous Ca2+ transients in PDGFRα+ cells in the absence of any added drugs. D, spontaneous Ca2+ transients in PDGFRα+ cells before and after TTX (1 μm). E, summary of TTX effects on the frequency of spontaneous Ca2+ transients in PDGFRα+ cells (n= 6, c= 12; P value = 0.008). The bar graphs represent the average means from each experiment and n number represents each experiment.
Under basal conditions Ca2+ transients were resolved in many PDGFRα+ cells within a given field (e.g. 24.2 ± 5% of cells generated spontaneous Ca2+ transients at a frequency of 7.1 ± 0.8 cpm, (range 2–16 cpm); n= 10; Fig. 5C). Spontaneous Ca2+ transients were not resolved in the remainder of PDGFRα+ cells. Pretreatment of fundus tissues with 1 μm tetrodotoxin (TTX) decreased, but did not abolish spontaneous Ca2+ transients in PDGFRα+ cells (i.e. frequency: 5.1 ± 0.5 cpm, n= 6, c= 12, compared to the control frequency of 8.6 ± 0.94 cpm in the muscles, n= 6, c= 12, P value = 0.008; Fig. 5D and E, respectively).
Next we examined the responses of PDGFRα+ cells to a variety of purine agonists and antagonists. All of these experiments were performed in the continued presence of l-NNA (100 μm) and atropine (1 μm) to distinguish purinergic responses from nitrergic and cholinergic influences. The average activity of spontaneous Ca2+ transients in PDGFRα+ cells used in this part of the study was 6.68 ± 1.4 cpm (n= 25, c= 64).
A single bolus application of ATP (100 μm) increased the frequency of Ca2+ transients in PDGFRα+ cells (Fig. 6A and B). These responses were typically characterized by an initial sustained rise in fluorescence that tapered off gradually and lasted, on average for 8.7 ± 0.86 s (n= 12, c= 24; Fig. 6A). The sustained rise was followed by a period of oscillatory Ca2+ waves that lasted through the recording window (Fig. 6A and B). ATP increased the frequency of Ca2+ transients to 20 ± 2.16 cpm (n= 12, c= 24, P value = 0.0001; Fig. 6A and K).
Figure 6. Responses of PDGFRα+ cells to purines (ATP, ADP, β-NAD, UTP and UDP) and P2Y1 agonist MRS-2365.
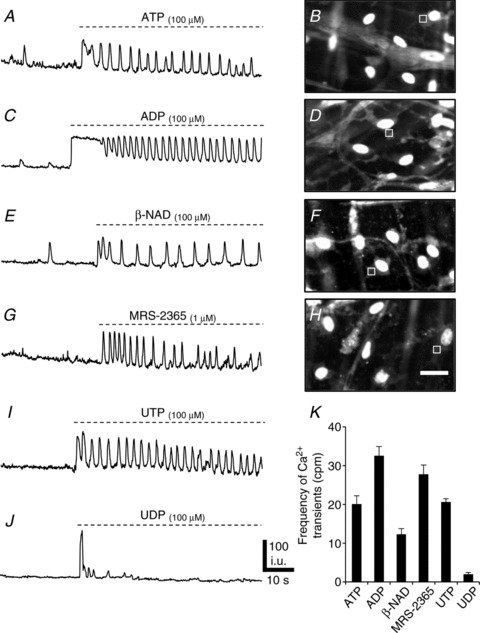
A, Ca2+ transients in an ROI (square in B) in a PDGFRα+ cell elicited by ATP (100 μm) (n= 12, c= 24; P value = 0.0001). B, image of Ca2+ transients in eGFP-PDGFRα+ (eGFP nuclei) cells in response to ATP. The Ca2+ transients were recorded in ROI denoted by the square. C, an example of Ca2+ transients in an ROI (square in D) in a PDGFRα+ cell elicited by ADP (100 μm) (n= 12, c= 24; P value = 0.0001). D, image of Ca2+ transients in eGFP-PDGFRα+ cells in response to ADP. E, Ca2+ transients elicited in a PDGFRα+ cell (ROI: square in F) by β-NAD (100 μm) (n= 12, c= 22; P value = 0.02). F, image of Ca2+ transients in eGFP-PDGFRα+ (eGFP nuclei) in response to β-NAD. G, Ca2+ transients elicited in a PDGFRα+ cell (ROI: square in H) in response to MRS-2365 (1 μm). H, image of Ca2+ transients in eGFP-PDGFRα+ in response to MRS-2365 (n= 12, c= 22; P value = 0.0001). I, Ca2+ transients elicited in a PDGFRα+ cell in response to UTP (100 μm) (n= 6, c= 14; P value = 0.0001). J, Ca2+ transients elicited in a PDGFRα+ cell in response to UDP (100 μm) (n= 5, c= 10; P value = 0.0001). K, summary of changes in the frequency of Ca2+ transients in response to purines (each bar in the graph represents the average of the frequency of Ca2+ transients in response to a given purine and the n value represents the number tissues exposed to each purine). Scale bar in H is 20 μm and pertains to B, D and F panels.
ADP (100 μm) evoked Ca2+ responses in the PDGFRα+ cells consisting of a sustained Ca2+ transient that gradually tapered off after 11.6 ± 0.9 s (n= 12, c= 24; Fig. 6C and D). The sustained phase was followed by increased Ca2+ waves at a frequency of 32.4 ± 2.53 cpm (n= 12, c= 24, P value = 0.0001; Fig. 6C and K and Supplemental Movie S1, available online).
β-NAD, a candidate for the purine neurotransmitter in GI muscles (Mutafova-Yambolieva et al. 2007), also evoked Ca2+ responses in PDGFRα+ cells similar to those evoked by ATP and ADP (Fig. 6E and F). A brief bolus application of β-NAD (100 μm) increased the frequency of Ca2+ transients. The response included an initial sustained rise in fluorescence lasting 3.3 ± 0.31 s (n= 12, c= 22; Fig. 6E) and then sustained increase in Ca2+ oscillations averaging 12.2 ± 1.55 cpm (n= 12, c= 22, P value = 0.02; Fig. 6E and K).
The effects of uridine 5′-triphosphate (UTP) and uridine 5′-diphosphate (UDP) were also examined. UTP (100 μm) evoked Ca2+ responses in the PDGFRα+ cells consisting of a sustained Ca2+ transient that gradually tapered off after 4.9 ± 0.51 s (n= 6, c= 14; Fig. 6I). The sustained phase was followed by increased Ca2+ waves at a frequency of 20.5 ± 0.9 cpm (n= 6, c= 14, P value = 0.0001; Fig. 6I and K). UDP evoked a small sustained Ca2+ transient that gradually tapered off after 2.4 ± 0.42 s (n= 5, c= 10; Fig. 6J). UDP had no effect on the frequency of Ca2+ waves, except in a few quiescent cells that showed a small increase in Ca2+ transient frequency of 1.89 ± 0.57 cpm (n= 5, c= 10, P value = 0.0001; Fig. 6J and K). These experiments demonstrate the ability of PDGFRα+ cells to generate intracellular Ca2+ waves in response to purine compounds suggested to be purine neurotransmitters. In comparison, it should be noted that we did not resolve Ca2+ transients in the adjacent SMCs after the addition of purines.
Ca2+ transients were asynchronous in PDGFRα+ cells
PDGFRα+ cells exhibited spontaneous asynchronous Ca2+ waves that spread across cell bodies and occasionally invaded processes. Ca2+ waves spread with an average velocity within cells of 45.2 ± 1.4 μm s−1 (c= 37, n= 6; Fig. 7A). There was no apparent synchronization in the occurrence of spontaneous Ca2+ transients in adjacent PDGFRα+ cells, nor was there any evidence for propagation of spontaneous transients from cell to cell (Fig. 7B and C), suggesting that these events were localized and stochastic phenomena in cells. As described above, purines (e.g. ADP) increased Ca2+ transients. Within individual PDGFRα+ cells the propagation velocity of Ca2+ waves increased to 51 ± 2 μm s−1 in the presence of ADP (c= 34, n= 6, P value = 0.026; Fig. 7D). Ca2+ waves in adjacent cells were not synchronized by the addition of purines (Fig. 7D), and no evidence for cell-to-cell propagation of Ca2+ waves was observed.
Figure 7. Asynchronous Ca2+ waves in PDGFRα+ cells.
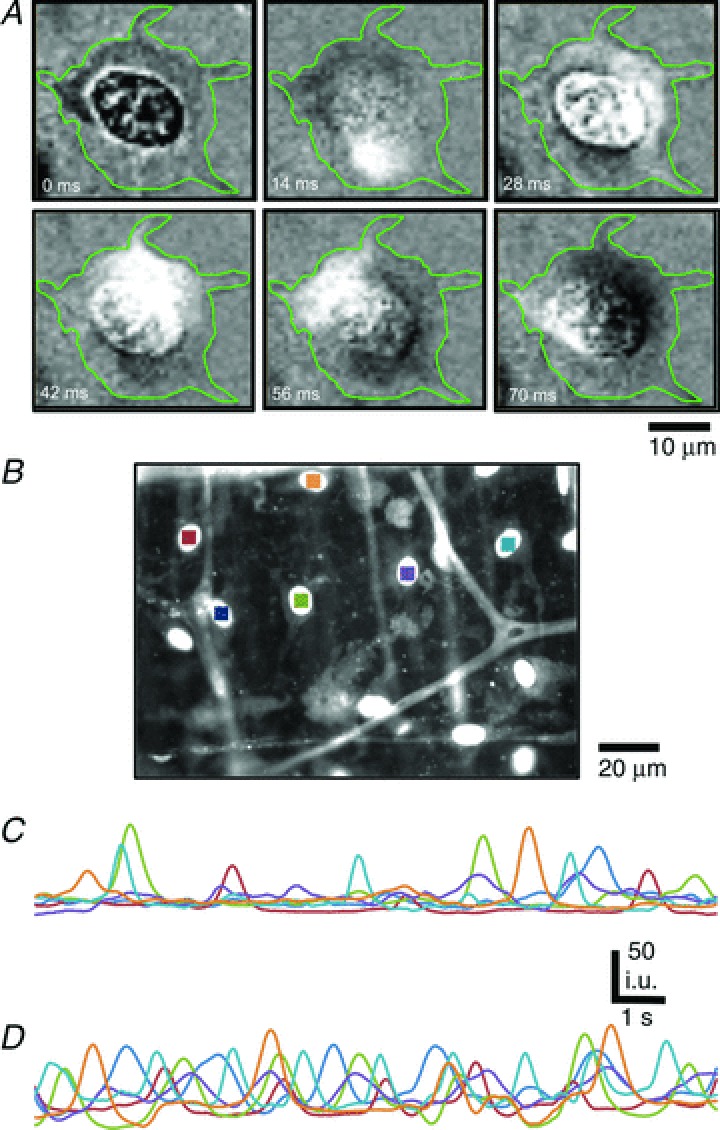
A, representative time-sequence images of a spontaneous Ca2+ wave in a PDGFRα+ cell. The duration of the Ca2+ wave was 0.56 s. Images were background corrected and the green outlines in each image denote the cell boundary (n= 6, c= 37; scale bar is 10 μm). B-D, Ca2+ transients were monitored in PDGFRα+ cells before and after ADP. B, Ca2+ transients were recorded in arbitrary units from ROIs defined in several PDGFRα+ cells (coloured squares). Scale bar is 20 μm. C, cytosolic Ca2+ dynamics in 6 PDGFRα+ cells shown in coloured ROIs in C under control conditions and after ADP (D). Ca2+ transients were stochastic and non-propagating events in PDGFRα+ cells before and after stimulation with ADP (n= 6).
Role of P2Y1 receptors in purinergic responses of PDGFRα+ cells
Molecular studies showed a robust expression of P2Y1 receptors in PDGFRα+ cells of the fundus. Previous studies have shown that purinergic stimulation activates outward currents in single isolated PDGFRα+ cells (Kurahashi et al. 2011). Therefore, we evaluated the role of P2Y1 receptors in mediating the increase in Ca2+ transients in response to purinergic stimulation of PDGFRα+ cells.
Similar to the response of cells to primary purines, a robust increase in Ca2+ transients was elicited in PDGFRα+ cells in response to the P2Y1 receptor-specific agonist MRS-2365 (1 μm; Fig. 6G and H). MRS-2365 increased Ca2+ transient frequency to 27.7 ± 2.4 cpm (n= 12, c= 22; P value = 0.0001; Fig. 6G and I; Supplemental Movie S2). These responses were also characterized by a small, sustained rise in fluorescence that lasted for 0.8 ± 0.22 s (n= 12, c= 12; Fig. 6G).
Pre-treatment of muscles with MRS-2500 (1 μm), a highly selective antagonist of P2Y1 receptors, abolished Ca2+ waves elicited by β-NAD and MRS-2365 (Fig. 8D and E, respectively). Responses to ADP were also greatly diminished by MRS-2500, and the sustained Ca2+ oscillations typical of ADP stimulation were blocked in many cells (Fig. 8C). In 3 of 7 muscles Ca2+ oscillations persisted in a few PDGFRα+ cells per field of view (36 ± 4.34%; frequency = 17.4 ± 3.23 cpm). In contrast, after MRS-2500 pretreatment, ATP evoked Ca2+ transients in 60.2 ± 5.7% of PDGFRα+ cells (i.e. frequency = 14.84 ± 2.6 cpm, n= 6, c= 20; Fig. 8A and B, Cell 2), but failed to elicit Ca2+ responses in some cells (e.g. Fig. 8B, Cell 1).
Figure 8. Role of P2Y1 receptors in mediating Ca2+ transients in PDGFRα+ cells.
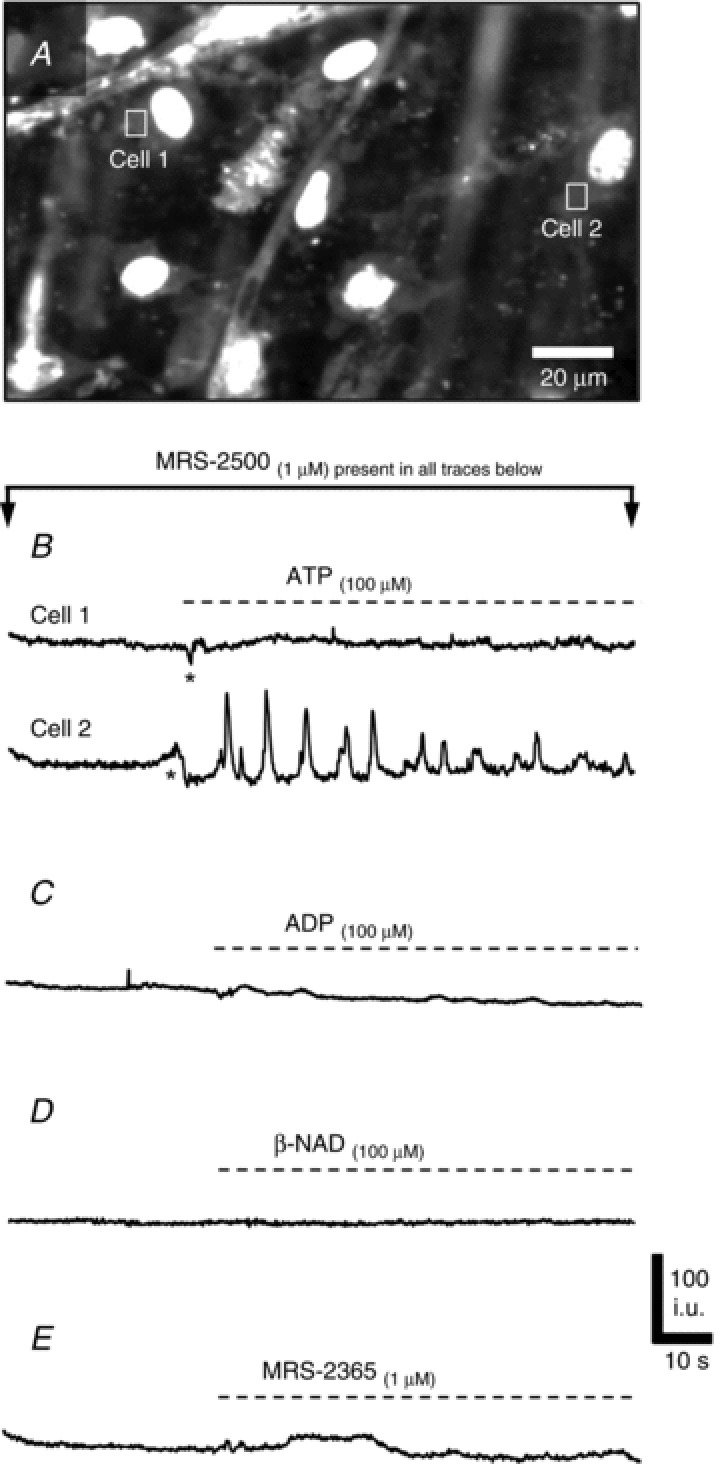
A–E, Ca2+ responses of PDGFRα+ cells in the presence of a P2Y1-receptor specific antagonist MRS-2500 (1 μm). A, example image of Ca2+ transients in eGFP-PDGFRα+ cells (eGFP nuclei) in response to ATP. B, example of Ca2+ transients in PDGFRα+ cells in response to ATP (100 μm). Cell 1 showed no response to ATP in the presence of MRS-2500 and Cell 2 showed an increase in Ca2+ transients (n= 6, c= 20; P value = 0.014). (ROIs of Cells 1 and 2 are marked by the squares in A) Ca2+ responses to ADP (C), β-NAD (D) and MRS-2365 (E) in PDGFRα+ cells were blocked by MRS-2500.
Responses of PDGFRα+ cells from P2ry1(−/−) mice
To verify the specificity of pharmacological treatments we also performed experiments on PDGFRα+ cells from mice deficient in P2Y1 receptors. We bred our reporter strain (Pdgfratm11(EGFP)Sor/J) mice into a strain of P2ry1(−/−) mice, creating mice deficient in P2Y1 receptors with constitutive expression of eGFP in PDGFRα+ cells. We confirmed PDGFRα and SK3 channel expression in these mice using immunohistochemistry and found normal density and distributions of PDGFRα+ cells in the absence of P2Y1 receptors (Fig. 9A and B).
Figure 9. Effects of ATP, ADP, β-NAD and MRS-2365 in PDGFRα+ cells from P2ry1(−/−) mice.
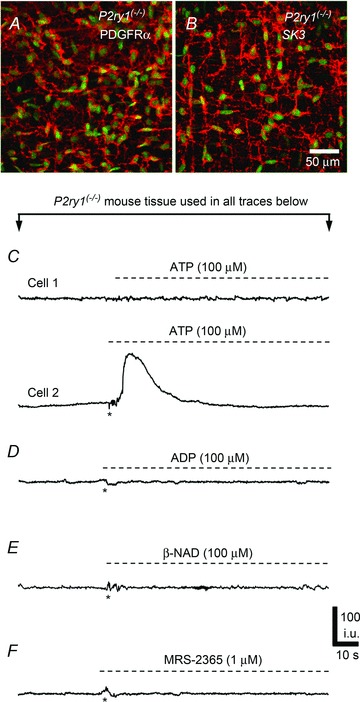
A, whole mount double immunolabelling for eGFP-PDGFRα (green eGFP nuclei) and PDGFRα (red, A) and SK3 (red, B) antibodies in PDGFRα+ cells from P2Y1(−/−) mice. C–F, Ca2+ transients in response to purines were attenuated in PDGFRα+ cells of P2Y1(−/−) mice. C, example of Ca2+ transients in PDGFRα+ cells in response to ATP (100 μm). No response was elicited in some cells (e.g. Cell 1), but others showed a rise in Ca2+ that gradually tapered off during the exposure (e.g. Cell 2; n= 5, c= 10). The other purines tested (ADP (D), β-NAD (E) and MRS-2365 (F)) failed to elicit Ca2+ transients in PDGFRα+ cells of P2Y1(−/−) mice. (For all C, D, E and F, n= 5).
Next, we examined the effects of purines on PDGFRα+ cells in the absence of P2Y1 receptors. ATP (100 μm) application to P2ry1(−/−) muscles yielded mixed responses; some PDGFRα+ cells showed little or no response to ATP (Fig. 9C, Cell 1) but others (32.6 ± 3.38%) displayed Ca2+ responses consisting of a sustained rise in Ca2+ that tapered off gradually and lasted 27.4 ± 2.16 s (n= 5, c= 10; Fig. 9C, Cell 2). Ca2+ oscillations were not observed in PDGFRα+ cells from P2ry1(−/−) mice. These data show that ATP can mediate its post-junctional effects in PDGFRα+ cells through purinergic receptors other than P2Y1 receptors. In contrast, the P2Y1-specific agonist MRS-2365 (1 μm) had no effect on Ca2+ transients in PDGFRα+ cells of P2ry1(−/−) mice (Fig. 9F). Similarly, neither ADP nor β-NAD (both 100 μm) elicited Ca2+ responses in PDGFRα+ cells deficient in P2Y1 receptors (Fig. 9D and E, respectively).
Contributions from extracellular and intracellular Ca2+ to transients in PDGFRα+ cells
The source(s) of Ca2+ contributing to Ca2+ responses in PDGFRα+ cells were examined in another series of experiments. Contributions from external Ca2+ ([Ca2+]o) were tested by substituting the normal 2.5 mm[Ca2+]o in KRB with KRB containing 0 mm[Ca2+]o (nominally free Ca2+ solution, 20 min). ATP and ADP elicited Ca2+ transients in PDGFRα+ cells in the presence of 0 mm[Ca2+]o. The frequency of the Ca2+ transients was reduced by 21.8% in response to ATP (frequency = 17.98 ± 2.14 cpm, n= 7, c= 14, P value = 0.02; Fig. 10B) and 26.5% in response to ADP (frequency = 20.45 ± 2.1 cpm, n= 7, c= 14, P value = 0.0017; Fig. 10A and B). We also noted a 27.3% reduction in Ca2+ transients frequency in response to MRS-2365 in the presence of 0 mm[Ca2+]o (frequency = 17.66 ± 1.2 cpm, n= 7, c= 14, P value = 0.01; Fig. 10B). These data suggest that purinergic responses of PDGFRα+ cells are not immediately dependent upon Ca2+ influx mechanisms; however, responses run down when [Ca2+]o is not sufficient to maintain intracellular stores.
Figure 10. Contribution of extracellular [Ca2+]o and SERCA pump to purinergic Ca2+ transients in PDGFRα+ cells.
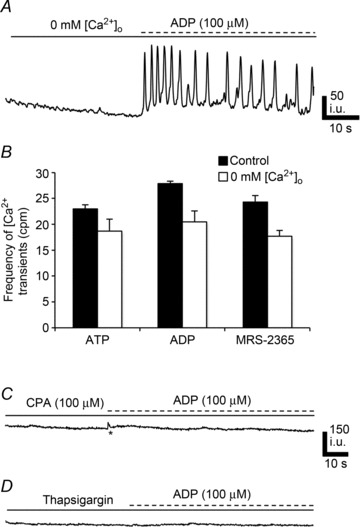
A, Ca2+ responses in PDGFRα+ cells to ADP (100 μm) were not blocked after bathing cells in 0 mm[Ca2+]o for 20 min. B, summary of Ca2+ transient frequency in PDGFRα+ cells in the presence of 2.5 mm[Ca2+]o (black) vs. 0 mm[Ca2+]o (white) in response to ATP (n= 7, c= 14; P value = 0.02), ADP (n= 7, c= 14; P value = 0.0017) and MRS-2365 (n= 7, c= 14; P value = 0.01). (Each bar in the graph represents the average of the frequency of Ca2+ transients in response to a given purine and the n value represents the number of tissues exposed to each purine). C, the SERCA pump inhibitor CPA (10 μm) blocked Ca2+ transients in PDGFRα+ cells in response to ADP (100 μm). D, pretreatment of PDGFRα+ cells with thapsigargin (1 μm) inhibited Ca2+ transients in response to ADP (100 μm). All n= 5.
We also examined the role of Ca2+ uptake and release mechanisms on purinergic responses of PDGFRα+ cells. CPA (10 μm) and thapsigargin (1 μm) pre-treatment blocked Ca2+ responses to ATP, ADP and β-NAD in PDGFRα+ cells (Fig. 10C and D). 2-APB (50 μm) caused significant reductions in Ca2+ transients elicited in PDGFRα+ cells by ATP (e.g. frequency = 7.5 ± 1.84 cpm, n= 5, c= 12, P value = 0.001; Fig. 11D), ADP (frequency = 5.51 ± 1.21 cpm, n= 5, c= 12, P value = 0.001; Fig. 11B and D), and β-NAD (frequency = 2.4 ± 0.5 cpm, n= 5, c= 10, P value = 0.001; Fig. 11D). 2-APB (100 μm) further attenuated purinergic responses: ATP (frequency = 0.55 ± 0.37 cpm, n= 5, c= 12, P value = 0.001; Fig. 11D), ADP (frequency = 0.38 ± 0.27 cpm, n= 5, c= 12, P value = 0.001; Fig. 11C and D), and β-NAD (frequency = 0.4 ± 0.24 cpm, n= 5, c= 10, P value = 0.001, Fig. 11D). The phospholipase C (PLC) inhibitor, U-73122 (10 μm) inhibited purinergic responses (n= 5, Fig. 11E); however, its inactive analogue U-73343 (10 μm) had no significant effect and the frequency of Ca2+ oscillations was not significantly different from control responses (P > 0.05, n= 4; Fig. 11F).
Figure 11. Role of IP3 receptor-operated stores and phospholipase C (PLC) in purinergic responses of PDGFRα+ cells.
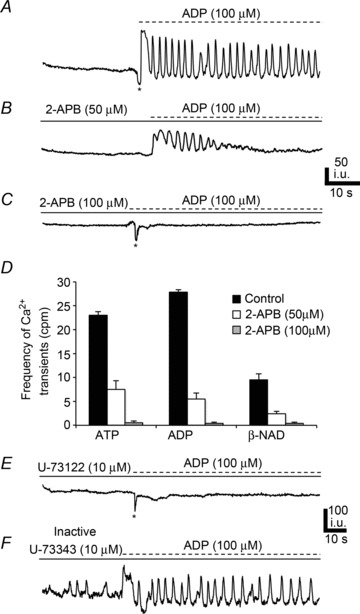
A, Ca2+ transients elicited in PDGFRα+ cells in response to ADP (100 μm). l-NNA (100 μm) and atropine (1 μm) present in all panels. B, 2-APB (50 μm) reduced Ca2+ transient frequency in PDGFRα+ cells (n= 5, c= 12; P value = 0.001). C, 2-APB (100 μm) blocked most of the response to ADP (n= 5, c= 12; P value = 0.001). D, summary of Ca2+ transient frequency in PDGFRα+ cells in response to purines (ATP, ADP and β-NAD) in control (black) and in the presence of 2-APB (50 μm; white) and 2-APB (100 μm; white with vertical lines) All n= 5. (Each bar in the graph represents the average of the frequency of Ca2+ transients in response to a given purine and the n value represents the number of tissues exposed to each purine). E, PLC inhibitor U-73122 (10 μm; n= 5) blocked responses to ADP in PDGFRα+ cells. However, the inactive analogue U-73343 (10 μm; n= 4) had no significant effect (F).
Caffeine (10 mm), an activator of ryanodine-sensitive channels, reduced Ca2+ transients in PDGFRα+ cells in response to purines: ATP (frequency = 14.9 ± 2.03 cpm, n= 5, c= 12, P value = 0.01; Fig. 12E), ADP (frequency = 17.5 ± 1.15 cpm, n= 5, c= 12, P value = 0.001; Fig. 12B and E), and β-NAD (frequency = 5.5 ± 0.57 cpm, n= 5, c= 12, P value = 0.01; Fig. 12E). Ryanodine (50 μm) also attenuated Ca2+ transients in response to purines: ATP (frequency = 13.55 ± 2.29 cpm, n= 5, c= 14, P value = 0.01; Fig. 12E), ADP (frequency = 11.15 ± 0.85 cpm, n= 5, c= 14, P value = 0.001; Fig. 12C and E), and β-NAD (frequency = 3.85 ± 0.42 cpm, n= 5, c= 14, P value = 0.001, Fig. 12E). It should also be noted that there was an increase in the number of PDGFRα+ cells exhibiting spontaneous Ca2+ transients in the presence of ryanodine in comparison to control conditions (i.e. 52.87 ± 5.1% displayed spontaneous transients in the presence of ryanodine and the frequency = 6.86 ± 0.89 cpm (Fig. 12C, Cell 1). Pre-exposure to ryanodine and 2-APB (50 μm) almost eliminated Ca2+ responses to ATP (frequency = 1.57 ± 0.71 cpm, n= 5, c= 12, P value = 0.001; Fig. 12E), ADP (frequency = 1.14 ± 0.59 cpm, n= 5, c= 12, P value = 0.001; Fig. 12C and E), and β-NAD (frequency = 1.05 ± 0.5 cpm, n= 5, c= 12, P value = 0.001, Fig. 12E).
Figure 12. Role of ryanodine receptors in purinergic responses of PDGFRα+ cells.
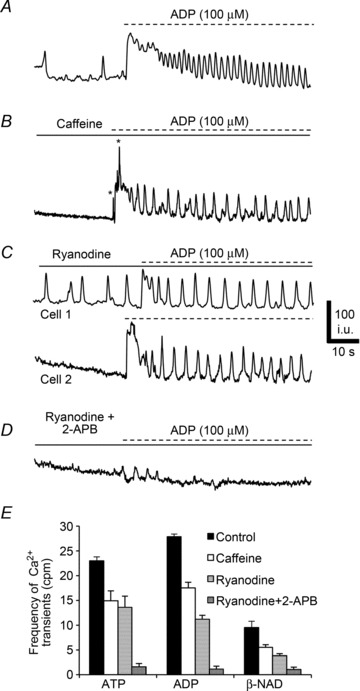
A, Ca2+ transients in PDGFRα+ cells after ADP (100 μm). All traces were recorded in the presence of l-NNA (100 μm) and atropine (1 μm). B, caffeine (10 mm) reduced the frequency of Ca2+ transients in PDGFRα+ cells elicited by ADP (n= 5, c= 12; P value = 0.001). C, ryanodine (50 μm) also reduced Ca2+ transients in PDGFRα+ cells (see Cell 1 and Cell 2; n= 5, c= 14; P value = 0.001). Some PDGFRα+ cells (e.g. Cell 1) displayed increased spontaneous Ca2+ transients in the presence of ryanodine. D, a combination of ryanodine (50 μm) and 2-APB (50 μm) blocked most of the Ca2+ transients in PDGFRα+ cells and responses to purines (n= 5, c= 12; P value = 0.001). E, summary of Ca2+ transient frequency in PDGFRα+ cells in response to purines (ATP and ADP and β-NAD, n= 15) control (black) and in the presence of caffeine (10 mm; white), ryanodine (50 μm; white with horizontal lines) and ryanodine and 2-APB together (50 μm; white cross hatched). Each bar in the graph represents the average of the frequency of Ca2+ transients in response to a given purine and the n value represents the number of tissues exposed to each purine.
Discussion
The present study documents the distribution of PDGFRα+ cells through the tunica muscularis of the murine gastric fundus. These cells were identified as ‘fibroblast-like’ in the classic morphological literature, but their close association with motor neurons, expression of receptors and effectors involved in purinergic motor responses, and gap junction coupling with smooth muscle cells suggests a more dynamic role for these cells in motor regulation than just maintenance of the extracellular matrix. There is an abundance of PDGFRα+ cells in the fundus, and significant numbers of these cells generated spontaneous Ca2+ transients. Spontaneous Ca2+ transients were isolated, stochastic events characterized by localized Ca2+ waves that failed to propagate to cells nearby. Purines activated dynamic Ca2+ transients in PDGFRα+ cells that were mediated by P2Y1 receptors and oscillatory release of Ca2+ from Ca2+ stores. Ca2+ transients evoked by purines were also localized to individual cells. Because PDGFRα+ cells also express small conductance Ca2+-activated K+ channels (SK3), it is likely that spontaneous and purine-activated Ca2+ transients are coupled to activation of outward currents in PDGFRα+ cells (as has been described in the colon; Kurahashi et al. 2011). Electrical coupling to SMCs suggests that purinergic responses in PDGFRα+ cells would couple to relaxation responses in the fundus.
We confirmed that PDGFRα+ cells are a special population of interstitial cells, distinct from ICCs in the gastric fundus, in agreement with previous reports in several GI muscles (Iino et al. 2009; Cobine et al. 2011; Kurahashi et al. 2011; Blair et al. 2012). One recent study claimed that Kit-positive cells (ICC) are also immunopositive for PDGFRα in bladder lamina propria and detrusor muscle (Monaghan et al. 2012). However, the absence of ICC-MY in the fundus myenteric region and the presence of an extensive branching network of PDGFRα+ cells observed in this study clearly confirms the existence of two independent populations of interstitial cells. Furthermore, we demonstrated the close association of PDGFRα+ cells to motor neurons in the gastric fundus as previously described for other GI muscles (Iino et al. 2009; Iino & Nojyo, 2009; Kurahashi et al. 2011, 2012). This morphological evidence of the distribution of PDGFRα+ cells across the gastric fundus as an integral part of the SIP syncytium indicates a role for them in regulating the excitability of gastric muscles.
Considerable evidence now suggests that PDGFRα+ cells are primary targets for purinergic neurotransmission in visceral smooth muscles (Kurahashi et al. 2011; Lee et al. 2013). Purinergic inhibitory responses in post-junctional cells are usually attributed to the activation of small conductance Ca2+-activated K+ (SK) channels (Banks et al. 1979; Mutafova-Yambolieva et al. 2007). In this study we found robust expression of SK3 channels in PDGFRα+ cells and not in SMCs or ICC. Interstitial cells (ICC-IM) are distributed in the gastric fundus and have been found to have a role in the mediation of excitatory cholinergic and inhibitory nitrergic neurotransmission signals (Burns et al. 1996; Ward et al. 2000, 2004; Beckett et al. 2002; Suzuki et al. 2003; Ward & Sanders, 2006). It has been observed that purinergic neurotransmission, which is manifest as fast inhibitory junction potentials, is intact in muscles of W/WV mice that lack ICC-IM (Burns et al. 1996), suggesting that ICC may have little role in purinergic responses. The direct involvement of SMCs in purinergic transmission is also unlikely since the net response of these cells to ATP at physiological holding potentials is activation of non-selective cationic channels and membrane depolarization (Monaghan et al. 2006). Additionally, SMCs respond to purines with a net inward current in bladder SMCs (Lee et al. 2013). These studies suggest the inability of ICC or SMCs to mediate purinergic responses, and they cannot account for the overall hyperpolarizing membrane potential by purines observed in GI muscles. PDGFRα+ cells have the necessary machinery to generate outward currents in response to purines (Kurahashi et al. 2011; Lee et al. 2013). This study adds another important piece of information by showing that PDGFRα+ cells also have the appropriate apparatus to generate intracellular Ca2+ transients in response to purines that may be the link to activate SK3 channels. Outward currents and hyperpolarization responses generated in PDGFRα+ cells can conduct to SMCs and ICC via gap junction couplings between these cells (Komuro et al. 1999; Fujita et al. 2003). Thus, purinergic responses in PDGFRα+ cells can be conveyed and regulate the excitability of the SIP syncytium.
Spontaneous Ca2+ transients in PDGFRα+ cells were attenuated by the neuronal blocker TTX, suggesting a possible role of PDGFRα+ cells in the basal regulation of tone in the proximal stomach through an ongoing release of neurotransmitters (purines). In a related study examining how purinergic neurotransmission affects spontaneous activity in colon muscle tissues, it was found that TTX and the SK channel blocker, apamin, inhibit spontaneous inhibitory junction potentials (IJPs) and increase basal contractile activity (Gil et al. 2010). It was also found that spontaneous IJPs are due to activation of the P2Y1 receptor, because the antagonist MRS-2500 inhibited IJPs.
It is widely accepted that P2Y receptors mediate purinergic neurotransmission in the gut (Giaroni et al. 2002; Gallego et al. 2006; Grasa et al. 2009a; Zhang et al. 2010), and P2Y1 receptors are the primary receptors responsible for fast IJPs (Gallego et al. 2006, 2012; Grasa et al. 2009a; Hwang et al. 2012). Several compounds have been claimed to be specific antagonists for P2Y1 receptors, but MRS-2500 has been reported to be the most potent and was therefore chosen for this study (Cattaneo et al. 2004; Grasa et al. 2009a,b). Ca2+ transients elicited by ADP, β-NAD and MRS-2365 in PDGFRα+ cells were blocked by MRS-2500. However, Ca2+ transients in response to ATP were retained in many PDGFRα+ cells, indicating that additional purinergic receptors are expressed by PDGFRα+ cells and available to ATP. Use of P2ry1(−/−) mice provided results similar to the results of studies using pharmacological agonists and antagonists of P2Y1 receptors. Ca2+ transients evoked by ADP, MRS-2365 and β-NAD were not observed in PDGFRα+ cells deficient in P2Y1 receptors. Responses to ATP could still be elicited in P2ry1(−/−) PDGFRα+ cells. P2Y2 receptors may have mediated the effects of ATP in PDGFRα+ cells in muscles of P2ry1(−/−) mice, because these receptors were expressed by PDGFRα+ cells and UTP also elicited Ca2+ transients in PDGFRα+ cells. P2Y2 receptors are equally sensitive to ATP and UTP but not sensitive to metabolites of ATP such as ADP (Velázquez et al. 2000). Like P2Y1 receptors, P2Y2 receptors are coupled to Ca2+ release via the PLC pathway (Murthy & Makhlouf, 1998). Expression of P2Y2 receptors by PDGFRα+ cells may explain the purinergic effects independent of P2Y1 receptors observed in this study.
Ca2+ transients in PDGFRα+ cells appear to be due to release of Ca2+ from intracellular stores, because reduction in [Ca2+]o for 20 min did not block responses to purines. Blocking Ca2+ uptake into stores with SERCA pump inhibitory drugs blocked Ca2+ transients evoked by purines. Ca2+ release mechanisms may require synergism between IP3 and ryanodine receptors because blockers of both channels were necessary to eliminate Ca2+ transients. 2-APB was used as a blocker of IP3-dependent Ca2+ release, but this drug has some non-specific effects such as inhibition of SERCA pumps and block of store-operated Ca2+ channels in the plasma membrane (Bootman et al. 2002; Peppiatt et al. 2003). Further investigation will be needed with more highly selective IP3 receptor antagonists and/or experiments using IP3 receptor knockout animals.
In summary this study established the ability of the PDGFRα+ class of interstitial cells to respond to purines in situ. Previous studies showed the activation of Ca2+-activated outward currents in isolated PDGFRα+ cells, and this study provides a mechanism for activation of Ca2+-activated currents through oscillatory release of Ca2+ from internal stores. A significant percentage of PDGFRα+ cells generated Ca2+ transients spontaneously, and some of this activity was related to tonic inhibitory input from motor neurons. Thus, PDGFRα+ cells may be involved in setting the basal excitability and tone of the proximal stomach. We also found that Ca2+ release was activated by a variety of purine compounds, and responses to ADP, β-NAD and MRS-2365 were mediated via P2Y1 receptors. Responses to these purines are analogous to the responses elicited in intact muscles by the purine neurotransmitter released from enteric inhibitory motor neurons. Ca2+ transients were also evoked in PDGFRα+ cells by ATP, but these responses appeared to be mediated through receptors in addition to P2Y1, possibly the P2Y2 receptors expressed by these cells. Activation of outward currents and hyperpolarization responses in PDGFRα+ cells can be conveyed via gap junctions to the other cell types in the SIP syncytium and thereby regulate the excitability of this cellular network in the gastric fundus.
Acknowledgments
The authors are grateful to the following people for their help: Yasuko Nakano for immunohistochemistry, Lauren Peri for molecular expression studies, Byoung Koh for FACS analysis studies, and Nancy Horowitz for mice maintenance.
Glossary
Abbreviations
- 2-APB
2-aminoethyl diphenylborinate
- c
number of cells
- CM
circular muscle
- CPA
cyclopiazonic acid
- cpm
cycles per minute
- eGFP
enhanced green fluorescent protein
- FACS
fluorescence-activated cell sorting
- GAPDH
glyceraldehyde-3-phosphate dehydrogenase
- GI
gastrointestinal
- ICC
interstitial cells of Cajal
- IJP
inhibitory junction potential
- IM
intramuscular
- IP3
inositol 1,4,5-trisphosphate
- KRB
Krebs–Ringer bicarbonate
- LM
longitudinal muscle
- MY
myenteric plexus
- β-NAD
β-nicotinamide adenine dinucleotide
- l-NNA
Nω-nitro-l-arginine
- nNOS
neuronal nitric oxide synthase
- PDGFRα
platelet-derived growth factor receptor α
- PGP 9.5
protein gene product 9.5
- PLC
phospholipase C
- P2Y1
purinergic receptor subtype
- ROI
region of interest
- SERCA
sarcoendoplasmic reticulum (SR) Ca2+ ATPase
- SIP
SMC/ICC/PDGFRα+
- SK3
small conductance Ca2+-activated K+ channel
- SMC
smooth muscle cell
- TTX
tetrodotoxin
- UTP
uridine 5′-triphosphate
- vAChT
vesicular acetylcholine transporter
Additional Information
Competing interests
None declared.
Author contributions
Conception and design of the experiments: S.A.B., G.W.H., S.M.W. and K.M.S. Collection, analysis and interpretation of data: S.A.B., G.W.H., A.K.S., M.K., S.M.W. and K.M.S. Drafting the article or revising it critically for important intellectual content: S.A.B., S.M.W. and K.M.S. All authors read and approved the manuscript for submission.
Funding
Funding for this study was provided by RO1 DK091336 to K.M.S. and DK57236 to S.M.W. The animal breeding, immunohistochemistry and molecular expression studies were performed by Core Labs supported by NIDDK grant P01-DK41315.
Supplementary material
Supplemental Table S1
Supplemental Fig. S2
Supplemental Fig. S3
Supplemental Fig. S4
Supplemental Movie S1
Supplemental Movie S2
References
- Banks BE, Brown C, Burgess GM, Burnstock G, Claret M, Cocks TM, Jenkinson DH. Apamin blocks certain neurotransmitter-induced increases in potassium permeability. Nature. 1979;282:415–417. doi: 10.1038/282415a0. [DOI] [PubMed] [Google Scholar]
- Beckett EA, Horiguchi K, Khoyi M, Sanders KM, Ward SM. Loss of enteric motor neurotransmission in the gastric fundus of Sl/Sld mice. J Physiol. 2002;543:871–887. doi: 10.1113/jphysiol.2002.021915. [DOI] [PMC free article] [PubMed] [Google Scholar]
- Blair PJ, Bayguinov Y, Sanders KM, Ward SM. Relationship between enteric neurons and interstitial cells in the primate gastrointestinal tract. Neurogastroenterol Motil. 2012;24:e437–e449. doi: 10.1111/j.1365-2982.2012.01975.x. [DOI] [PMC free article] [PubMed] [Google Scholar]
- Bootman MD, Collins TJ, Mackenzie L, Roderick HL, Berridge MJ, Peppiatt CM. 2-Aminoethoxydiphenyl borate (2-APB) is a reliable blocker of store-operated Ca2+ entry but an inconsistent inhibitor of InsP3-induced Ca2+ release. FASEB J. 2002;16:1145–1150. doi: 10.1096/fj.02-0037rev. [DOI] [PubMed] [Google Scholar]
- Burns AJ, Lomax AE, Torihashi S, Sanders KM, Ward SM. Interstitial cells of Cajal mediate inhibitory neurotransmission in the stomach. Proc Natl Acad Sci U S A. 1996;93:12008–12013. doi: 10.1073/pnas.93.21.12008. [DOI] [PMC free article] [PubMed] [Google Scholar]
- Cattaneo M, Lecchi A, Ohno M, Joshi BV, Besada P, Tchilibon S, Lombardi R, Bischofberger N, Harden TK, Jacobson KA. Antiaggregatory activity in human platelets of potent antagonists of the P2Y1 receptor. Biochem Pharmacol. 2004;68:1995–2002. doi: 10.1016/j.bcp.2004.06.026. [DOI] [PMC free article] [PubMed] [Google Scholar]
- Cobine CA, Hennig GW, Kurahashi M, Sanders KM, Ward SM, Keef KD. Relationship between interstitial cells of Cajal, fibroblast-like cells and inhibitory motor nerves in the internal anal sphincter. Cell Tissue Res. 2011;344:17–30. doi: 10.1007/s00441-011-1138-1. [DOI] [PMC free article] [PubMed] [Google Scholar]
- Fujita A, Takeuchi T, Jun H, Hata F. Localization of Ca2+-activated K+ channel, SK3, in fibroblast-like cells forming gap junctions with smooth muscle cells in the mouse small intestine. J Pharmacol Sci. 2003;92:35–42. doi: 10.1254/jphs.92.35. [DOI] [PubMed] [Google Scholar]
- Gallego D, Gil V, Aleu J, Martinez-Cutillas M, Clave P, Jimenez M. Pharmacological characterization of purinergic inhibitory neuromuscular transmission in the human colon. Neurogastroenterol Motil. 2011;23:e792–e338. doi: 10.1111/j.1365-2982.2011.01725.x. [DOI] [PubMed] [Google Scholar]
- Gallego D, Gil V, Martinez-Cutillas M, Mane N, Martin MT, Jimenez M. Purinergic neuromuscular transmission is absent in the colon of P2Y1 knocked out mice. J Physiol. 2012;590:1943–1956. doi: 10.1113/jphysiol.2011.224345. [DOI] [PMC free article] [PubMed] [Google Scholar]
- Gallego D, Hernandez P, Clave P, Jimenez M. P2Y1 receptors mediate inhibitory purinergic neuromuscular transmission in the human colon. Am J Physiol Gastrointest Liver Physiol. 2006;291:G584–G594. doi: 10.1152/ajpgi.00474.2005. [DOI] [PubMed] [Google Scholar]
- Giaroni C, Knight GE, Ruan HZ, Glass R, Bardini M, Lecchini S, Frigo G, Burnstock G. P2 receptors in the murine gastrointestinal tract. Neuropharmacology. 2002;43:1313–1323. doi: 10.1016/s0028-3908(02)00294-0. [DOI] [PubMed] [Google Scholar]
- Gil V, Gallego D, Grasa L, Martin MT, Jimenez M. Purinergic and nitrergic neuromuscular transmission mediates spontaneous neuronal activity in the rat colon. Am J Physiol Gastrointest Liver Physiol. 2010;299:G158–G169. doi: 10.1152/ajpgi.00448.2009. [DOI] [PubMed] [Google Scholar]
- Grasa L, Gil V, Gallego D, Martin MT, Jimenez M. P2Y1 receptors mediate inhibitory neuromuscular transmission in the rat colon. Br J Pharmacol. 2009a;158:1641–1652. doi: 10.1111/j.1476-5381.2009.00454.x. [DOI] [PMC free article] [PubMed] [Google Scholar]
- Grasa L, Gil V, Gallego D, Martin MT, Jiménez M. P2Y1 receptors mediate inhibitory neuromuscular transmission in the rat colon. Br J Pharmacol. 2009b;158:1641–1652. doi: 10.1111/j.1476-5381.2009.00454.x. [DOI] [PMC free article] [PubMed] [Google Scholar]
- Grover M, Bernard CE, Pasricha PJ, Parkman HP, Abell TL, Nguyen LA, Snape W, Shen KR, Sarr M, Swain J, Kendrick M, Gibbons S, Ordog T, Farrugia G. Platelet-derived growth factor receptor α (PDGFRα)-expressing “fibroblast-like cells” in diabetic and idiopathic gastroparesis of humans. Neurogastroenterol Motil. 2012;24:844–852. doi: 10.1111/j.1365-2982.2012.01944.x. [DOI] [PMC free article] [PubMed] [Google Scholar]
- Horiguchi K, Komuro T. Ultrastructural observations of fibroblast-like cells forming gap junctions in the W/Wν mouse small intestine. J Auton Nerv Syst. 2000;80:142–147. doi: 10.1016/s0165-1838(00)00089-8. [DOI] [PubMed] [Google Scholar]
- Hwang SJ, Blair PJ, Durnin L, Mutafova-Yambolieva V, Sanders KM, Ward SM. P2Y1 purinoreceptors are fundamental to inhibitory motor control of murine colonic excitability and transit. J Physiol. 2012;590:1957–1972. doi: 10.1113/jphysiol.2011.224634. [DOI] [PMC free article] [PubMed] [Google Scholar]
- Iino S, Horiguchi K, Horiguchi S, Nojyo Y. c-Kit-negative fibroblast-like cells express platelet-derived growth factor receptor α in the murine gastrointestinal musculature. Histochem Cell Biol. 2009;131:691–702. doi: 10.1007/s00418-009-0580-6. [DOI] [PubMed] [Google Scholar]
- Iino S, Nojyo Y. Immunohistochemical demonstration of c-Kit-negative fibroblast-like cells in murine gastrointestinal musculature. Arch Histol Cytol. 2009;72:107–115. doi: 10.1679/aohc.72.107. [DOI] [PubMed] [Google Scholar]
- Klemm MF, Lang RJ. Distribution of Ca2+-activated K+ channel (SK2 and SK3) immunoreactivity in intestinal smooth muscles of the guinea-pig. Clin Exp Pharmacol Physiol. 2002;29:18–25. doi: 10.1046/j.1440-1681.2002.03601.x. [DOI] [PubMed] [Google Scholar]
- Koh BH, Roy R, Hollywood MA, Thornbury KD, McHale NG, Sergeant GP, Hatton WJ, Ward SM, Sanders KM, Koh SD. Platelet-derived growth factor receptor-α cells in mouse urinary bladder: a new class of interstitial cells. J Cell Mol Med. 2012;16:691–700. doi: 10.1111/j.1582-4934.2011.01506.x. [DOI] [PMC free article] [PubMed] [Google Scholar]
- Komuro T. Comparative morphology of interstitial cells of Cajal: ultrastructural characterization. Microsc Res Tech. 1999;47:267–285. doi: 10.1002/(SICI)1097-0029(19991115)47:4<267::AID-JEMT5>3.0.CO;2-O. [DOI] [PubMed] [Google Scholar]
- Komuro T, Seki K, Horiguchi K. Ultrastructural characterization of the interstitial cells of Cajal. Arch Histol Cytol. 1999;62:295–316. doi: 10.1679/aohc.62.295. [DOI] [PubMed] [Google Scholar]
- Kurahashi M, Nakano Y, Hennig GW, Ward SM, Sanders KM. Platelet-derived growth factor receptor α-positive cells in the tunica muscularis of human colon. J Cell Mol Med. 2012;16:1397–1404. doi: 10.1111/j.1582-4934.2011.01510.x. [DOI] [PMC free article] [PubMed] [Google Scholar]
- Kurahashi M, Zheng H, Dwyer L, Ward SM, Don Koh S, Sanders KM. A functional role for the ‘fibroblast-like cells’ in gastrointestinal smooth muscles. J Physiol. 2011;589:697–710. doi: 10.1113/jphysiol.2010.201129. [DOI] [PMC free article] [PubMed] [Google Scholar]
- Lee H, Koh BH, Peri LE, Sanders KM, Koh SD. Functional expression of SK channels in murine detrusor PDGFRα+ cells. J Physiol. 2013;591:503–513. doi: 10.1113/jphysiol.2012.241505. [DOI] [PMC free article] [PubMed] [Google Scholar]
- Monaghan KP, Johnston L, McCloskey KD. Identification of PDGFRα positive populations of interstitial cells in human and guinea pig bladders. J Urol. 2012;188:639–647. doi: 10.1016/j.juro.2012.03.117. [DOI] [PubMed] [Google Scholar]
- Monaghan KP, Koh SD, Ro S, Yeom J, Horowitz B, Sanders KM. Nucleotide regulation of the voltage-dependent nonselective cation conductance in murine colonic myocytes. Am J Physiol Cell Physiol. 2006;291:C985–C994. doi: 10.1152/ajpcell.00112.2006. [DOI] [PubMed] [Google Scholar]
- Murthy KS, Makhlouf GM. Coexpression of ligand-gated P2X and G protein-coupled P2Y receptors in smooth muscle. Preferential activation of P2Y receptors coupled to phospholipase C (PLC)- β1 via Gαq/11 and to PLC-β3 via Gβγi3. J Biol Chem. 1998;273:4695–4704. doi: 10.1074/jbc.273.8.4695. [DOI] [PubMed] [Google Scholar]
- Mutafova-Yambolieva VN, Hwang SJ, Hao X, Chen H, Zhu MX, Wood JD, Ward SM, Sanders KM. β-Nicotinamide adenine dinucleotide is an inhibitory neurotransmitter in visceral smooth muscle. Proc Natl Acad Sci U S A. 2007;104:16359–16364. doi: 10.1073/pnas.0705510104. [DOI] [PMC free article] [PubMed] [Google Scholar]
- Peppiatt CM, Collins TJ, Mackenzie L, Conway SJ, Holmes AB, Bootman MD, Berridge MJ, Seo JT, Roderick HL. 2-Aminoethoxydiphenyl borate (2-APB) antagonises inositol 1,4,5-trisphosphate-induced calcium release, inhibits calcium pumps and has a use-dependent and slowly reversible action on store-operated calcium entry channels. Cell Calcium. 2003;34:97–108. doi: 10.1016/s0143-4160(03)00026-5. [DOI] [PubMed] [Google Scholar]
- Sanders KM. Interstitial cells in smooth muscles. Review series. J Cell Mol Med. 2010;14:1197–1198. doi: 10.1111/j.1582-4934.2010.01102.x. [DOI] [PMC free article] [PubMed] [Google Scholar]
- Sanders KM, Koh SD, Ro S, Ward SM. Regulation of gastrointestinal motility – insights from smooth muscle biology. Nat Rev Gastroenterol Hepatol. 2012;9:633–645. doi: 10.1038/nrgastro.2012.168. [DOI] [PMC free article] [PubMed] [Google Scholar]
- Suzuki H, Ward SM, Bayguinov YR, Edwards FR, Hirst GD. Involvement of intramuscular interstitial cells in nitrergic inhibition in the mouse gastric antrum. J Physiol. 2003;546:751–763. doi: 10.1113/jphysiol.2002.033365. [DOI] [PMC free article] [PubMed] [Google Scholar]
- Torihashi S, Ward SM, Nishikawa S, Nishi K, Kobayashi S, Sanders KM. c-kit-dependent development of interstitial cells and electrical activity in the murine gastrointestinal tract. Cell Tissue Res. 1995;280:97–111. doi: 10.1007/BF00304515. [DOI] [PubMed] [Google Scholar]
- Vanderwinden JM, Rumessen JJ, de Kerchove d’Exaerde A, Jr, Gillard K, Panthier JJ, de Laet MH, Schiffmann SN. Kit-negative fibroblast-like cells expressing SK3, a Ca2+-activated K+ channel, in the gut musculature in health and disease. Cell Tissue Res. 2002;310:349–358. doi: 10.1007/s00441-002-0638-4. [DOI] [PubMed] [Google Scholar]
- Velázquez B, Garrad RC, Weisman GA, Gonzalez FA. Differential agonist-induced desensitization of P2Y2 nucleotide receptors by ATP and UTP. Mol Cell Biochem. 2000;206:75–89. doi: 10.1023/a:1007091127392. [DOI] [PubMed] [Google Scholar]
- Ward SM, Beckett EA, Wang X, Baker F, Khoyi M, Sanders KM. Interstitial cells of Cajal mediate cholinergic neurotransmission from enteric motor neurons. J Neurosci. 2000;20:1393–1403. doi: 10.1523/JNEUROSCI.20-04-01393.2000. [DOI] [PMC free article] [PubMed] [Google Scholar]
- Ward SM, Burns AJ, Torihashi S, Sanders KM. Mutation of the proto-oncogene c-kit blocks development of interstitial cells and electrical rhythmicity in murine intestine. J Physiol. 1994;480:91–97. doi: 10.1113/jphysiol.1994.sp020343. [DOI] [PMC free article] [PubMed] [Google Scholar]
- Ward SM, Morris G, Reese L, Wang XY, Sanders KM. Interstitial cells of Cajal mediate enteric inhibitory neurotransmission in the lower esophageal and pyloric sphincters. Gastroenterology. 1998;115:314–329. doi: 10.1016/s0016-5085(98)70198-2. [DOI] [PubMed] [Google Scholar]
- Ward SM, Sanders KM. Involvement of intramuscular interstitial cells of Cajal in neuroeffector transmission in the gastrointestinal tract. J Physiol. 2006;576:675–682. doi: 10.1113/jphysiol.2006.117390. [DOI] [PMC free article] [PubMed] [Google Scholar]
- Ward SM, Sanders KM, Hirst GD. Role of interstitial cells of Cajal in neural control of gastrointestinal smooth muscles. Neurogastroenterol Motil. 2004;16(Suppl. 1):112–117. doi: 10.1111/j.1743-3150.2004.00485.x. [DOI] [PubMed] [Google Scholar]
- Zhang Y, Lomax AE, Paterson WG. P2Y1 receptors mediate apamin-sensitive and -insensitive inhibitory junction potentials in murine colonic circular smooth muscle. J Pharmacol Exp Ther. 2010;333:602–611. doi: 10.1124/jpet.109.160978. [DOI] [PubMed] [Google Scholar]
Associated Data
This section collects any data citations, data availability statements, or supplementary materials included in this article.


