Abstract
The collection of brain images from populations of subjects who have been genotyped with genome-wide scans makes it feasible to search for genetic effects on the brain. Even so, multivariate methods are sorely needed that can search both images and the genome for relationships, making use of the correlation structure of both datasets. Here we investigate the use of sparse canonical correlation analysis (CCA) to home in on sets of genetic variants that explain variance in a set of images. We extend recent work on penalized matrix decomposition to account for the correlations in both datasets. Such methods show promise in imaging genetics as they exploit the natural covariance in the datasets. They also avoid an astronomically heavy statistical correction for searching the whole genome and the entire image for promising associations.
Index Terms: Diffusion tensor imaging, Genome wide association, Canonical correlation analysis, sparsity, lasso
1. INTRODUCTION
The last few years have seen an unprecedented surge in data acquisition in fields ranging from signal processing to biology and medicine. This ability to acquire massive amounts of data has opened the door to qualitatively different approaches to science as well, often using high-dimensional datasets from more than one modality. One example is the convergence of biomedical imaging and genomics in the nascent field of imaging genetics [1]. The basic idea is to identify genetic variants that can best capture and explain phenotypic variations in brain function and structure. To be more concrete, two sets of data are observed, p genotypes and q neuroimaging phenotypes, on n samples. Both p and q may be small or large and there has been prior testing for effects in various scenarios. In [2], Joyner et al. studied a dataset with small q, four brain size measures, and small p, 11 single nucleotide polymorphisms (SNPs). In [3], Potkin et al. considered small q, the mean BOLD signal from fMRI, and large p, 317,503 SNPs. Filippini et al. explored the combination of large q, 29,812 voxels, and small p, a single SNP [4]. Finally, Stein et al. in [5] took on the most challenging scenario of large q, 31,622 voxels, and large p, 448,293 SNPs. Thus, on the same set of imaged subjects, high-dimensional genetic data is also collected, e.g. hundreds of thousands of SNP genotypes. In some cases, well defined regions of interest (ROIs) are already known, but in other cases they are not. Similarly, in some cases, candidate genes may or may not be available. In this scenario, one wishes to simultaneously identify ROIs and a parsimonious set of genetic loci that are associated with each other.
The last case in particular presents not only intriguing possibilities but also computational and statistical challenges. Indeed, the simplest strategy is to perform pq univariate regressions between all possible voxels and SNPs [5] and adjust for multiple comparisons. While such an approach is straightforward, it also completely ignores the correlation structure among the SNPs and voxels. It also lacks power, as an astronomical correction must be made for the number of tests performed. Given the correlation structure a multivariate approach is called for. To address these shortcomings, in this paper we present a sparse canonical correlation analysis (CCA) method to identify joint signals in a pair of high-dimensional data sets, namely diffusion tensor images (DTI) and SNP measurements. The goal in classical CCA is to determine a coordinate system that maximizes the cross-correlation between two data sets [6]. In other words we seek the linear transformation of two data sets such that the linear forms are maximally correlated. We anticipate, however, that relatively few DTI voxels will contain signals that are correlated with again relatively few SNPs. Despite the fact that both data live in very high dimensional spaces, DTI voxels number in the tens of thousands and SNPs number in the hundreds of thousands, the relevant signal often resides in a low dimensional manifold. Indeed penalized methods such as the LASSO [7] have been very successful in recovering meaningful parsimonious models from high dimensional data. Building on this idea, Witten et al. introduced a penalized matrix decomposition (PMD) on the sample cross-covariance matrix in [8] aimed at introducing sparsity into the linear combinations. In related work, Vounou et al. introduced sparse Reduced Rank Regression (sRRR) [9, 10] as another multivariate alternative. Indeed, the PMD is a special case of the sRRR when relevant covariance matrices are taken to be identity matrices. Nonetheless, despite having a more general framework, the algorithms presented in [9, 10] make the same simplifying assumptions made in PMD. We also note that under the diagonal covariance assumption such decompositions are equivalent to a partial least squares regression [11]. In this work we extend the PMD model to account for correlation structure in both data sets.
2. METHODS
2.1. Simulation Experiment
Suppose we have 100 subjects for whom 1,000 SNPs have been typed, X ∈ ℝ100×1,000, and on which a 100 × 100 image has been taken, 𝒴 ∈ ℝ100×100×100 (here we introduce the ideas for a set of 2D images but they hold in any dimension without loss of generality). Let Y ∈ ℝ100×10,000 denote the matricization of 𝒴 along its first mode. The data sets are generated as follows. Let β ∈ ℝ1,000 be sparse with
The images are also similarly sparse.
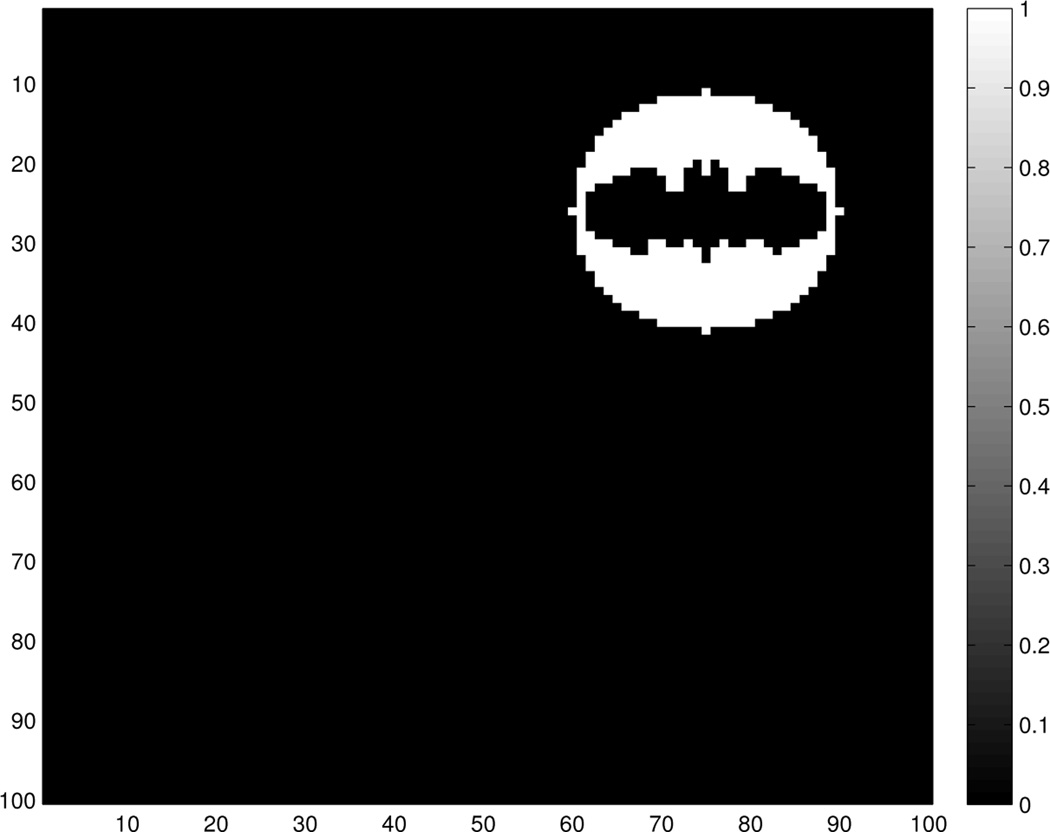
where R denotes the ROI. The ROI for this problem is shown in Figure 1. Finally, we do not observe 𝒴 but rather a noisy version of it 𝒵.
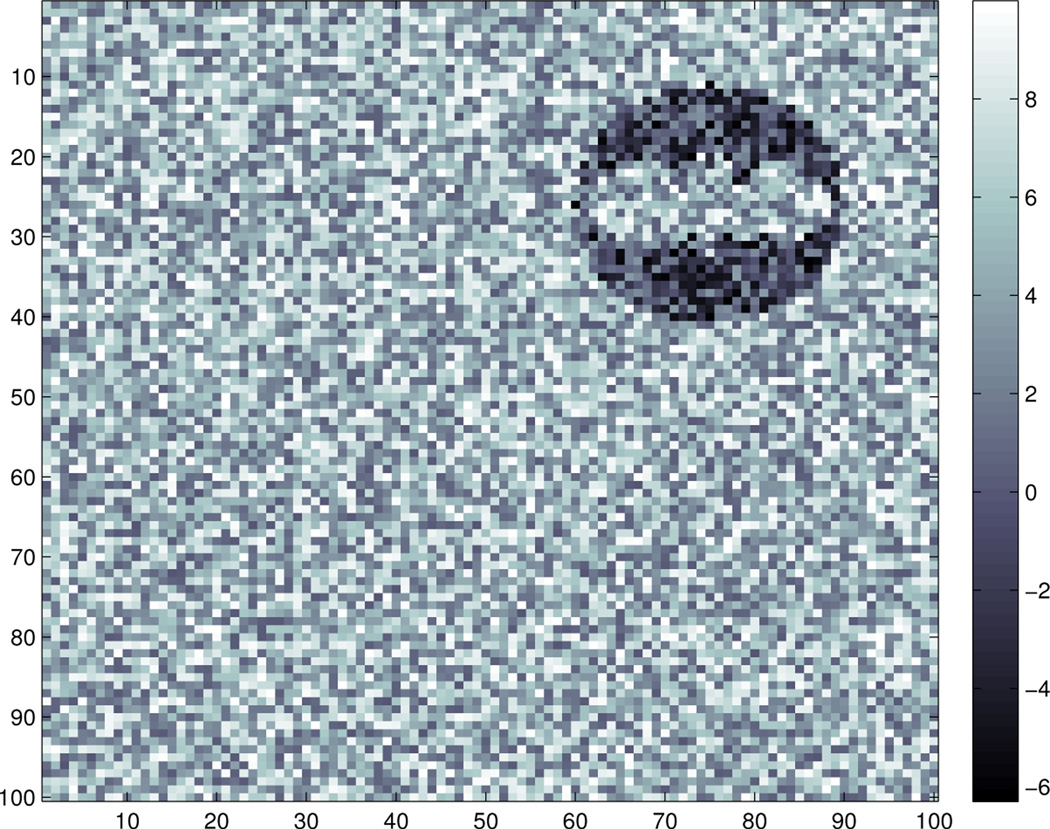
where εijk are i.i.d. standard normal and σ = 10. An example of the observed image data for a subject is shown in Figure 2.
Fig. 1.
Region of Interest (ROI) for a simulated example problem, with a coherent signal in the image. Pixels that belong to the ROI have value of 1. Pixels outside the ROI have value of 0.
Fig. 2.
An example of the observed image data: 𝒵(1, :, :) which corresponds to the observed image of the first subject.
2.2. Sparse Canonical Correlation Analysis
Let X ∈ ℝn×p denote the SNP data matrix and Y ∈ ℝn×q denote the matrix of vectorized DTI fractional anisotropy (FA) scores. Classical CCA solves the following optimization problem
subject to the constraints a⊤X⊤Xa = 1 and b⊤Y⊤Yb = 1. The matrices X⊤Y,X⊤X; and Y⊤Y are estimates of the cross-covariance and covariance matrices respectively. PMD introduces a LASSO penalty and assumes the covariance matrices are identity matrices, i.e., PMD solves the optimization problem
subject to the constraints a⊤a ≤ 1 and b⊤b ≤ 1. Note that the equality constraints have been relaxed to inequality constraints to make the feasible sets convex. The parameters λa ≥ 0 and λb ≥ 0 tune the degree of sparsity in a and b. Since the objective function is biconvex, namely it is convex in a with b fixed and vice versa, PMD iteratively minimizes with respect to a holding b fixed, and vice versa until convergence. The update for a is given by
The update for b is similar. To weaken the identity covariance assumption we minimize the same objective function but alter the constraints to a⊤ Σ̃xa ≤ 1 and b⊤ Σ̃yb ≤ 1, where Σ̃x and Σ̃y are estimated covariance matrices. Again the problem is amenable to block relaxation, namely iteratively minimizing with respect to a holding b fixed and vice versa. Consider optimizing with respect to a first. We can rewrite the problem as
subject a⊤Σ̃xa ≤ 1. A little convex calculus shows that the updates are given by
| (1) |
and
| (2) |
Thus, the update occurs in two stages. We first solve a LASSO penalized regression problem in (1) where the response variable is and the design matrix is . Then if the solution of (1) is non-zero we normalize the solution so that ‖Σ̃xa*‖2 = 1. If the solution to (1) is zero, the final solution a* is zero. Note that if we take Σ̃x and Σ̃y to be identity matrices, we recover the algorithm employed in prior work [8, 9, 10].
We note that the choice of covariance estimator is critical. Indeed the sample covariance is well recognized as a poor estimator of the population covariance in the small n, large p regime considered here. This problem even plagues the classical CCA problem as well when p is close to n. This has been addressed by applying a ridge estimate of the covariance matrices, namely [12, 13]. Ledoit and Wolf introduced a well-conditioned and consistent linear estimator of the sample covariance in [14] and a considerably more complicated nonlinear one in [15]. Here we employ Ledoit and Wolf’s simple linear estimator.
where Sx is the sample covariance, mx is the average eigenvalue of Sx, and λ ∈ [0, 1] is a convex mixing coefficient that shrinks the sample covariance towards mxI as λ approaches 1. Ledoit and Wolf derive a value for λ to ensure that Σ̃x is a consistent estimator of the true covariance Σx.
We apply both PMD and our extension of it on the simulated data described above. As a proof of concept - to see if we could recover the generative sparse model - we hand picked the regularization parameters λa and λb to see if there was a pair of values for which we could recover the true set of SNPs. In particular, we are interested in how many relevant SNPs were missed when sufficient regularization was applied to drop all irrelevant SNPs from the model. In practice, we would choose the regularization parameters with either a measure of complexity such as the BIC or by a data driven method such as cross-validation.
3. RESULTS
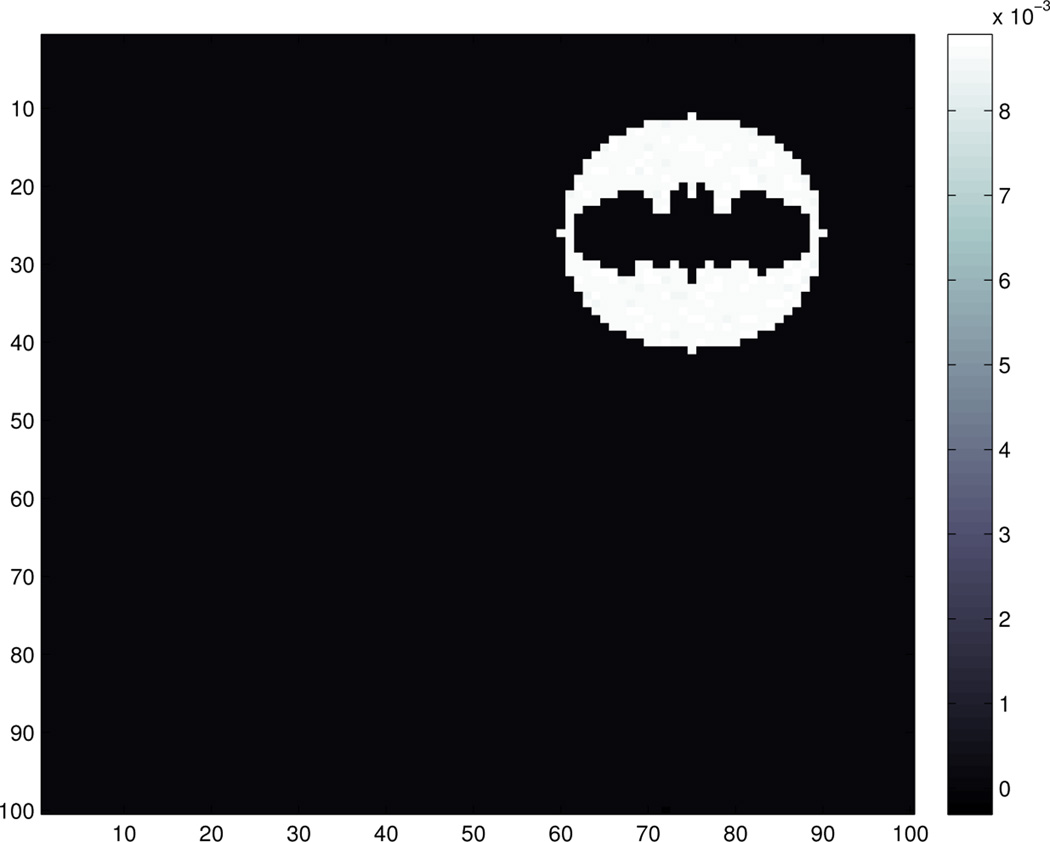
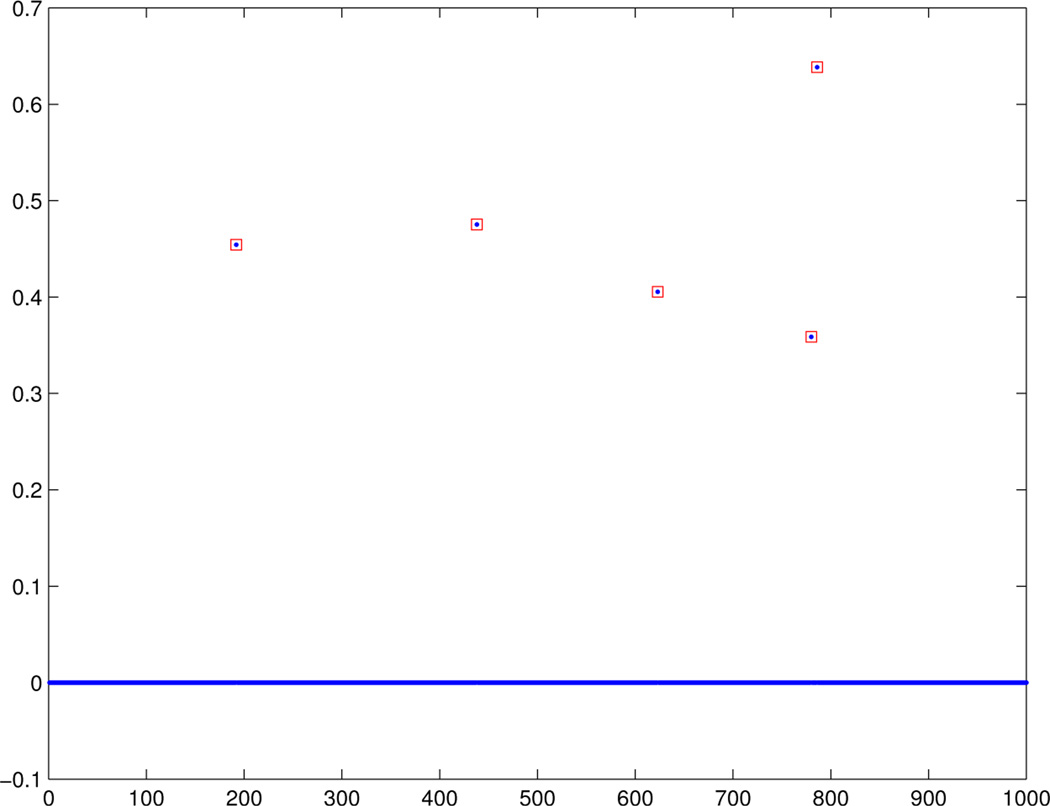
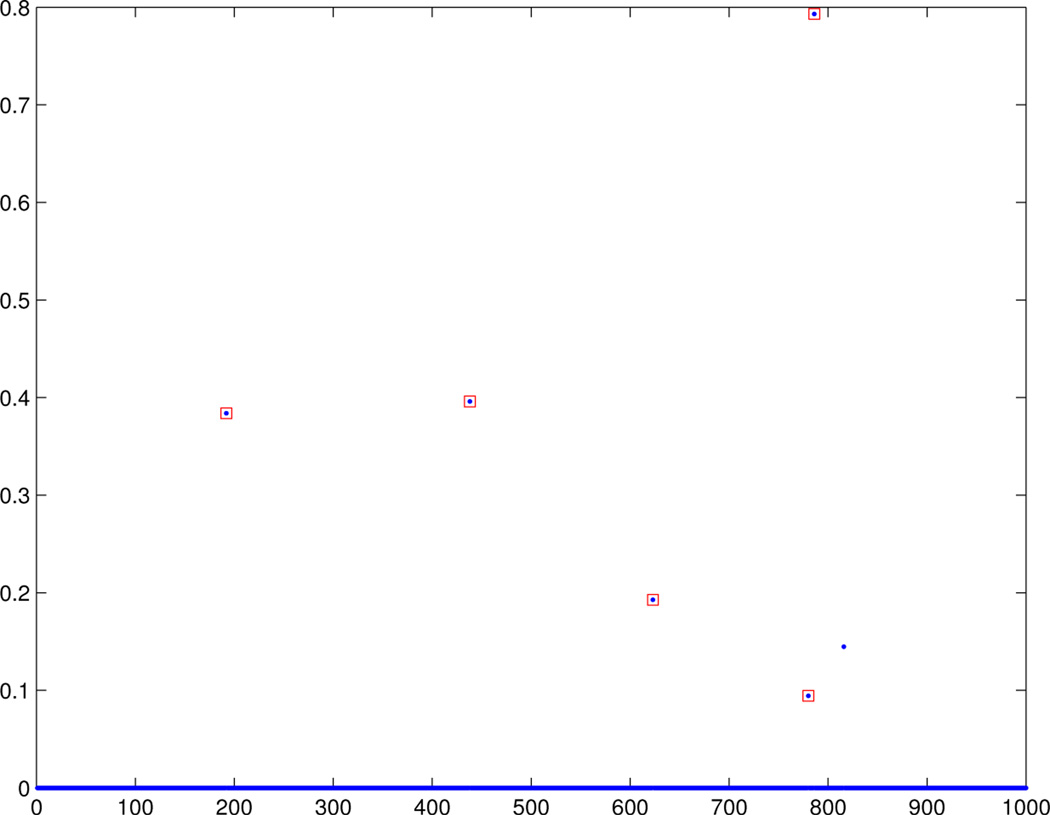
Figures 3 and 4 show the estimated canonical correlation vectors b and a unfolded when the non-trivial covariance estimate is used. We see that there is a regularization parameter that recovers the correct support. Figure 5 shows estimated a obtained via PMD using hand picked regularization parameters. PMD selected the same set of voxels and for space considerations, the results are not shown. Nonetheless, interestingly, the selected SNPs are different. Choosing a smaller λa will indeed include the missed SNP, but the cost is that false positives will also be included.
Fig. 3.
With non-trivial covariance estimate: The unfolded vector b that summarizes Y.
Fig. 4.
With non-trivial covariance estimate: The estimated sparse vector a that summarizes X. The SNP loci annotated in red denote the loci used to generate the data.
Fig. 5.
PMD: The estimated sparse vector a that summarizes X. The SNP loci annotated in red denote the loci used to generate the data.
4. DISCUSSION
In this paper we build on previous penalized multivariate methods for finding sparse structure in pairs of related data sets by showing how to incorporate correlation information. Our simulation example shows that our method is capable of recovering true latent sparse structure and that the solutions obtained when accounting for correlation structure can differ from multivariate approaches that assume identity covariances. Using non-trivial covariance estimates, however, makes the optimization problem harder. To that end we are working on developing more efficient algorithms that can work with non-trivial covariance matrices. Additionally, we are currently investigating our methods on real data.
REFERENCES
- 1.Thompson Paul M, Martin Nicholas G, Wright Margaret J. Imaging genomics. Current Opinion in Neurology. 2010;vol. 23(no. 4) doi: 10.1097/WCO.0b013e32833b764c. [DOI] [PMC free article] [PubMed] [Google Scholar]
- 2.Joyner Alexander H, Cooper Roddey J, Bloss Cinnamon S, Bakken Trygve E, Rimol Lars M, Melle Ingrid, Agartz Ingrid, Djurovic Srdjan, Topol Eric J, Schork Nicholas J, Andreassen Ole A, Dale Anders M. A common mecp2 haplotype associates with reduced cortical surface area in humans in two independent populations. Proceedings of the National Academy of Sciences. 2009;vol. 106(no. 36):15483–15488. doi: 10.1073/pnas.0901866106. [DOI] [PMC free article] [PubMed] [Google Scholar]
- 3.Potkin Steven G, Turner Jessica A, Guffanti Guia, Lakatos Anita, Fallon James H, Nguyen Dana D, Mathalon Daniel, Ford Judith, Lauriello John, Macciardi Fabio, FBIRN A genome-wide association study of schizophrenia using brain activation as a quantitative phenotype. Schizophrenia Bulletin. 2009;vol. 35(no. 1):96–108. doi: 10.1093/schbul/sbn155. [DOI] [PMC free article] [PubMed] [Google Scholar]
- 4.Filippini Nicola, Rao Anil, Wetten Sally, Gibson Rachel A, Borrie Michael, Guzman Danilo, Kertesz Andrew, Loy-English Inge, Williams Julie, Nichols Thomas, Whitcher Brandon, Matthews Paul M. Anatomically-distinct genetic associations of apoe 4 allele load with regional cortical atrophy in alzheimer’s disease. NeuroImage. 2009;vol. 44(no. 3):724–728. doi: 10.1016/j.neuroimage.2008.10.003. [DOI] [PubMed] [Google Scholar]
- 5.Stein Jason L, Hua Xue, Lee Suh, Ho April J, Leow Alex D, Toga Arthur W, Saykin Andrew J, Shen Li, Foroud Tatiana, Pankratz Nathan, Huentelman Matthew J, Craig David W, Gerber Jill D, Allen April N, Corneveaux Jason J, DeChairo Bryan M, Potkin Steven G, Weiner Michael W, Thompson Paul M. Voxelwise genome-wide association study (vgwas) NeuroImage. 2010;vol. 53(no. 3):1160–1174. doi: 10.1016/j.neuroimage.2010.02.032. [DOI] [PMC free article] [PubMed] [Google Scholar]
- 6.Hotelling Harold. Relations between two sets of variants. Biometrika. 1936;vol. 28:321–377. [Google Scholar]
- 7.Tibshirani Robert. Regression shrinkage and selection via the lasso. Journal of the Royal Statistical Society, Ser. B. 1996;vol. 58(no. 1):267–288. [Google Scholar]
- 8.Witten Daniela M, Tibshirani Robert, Hastie Trevor. A penalized matrix decomposition, with applications to sparse principal components and canonical correlation analysis. Biostatistics. 2009;vol. 10(no. 3):515–534. doi: 10.1093/biostatistics/kxp008. [DOI] [PMC free article] [PubMed] [Google Scholar]
- 9.Vounou Maria, Nichols Thomas E, Montana Giovanni. Discovering genetic associations with high-dimensional neuroimaging phenotypes: A sparse reduced-rank regression approach. NeuroImage. 2010;vol. 53(no. 3):1147–1159. doi: 10.1016/j.neuroimage.2010.07.002. [DOI] [PMC free article] [PubMed] [Google Scholar]
- 10.Vounou Maria, Janousova Eva, Wolz Robin, Stein Jason L, Thompson Paul M, Rueckert Daniel, Montana Giovanni. Sparse reduced-rank regression detects genetic associations with voxel-wise longitudinal phenotypes in alzheimer’s disease. NeuroImage. 2012;vol. 60(no. 1):700–716. doi: 10.1016/j.neuroimage.2011.12.029. [DOI] [PMC free article] [PubMed] [Google Scholar]
- 11.Le Floch Édith, Guillemot Vincent, Frouin Vincent, Pinel Philippe, Lalanne Christophe, Trinchera Laura, Tenenhaus Arthur, Moreno Antonio, Zilbovicius Monica, Bourgeron Thomas, Dehaene Stanislas, Thirion Bertrand, Poline Jean-Baptiste, Duchesnay Édouard. Significant correlation between a set of genetic polymorphisms and a functional brain network revealed by feature selection and sparse partial least squares. NeuroImage. 2012;vol. 63(no. 1):11–24. doi: 10.1016/j.neuroimage.2012.06.061. [DOI] [PubMed] [Google Scholar]
- 12.Vinod HD. Canonical ridge and econometrics of joint production. Journal of Econometrics. 1976 May;vol. 4(no. 2):147–166. [Google Scholar]
- 13.González Ignacio, Déjean Sébastien, Martin Pascal GP, Baccini Alain. Cca: An r package to extend canonical correlation analysis. Journal of Statistical Software. 2008;vol. 23(no. 12):1–14. 1. [Google Scholar]
- 14.Ledoit Olivier, Wolf Michael. A well-conditioned estimator for large-dimensional covariance matrices. Journal of Multivariate Analysis. 2004;vol. 88(no. 2):365–411. [Google Scholar]
- 15.Ledoit Olivier, Wolf Michael. Nonlinear shrinkage estimation of large-dimensional covariance matrices. Annals of Statistics. 2012;vol. 40(no. 2):1024–1060. [Google Scholar]


