Abstract
The superior cerebellar peduncles (SCPs) are white matter tracts that serve as the major efferent pathways from the cerebellum to the thalamus. With diffusion tensor images (DTI), tractography algorithms or volumetric segmentation methods have been able to reconstruct part of the SCPs. However, when the fibers cross, the primary eigenvector (PEV) no longer represents the primary diffusion direction. Therefore, at the crossing of the left and right SCP, known as the decussation of the SCPs (dSCP), fiber tracts propagate incorrectly. To our knowledge, previous methods have not been able to segment the SCPs correctly. In this work, we explore the diffusion properties and seek to volumetrically segment the complete SCPs. The non-crossing SCPs and dSCP are modeled as different objects. A multi-object geometric deformable model is employed to define the boundaries of each piece of the SCPs, with the forces derived from diffusion properties as well as the PEV. We tested our method on a software phantom and real subjects. Results indicate that our method is able to the resolve the crossing and segment the complete SCPs with repeatability.
Index Terms: SCP, MGDM, GGVF, Westin index, Fiber crossing
1. INTRODUCTION
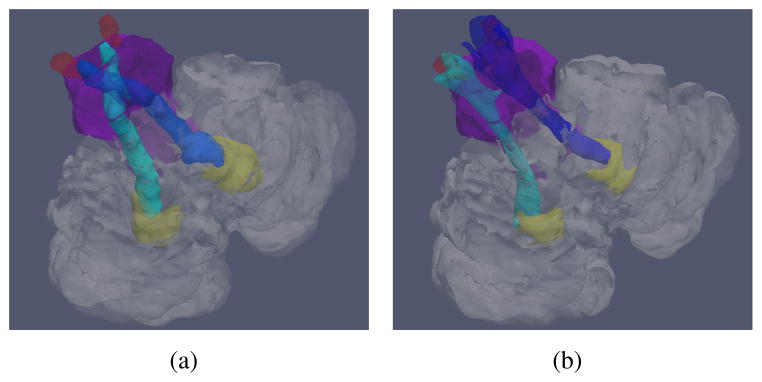
The superior cerebellar peduncles (SCPs) are white matter tracts that serve as the main efferent connections from the cerebellum to the thalamus [1]. They originate from the dentate nucleus (DN) and project to the red nucleus (RN) [2]. The left and right SCP cross each other after leaving the cerebellum and before entering the RN. The crossing is known as the decussation of the SCPs (dSCP). An illustration of the structure of the SCPs is shown in Figure 1(a). The SCPs are involved in studies of various diseases, such as spinocerebellar ataxia (SCA) [3], schizophrenia [4], and Parkinson’s disease [5]. Thus, the ability to automatically segment the SCPs could facilitate these scientific studies related to the structures.
Fig. 1.

Illustrations of (a) the correct structures of the SCPs, and (b) typical incorrect SCPs obtained from DTI. Shown together with the cerebellum (transparent), the brainstem (purple), the DN (yellow), and the RN (red).
Previous works have used diffusion tensor images (DTI) to reconstruct neural tracts. Different strategies [6, 7] have been explored to attach anatomical labels to the fibers from tractography. Other methods extract regions of interest by directly obtaining a volumetric segmentation, such as the fast marching method [8], or DOTS [9]. Although some of the methods [7, 9] have been able to segment part of the SCPs before the decussation, instead of bending toward and then crossing the mid-sagittal plane, their results continue ipsilaterally, as shown in Figure 1(b). To our best knowledge, no methods have been reported to automatically segment the complete SCPs, including the crossing. The main difficulty with resolving the decussation is that when the fibers cross, the tensor model fails and the primary eigenvector (PEV) no longer represents the primary diffusion direction (PDD). Yet, other information derived from the diffusion tensor can identify the crossing. In this work, we propose a method to volumetrically segment the complete SCPs using a multi-object geometric deformable model (MGDM) [10]. The non-crossing SCPs and the dSCP are modeled as different objects. MGDM can apply different forces on boundaries between different pairs of objects and segment the objects simultaneously. Our task is then to develop different forces for different boundaries. In order to examine PEV homogeneity, we calculate the PEV edge map as in [11]. In the PEV edge map, large PEV variability is indicated by high intensities. Apart from the PEV information, we also examine the Westin index [12], which indicates the shape of the diffusion tensor, to define the boundaries of different sections of the SCPs. In the non-crossing region, it is expected that the linear Westin index (Cl) is high and the PEV exhibit homogeneity; in the crossing region, although the PEV is not correct, the linear Westin index decreases and the planar Westin index (Cp) increases. Based on these properties and proper initialization, we evolve MGDM to segment the complete SCPs. The detailed force design is given in the following section.
2. METHODS
2.1. MGDM
MGDM is a framework for multiple object segmentation. It guarantees no object overlap or gaps between objects. The conventionally used forces in geometric deformable models can also be in MGDM [10]. In addition, MGDM enables us to use different forces on the boundaries between different object pairs, as shown in Equation 1.
| (1) |
φi,j is the level set function for the boundary between object i and j, freg:i,j represents the region force, fadv:i,j stands for the advection force, and κ is the curvature. Using this framework, we design the forces for specific boundaries rather than for each object.
2.2. Initialization
To initialize the complete SCPs for MGDM, we adopt a single atlas strategy. We first delineate the template SCPs on a subject. The left and right SCP are delineated respectively and then combined to form the SCPs template with three labels: left non-crossing SCP (lSCP), right non-crossing SCP (rSCP), and the crossing part of the SCPs (i.e., dSCP). Besides, we incorporate the label of the other white matter (oWM) that is non-SCP and an isotropic area (ISO). These two are background labels, and the reason to differentiate them is given in Section 2.3. Thus we have the label set with 5 elements: {lSCP, rSCP, dSCP, oWM, ISO}. Then for each subject, we use the FA map masked by the brainstem and the cerebellum segmentation from TOADS [13] to affinely register the template to the target. The registered template serves as the initialization. An example of initialization is shown with only lSCP, rSCP, and dSCP in Figure 2(a).
Fig. 2.

Results on two slices of a representative subject: (a) initialization, (b) segmentation result, and the segmentation result overlaid on (c) Cl, (d) Cp, and (e) the PEV edge map. Row 1 shows a slice where the SCPs cross; row 2 shows a slice where the SCPs do not cross. (Yellow: lSCP; red: rSCP; green: dSCP.)
2.3. Force Design
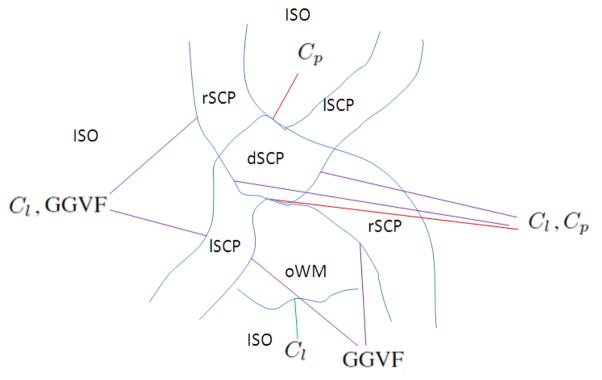
We explore various diffusion properties, including the PEV homogeneity and the Westin index [12], to segment the complete SCPs. To use the PEV homogeneity, instead of seeking a global homogeneity inside the entire tract, we use a PEV edge map explained in [11]. It has high intensities at places with with large changes in PEV orientation and has low intensities where the PEV is smooth. This approach is advantageous because the PEV at two ends of a tract can have different orientations, but transitions smoothly. In this case, the PEV is not necessarily homogeneous for all the voxels but the PEV edge map is dark in the tract. Then a generalized gradient vector flow (GGVF) fGGVF is calculated from the edge map to locate the boundaries on the edges [14]. We use the Cl and Cp as region forces that shrink or expand the boundaries. Examples of Cl, Cp, and the PEV edge map are shown in Figure 2(c), 2(d), and 2(e), respectively. The application of the forces on specific boundaries is displayed in Figure 3, and explained as follows.
Fig. 3.

An overview of the forces applied on each boundary.
In the non-crossing SCPs, Cl is expected to be high and the PEV is homogeneous; in the crossing area, although the PEV does not indicate the correct PDD, Cl decreases and Cp increases. However, for the background, i.e., the area that does not belong to the SCPs, there are two different cases, oWM and ISO, and we should treat them separately. For instance, the boundary between lSCP/rSCP and the ISO can be defined by both Cl and PEV homogeneity, while Cl does not help on the boundary between lSCP/rSCP and oWM. Therefore, we convert these observation to the forces on each boundary.
| (2) |
| (3) |
| (4) |
| (5) |
| (6) |
| (7) |
where α, β and γ tune the force weight, and tl and tp are the thresholds for Cl and Cp, respectively.
For completeness, on the boundary between oWM and ISO, we use
| (8) |
and on every boundary we apply a curvature force κ to preserve smoothness.
3. EXPERIMENTS
3.1. Phantom Test
A crossing phantom was created as in [15]. The initialization is shown in Figure 4, together with the Cl, Cp, and the PEV edge map. Note that in the crossing area, the PEV showed homogeneity, albeit incorrect, in this phantom test. However, it is not necessarily guaranteed in real data. Thus we did not utilize it for segmenting the crossing regions. The method was applied and the result is also shown in Figure 4. The Dice coefficients for the simulated lSCP, rSCP, and dSCP were 0.984, 0.984, and 0.985 respectively, indicating a successful segmentation.
Fig. 4.

Software phantom: (a) initialization, (b) Cl, (c) Cp, (d) PEV edge map, and (e) segmentation result.
3.2. Real Subject
We then applied the method on 6 healthy subjects. Diffusion weighted images were acquired using a multi-slice, single-shot EPI sequence. Each sequence utilized 32 gradient directions and one b0 image with a 3T MR scanner (Intera, Philips Medical Systems, Netherlands). The resolution was originally 2.2 mm isotropic and resampled to 1 mm isotropic. The tensors were estimated using CATNAP [16].
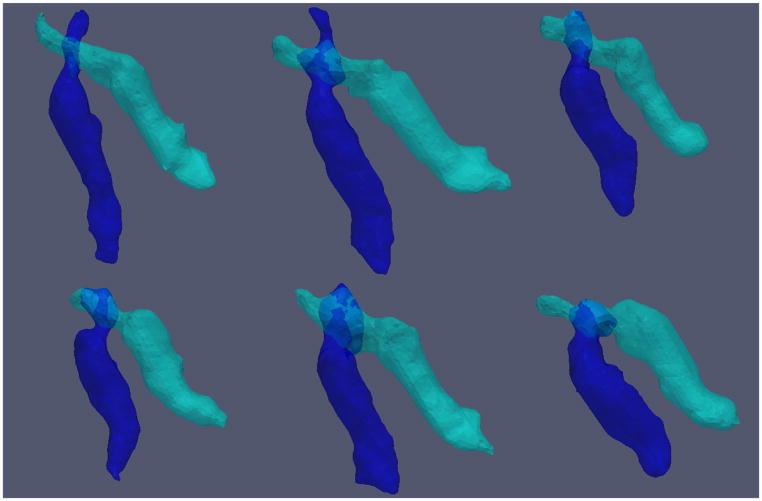
We evolved MGDM with the initialization following the method introduced above. Figure 5 shows 3D renderings of the complete SCPs of the 6 subjects. Note that because the decussation is very close to the RN, which is a gray matter structure, the method did not always capture the non-crossing region superior to the crossing. We also display the cross section of the segmentation result on two representative slices of a selected subject in Figure 2(b), and the result is overlaid on Cl, Cp, and the PEV edgemap in Figure 2(c), 2(d), and 2(e), respectively. Row 1 displays a slice where the SCPs cross while row 2 shows a slice without the dSCP. We can see that the boundaries agree with the diffusion properties used in our design of the force, which demonstrates the ability to segment the complete SCPs. A reproducibility experiment was performed on two successive scans of one subject as well. We computed the Dice coefficient for lSCP, rSCP, and dSCP, which were 0.849, 0.880, and 0.602 respectively. The Dice number for the dSCP is smaller than the others because it is a much smaller object. These numbers show the reproducibility of the method.
Fig. 5.
3D renderings of the complete SCPs of the 6 subjects. (Oblique view)
4. CONCLUSION
In this paper, we presented a method for segmenting the complete SCPs with the crossing part using the MGDM framework. Forces are designed using the diffusion properties distinctly for boundaries between different object pairs. Experiments on a crossing phantom and real data show that the method is able to resolve the crossing and recover the complete SCPs with repeatability. Future work may involve further exploration of the diffusion properties to better define the dSCP. We also seek further validation of the method and application on subjects with diseases for scientific studies.
Acknowledgments
This work is partially supported by NIH/NINDS 2R01NS056307-06A1 and the China Scholarship Council.
References
- 1.Mori S, Wakana S, Nagae-Poetscher LM, van Zijl PCM. MRI Atlas of Human White Matter. 1. Elsevier; Amsterdam: 2005. [DOI] [PubMed] [Google Scholar]
- 2.Ristanović D, Milošević NT, Stefanović BD, Marić DL, Rajković K. Morphology and classification of large neurons in the adult human dentate nucleus: A qualitative and quantitative analysis of 2D images. Neuroscience Research. 2010;67(1):1–7. doi: 10.1016/j.neures.2010.01.002. [DOI] [PubMed] [Google Scholar]
- 3.Ying SH, Landman BA, Chowdhury S, Sinofsky AH, Gambini A, Mori S, Zee DS, Prince JL. Orthogonal diffusion-weighted MRI measures distinguish region-specific degeneration in cerebellar ataxia subtypes. Journal of neurology. 2009;256(11):1939–1942. doi: 10.1007/s00415-009-5269-1. [DOI] [PMC free article] [PubMed] [Google Scholar]
- 4.Wang F, Sun Z, Du X, Wang X, Cong Z, Zhang H, Zhang D, Hong N. A diffusion tensor imaging study of middle and superior cerebellar peduncle in male patients with schizophrenia. Neuroscience letters. 2003;348(3):135–138. doi: 10.1016/s0304-3940(03)00589-5. [DOI] [PubMed] [Google Scholar]
- 5.Nicoletti G, Tonon C, Lodi R, Condino F, Manners D, Malucelli E, Morelli M, Novellino F, Paglionico S, Lanza P, Messina D, Barone P, Morgante L, Zappia M, Barbiroli B, Quattrone A. Apparent diffusion coefficient of the superior cerebellar peduncle differentiates progressive supranuclear palsy from Parkinson’s disease. Movement Disorders. 2008;23(16):2370–2376. doi: 10.1002/mds.22279. [DOI] [PubMed] [Google Scholar]
- 6.Maddah M, Crimson WEL, Warfield SK. Statistical modeling and EM clustering of white matter fiber tractsin. Biomedical Imaging: Nano to Macro, 2006. 3rd IEEE International Symposium on; IEEE. 2006. pp. 53–56. [Google Scholar]
- 7.Ye C, Bazin P-L, Bogovic JA, Ying SH, Prince JL. Labeling of the cerebellar peduncles using a supervised Gaussian classifier with volumetric tract segmentation. Proceedings of SPIE Medical Imaging. 2012;8314:143. [Google Scholar]
- 8.Parker GJM, Wheeler-Kingshott CAM, Barker GJ. Estimating distributed anatomical connectivity using fast marching methods and diffusion tensor imaging. Medical Imaging IEEE Transactions on. 2002;21(5):505–512. doi: 10.1109/TMI.2002.1009386. [DOI] [PubMed] [Google Scholar]
- 9.Bazin PL, Ye C, Bogovic JA, Shiee N, Reich DS, Prince JL, Pham DL. Direct segmentation of the major white matter tracts in diffusion tensor images. NeuroImage. 2011;58(2):458–468. doi: 10.1016/j.neuroimage.2011.06.020. [DOI] [PMC free article] [PubMed] [Google Scholar]
- 10.Bogovic JA, Prince JL, Bazin PL. A multiple object geometric deformable model for image segmentation. Computer Vision and Image Understanding. 2013;117(2):145–157. doi: 10.1016/j.cviu.2012.10.006. [DOI] [PMC free article] [PubMed] [Google Scholar]
- 11.Fan X, Thompson M, Bogovic JA, Bazin P-L, Prince JL. A novel contrast for DTI visualization for thalamus delineation. Proceedings of SPIE Medical Imaging. 2010:7625. doi: 10.1117/12.844473. [DOI] [PMC free article] [PubMed] [Google Scholar]
- 12.Westin CF, Peled S, Gudbjartsson H, Kikinis R, Jolesz FA. Geometrical diffusion measures for MRI from tensor basis analysis. Proceedings of ISMRM. 1997;97:1742. [Google Scholar]
- 13.Bazin PL, Pham DL. Homeomorphic brain image segmentation with topological and statistical atlases. Medical Image Analysis. 2008;12(5):616–625. doi: 10.1016/j.media.2008.06.008. [DOI] [PMC free article] [PubMed] [Google Scholar]
- 14.Xu C, Prince JL. Generalized gradient vector flow external forces for active contours. Signal Processing. 1998;71(2):131–139. [Google Scholar]
- 15.Ye C, Bazin P-L, Ying SH, Prince JL. A fiber tracking method guided by volumetric tract segmentation. Mathematical Methods in Biomedical Image Analysis (MMBIA), 2012 IEEE Workshop on; 2012. pp. 137–142. [Google Scholar]
- 16.Landman BA, Farrell JAD, Patel N-L, Mori S, Prince JL. DTI fiber tracking: the importance of adjusting DTI gradient tables for motion correction. CAT-NAP - a tool to simplify and accelerate DTI analysis. Proc. Org Human Brain Mapping 13th Annual Meeting; 2007. [Google Scholar]


