

Abstract
Introduction: Proximal spinal muscular atrophy (SMA) is one of the most significant neurodegenerative diseases amongst the autosomal-recessive genetic disorders which is caused by the absence of protein survival of motor neuron (SMN). A critical nucleotide difference in SMN2 compared to SMN1 gene leads to an inefficient protein. Hence, homozygous lack of SMN1 provides a progressive disease. Due to the high prevalence, up to now, several molecular diagnostic methods have been used which most of them are lengthy, expensive, and laborious. Methods: In the present study, we exploited a gold nanoprobe-based method for semi-quantitative SMN1 gene dosage analysis compared to SMN2. The assay was done under hybridization process between Au nanoprobes and different ratios of SMN1/SMN2 amplicons. Results: UV-vis spectra indicated that after the salt addition, nanoprobes aggregated gradually and their peak shifted to longer wavelengths except in the stable target-nanoprobes hybridization. The results revealed that the homozygous genotype of SMN2 gene is distinguished from the heterozygous genotypes of SMN genes by the naked eye, whereas different ratio of heterozygous genotypes (SMN1/SMN2) are differentiated better from each other using peak analysis ratios. Conclusion: The presented strategy is an alternative simple method for discrimination of homozygous deletion of SMN1 in less than 30 min. However, further evaluation of the assay using clinical samples is recommended prior to real-world use.
Keywords: Colorimetric, Gold Nanoprobe, Nucleotide Polymorphism (SNP), Spinal Muscular Atrophy (SMA), Survival of Motor Neuron (SMN)
Introduction
Proximal spinal muscular atrophy (SMA) is one of the most significant lethal neurodegenerative diseases amongst the autosomal-recessive genetic disorders.1 This fetal- adolescent progressive illness is caused by the absence of protein survival of motor neuron (SMN). Homologous inverted copies of SMN genes (SMN1 and SMN2), which are located on the chromosome 5q13, are responsible for protein expression. These copies differ by 5 nucleotide base pairs (one in exon 7, exon 8, and intron 6; two in intron 7). A critical single nucleotide polymorphism (SNP) in exon 7 (840 C>T) leads to the production of defective form of SMN2 protein which consequently cannot circumvent the role of SMN complex, an assemblyosome of ribonucleoproteins.2 As a result, homozygous deletion of SMN1, in 94% of SMA cases, leads to a progressive neuromuscular disease.3
Due to the high prevalence and carrier frequency (1 in 10,000 and 1 in 50, respectively), up to the present time, several molecular diagnostic methods have been developed for SMA detection. These techniques include: Linkage analysis,4 Polymerase Chain Reaction-Restriction Fragment Length Polymorphism (PCR-RFLP),5,6 Amplification Refractory Mutation System-Polymerase Chain Reaction (ARMS-PCR),7 PCR-single-strand conformation polymorphism (SSCP) analysis,8 Real-time PCR,9-11 fiber-optic biosensor,12 Enzyme-linked immunosorbent assay (ELISA),113 Multiplex ligation dependent probe amplification (MLPA),14 Denaturing High-performance Liquid Chromatography (DHPLC),15 Matrix Assisted Laser Desorption Ionization-Time of Flight Mass spectrometry (MALDI-TOF),16 PCR-ELISA,17 sequencing and other methods implemented for other similar SNP-related diseases.18 Of these methods, although PCR-RFLP, MLPA and Real-time PCR are generally used for carrier and affected cases, the mentioned methods suffer from some limitations. All mentioned techniques commonly are time-consuming, expensive, tedious and laborious. Hence, laboratories with limited facilities send their samples to fully-equipped ones. Thus, undoubtedly these constraints necessitate implementation of rapid, easy-performable and cost-effective detection methods.
Over the last two decades, metallic nanoparticles have attracted considerable attention in biology and medicine. Among them, gold nanoparticles (Au NPs) have received great attention for potential biological analysis, in recent years, due to the Surface Plasmon Resonance (SPR) phenomena, which is responsible for their unique size and shape optical dependent properties. Because of having high order of magnitude for extinction coefficients, in addition to the dependence of SPR wavelength and intensity on the dielectric constant of the medium and distance between nanoparticles, Au NPs emerged as a promising tool for analysis of biologically active molecules through colorimetric assay.19-21 In particular, spherical Au NPs due to their stability, shape, highly controllable size, and functionalization have been used for detection of DNA, proteins, small molecules, ions and macromolecules.19 Previously, colorimetric detection of DNA via gold nanoparticles, was introduced by Mirkin’s group.22-24 In their proposed system, two oligo-modified gold nanoparticles were used for detection through the formation of a polymeric network between DNA nanoprobes and target DNA cross linkers which caused a distinguishable color change (red-to- pinkish/purple). Since then, several colorimetric researches have been developed based on cross linking (CL) and non-cross linking (NCL) platforms. In the first mentioned platform, usually two Au-nanoprobes (thiolated oligo-gold nanoparticles) were used for target DNA detection through hybridization crosslinking mechanism,25-32 but in the latter case, NCL method, Au nanoparticles were used in the detection process through salt induction mechanism.33-40 Compared to the CL detection method, the NCL method is faster and does not need precise control of the annealing temperature.19
To the best of our knowledge, there is no result in the literature using gold nanoparticles for SMA detection. The aim of present work was to investigate the potential of NCL method for SMA cases, for the first time, using a synthetic target model. We proposed that the critical exon 7 single mismatch in SMN2 rather than SMN1 can be sufficient to hinder the formation of stable target-nanoprobes which discriminate the affected and also, probably, carrier cases from normal cases.
Materials and methods
Instrumentation
UV–vis absorption spectra were recorded on a Perkin Elmer Lambda 25 UV/vis spectrophotometer and Nanodrop 2000c spectrophotometer (Thermo Scientific, USA). TEM images were carried out on a Philips EM208 90 kV transmission electron microscope. Hydrodynamic diameters of gold NPs were measured using a Zetasizer Nano ZS (England, Malvern). Fluorescence was measured using BioTek Synergy™ H4 Hybrid Multi-Mode Micro plate Reader (BioTek Instruments, USA). Amplification and incubation were done using a Gradient Eppendorf Thermocycler. The image of electrophoresis was captured via UVi TEC (Cambridge, France). The pH of all of the buffer solutions was examined with a Model PB-10 pH meter (Sartorius, Germany). The Centrifugation was done with a Micro 20 Hettich Zentrifugen, and a 5417 R Eppendorf Centrifuge. Photographs were taken by a Canon IXUS 130.
Reagents and chemicals
Chemicals such as: hydrogen tetrachloroaurate (III) trihydrate, sodium citrate tribasic dehydrate, sodium phosphate monobasic, sodium phosphate dibasic, sodium chloride, magnesium chloride, sodium azide, dithiothreitol (DTT), and sodium dodecyl sulfate (SDS) were purchased from Sigma-Aldrich and were of the highest purity available. Thiol-modified oligonucleotides were synthesized by MWG Biotech (Germany). All primers and pGEM easy vectors containing exon 7 and exon 8 contigs of SMN1 and SMN2 were synthesized by Bioneer Company. Dra I and Dde I enzymes were obtained from New England Biolab. Nap-5 column, OliGreen ssDNA Quantitation kit, and QIAquick PCR Purification Kit were bought from GE Healthcare, Invitrogen, and QIAGEN, respectively. Milli-Q water (18.0 MΩ cm) was used throughout the experimental processes.
DNA target amplification and PCR-RFLP
As outlined in Supplementary 1, two synthetic contigs (383 bp lengths) include exon 7 and exon 8 of SMN1 and SMN2 (cloned in two separate pGEM-T easy vectors) exploited as a template DNA in PCR amplification. PCR-RFLP was done based upon van der Steege et al. protocol.5 A 188 and 187 bp fragments of exon 7 and exon 8 of SMN1 and SMN2 genes, respectively, were PCR amplified from the mentioned plasmid vectors. Reverse primer used in PCR-RFLP of exon 7 is a mismatched reverse exon 7 primer (X7-Dra) that creates a DraI restriction site in the SMN2 product. Primers used in PCR-RFLP of exon 8 are non-mismatched primers, as SMN2 gene normally has a recognition site for the restriction enzyme DdeI. For SNP sequence approval of ordered plasmid vector (containing SMN1 and SMN2), after the amplification, the products were digested with Dra I enzyme (for exon 7 of SMN genes) and Dde I enzyme (for exon 8 of SMN genes). The digested products were analyzed by a 10.0 % poly acrylamide gel electrophoresis.7 Primers used in this study are listed in Table 1.5,41 For gold nanoprobe assay, the SMN exon 7 products should be amplified with primers, which do not have any mismatches; otherwise, mismatched primer creates an additional mismatch adjacent to the variant site of the SMN genes which ruins SMA detection from normal and carrier model cases.
Table 1 . Primers and Thiol-probe used in this study .
| Sequence (5---► 3) | |
| exon 7 forward primer | AGACTATCAACTTAATTTCTGATCA |
| exon 7 mismatch reverse primer x7-Dra | CCTTCCTTCTTTTTGATTTTGTTT |
| exon 7 reverse primer | CCTTCCTTCTTTTTGATTTTGTCT |
| exon 8 forward primer | GTAATAACCAAATGCAATGTGAA |
| exon 8 reverse primer | CTACAACACCCTTCTCACAG |
| SMN1 exon 7 thiol probe | HS-(CH2)6-AAAAAAAAAATACAGGGTTTCAGAC |
Probe design
Thiol-Modified oligonucleotides probe (15 nucleotides length) was designed based on the critical nucleotide difference in exon 7 of the SMN genes. The secondary structure of the probe was checked by Oligo 7 software. There was no serious hairpin loop and self-dimer. The probe carrying a poly A spacer sequence begins with a thiol cap at the 5 terminal. This spacer reduces the interactions of the recognition sequence and gold surface, so providing a better condition for target-nanoprobes hybridization.30, 42 Thiol-probe used in this study is presented in Table 1.
Synthesis of Au NPs and Au-nanoprobes
Spherical gold nanoparticles (Au NPs) were synthesized by the well-known citrate reduction technique based on Frenz and Natan protocols.43, 44 Briefly, HAuCl4 aqueous solution (1 mM, 200 mL) was heated with stirring on a hotplate. As it refluxed vigorously, the preheated sodium citrate solution (38.8 mM, 20 mL) was rapidly added. After boiling for 15 min, the heating source was removed and stirring was continued for 15 min. Having the solution reached room temperature, it was filtered through a 0.2 µm membrane acetate filter. The synthesized Au NPs were characterized by a UV–vis spectrophotometer, Zetasizer and TEM.
Au-nanoprobes were produced based on the procedure of Mirkin et al. with a slight modification.24, 45 Briefly, in the first step, to remove the thiolated protecting caps, the Thiol-modified oligonucleotides were treated by DTT (0.1 M) for 2-3 h and then purified with the NAP-5 column. In the second step, an appropriate volume of the freshly reduced thiolated oligonucleotide was added to 1 mL of Au NPs and incubated for 16 h. In the next step, the solution was adjusted with the phosphate buffer and dropped wisely aged with salting buffer to 0.1 M NaCl. Finally, after the last salt addition, the solution was washed with washing buffer through repeated centrifugation at 14000 rpm for 25 min at 4°C for at least three times and finally red oily Au-nanoprobes were resuspended in 500 µL of assay buffer (10 mM phosphate buffer, 0.3 M NaCl; pH 7.4). The final solution was kept in the dark at 4˚C. Convincing evidence for the successful synthesis of Au-nanoprobes was produced by a UV–vis spectrophotometer and Zetasizer. The loading of thiolated probes on gold nanoparticles were quantified using OliGreen ssDNA Quantitation kit.33
Au-nanoprobe hybridization
For gold nanoprobe assay, the SMN exon 7 products were purified by PCR purification kit to remove any inevitable primer dimers, un-consumed dNTPs and also other enzymatic reactions. Gold nanoprobe hybridization process was done in a final volume of 13 µL. The recipe of gold nanoprobe assay was set up containing 10 µL of purified target DNA (final concentration of 34 µg/mL), diluted in 10 mM Tris-Cl (pH 8.5), and 3 µL of gold nanoprobes. After gentle pipetting of the final solution, it was incubated at 95˚C for 10 min. Following half-hour incubation at room temperature, 1 µL of 0.2 M MgCl2 was added to solution. After approximately 20-30 min color development, Uv- vis spectra (using Nanodrop spectrophotometer) and photographs were recorded.
In the first step, homozygote genotypes of SMN genes were checked using gold nanoprobes. To meet this criterion, SMN1 amplicon was used as a homozygote perfect match case (CC genotype), while SMN2 amplicon was used as a homozygote mismatch case (TT genotype). Through this assay, exon 8 of SMN1 and Tris-Cl (pH 8.5) were exploited as a control and blank, respectively.
In the next experiment, semi-quantitative SMN1 gene dosage analysis compared to SMN2 was assessed. In summary, hybridization assay was done simultaneously on heterozygote condition (CT genotype) compared to homozygote condition of SMN1 (100%) and SMN2 (100%). To study homozygous and heterozygous deletions of SMN1 copies (respectively in affected and carrier models) compared to the homozygous SMN2, the SMN1 and SMN2 amplicons were mixed in equal ratio (as a normal model) and 30/70 ratio (as a carrier model). The experiments were repeated at least three times.
Statistical analysis
Statistical analysis was performed using GraphPad Prism software. Difference between nanoprobes and other groups was tested using one-way ANOVA and tukey’s multiple comparison tests.
Results
DNA target amplification and PCR-RFLP
To approve the existence of critical SNP difference between SMN1 and SMN2 in ordered vectors, RFLP was done after PCR amplifications. It can be seen from the data in Fig. 1A that DraI enzyme created 165 bp fragment in the exon 7 of SMN2 amplicon, while the undigested exon 7 of SMN1 amplicon was 188 bp. As shown in Fig. 1B, DdeI enzyme created 123 bp and 64 bp fragments in the exon 8 of SMN2 amplicon, while the undigested exon 8 of SMN1 product was 187 bp. It is worth pointing out that this method was exploited as a control for homozygous absence of SMN1 observed in affected model.5,6
Fig. 1.

PCR-RFLP of SMN genes: (A) exon 7; (B) exon 8
Characterization of synthesized Au NPs and Au-nanoprobes
The characterization of Au NPs was outlined in Fig. 2. As shown, the UV-vis spectrum of the Au NPs exhibited an absorption maximally at 520-521 nm. Dynamic light scattering (DLS) experiments represented that the particle size distribution by number was 12.42 nm. TEM images confirmed DLS data with a particle size of 13 nm ± 2 nm. The concentration of colloidal particles was approximately 11 nM.46,47
Fig. 2.

The characteristics of the Au NPs: (A) the UV-vis spectrum; (B) size distribution of Au NPs by DLS and TEM (inset picture, the scale bar is 10 nm)
The resulting solution of Au-nanoprobes was characterized by an absorption maximally at 524-525 nm. As presented in Fig. 3, a slight shift from 520 to 525 nm was expectable after conjugation of gold nanoparticles due to salt-aged process and also repeated centrifugation. In addition, gold nanoprobes had a slight decrease in absorbance peak at 525 nm as compared to Au NPs. Decrease in Plasmon band absorbance intensity can be attributed to loss of nanoparticles concentration during washing process.24 The particle size distribution by number of Au-nanoprobes estimated from DLS analysis was 18.16 nm. The hydrodynamic radius of Au-nanoprobes, in comparison with Au NPs, increased as a result of the surface loading of thiolated probes on Au NPs. The Au-nanoprobes concentration was approximately 22 nM. As expected, the resulting solution of gold nanoprobes showed great stability against aggregation at high ionic of monovalent salt (e.g., 2.5 M NaCl)33 or low ionic of divalent salts (e.g., 10-20 mM MgCl2) due to thiol conjugation (data not shown). The mentioned results of Au-nanoprobes indicated the success of thiolated probe conjugation.
Fig. 3.

The characteristics of the Au-nanoprobes: (A) the UV-vis spectra, gold nanoprobe (solid line) compared to bare gold nanoparticle (dotted line); (B) size distribution by number of Au-nanoprobe by DLS
Au-nanoprobe hybridization
The first set of analyses examined the capability of gold nanoprobe assay in SNP detection of SMN2 compared to SMN1. The assay was done on homozygote condition of SMN genes (final concentration 10 µg/mL). As outlined in Supplementary 2A, in the presence of the perfect match amplicon (SMN1), the solution to some extent retained the red-purple color and consequently showed a moderate decrease in absorbance peak at 540 nm, while the SMN2 (containing an SNP) amplicons and the unrelated amplicons (exon 8 of SMN1) could not prevent aggregation and their color turned blue/gray. So, as illustrated in Supplementary 2B, the SMN2 showed an extensive aggregation and consequently showed a great aggregation ratio compared to the SMN1. Although it was expected that the control respectively had a great index relative to the SMN2, an opposite result was observed. This unusual data was attributed to the extensive nanoprobes precipitation which lowered the aggregation index ratio of control.48 As shown in Supplementary 3, SNP discrimination of SMN1 from SMN2 and also non-target amplicons such as exon 8 of SMN1 could be approached easily with naked eye at a white background. Ultimately, it should be pointed out that all reaction tubes turned to a clear colorless solution due to the nanoprobes precipitation.
In contrast to SMA patients who had homozygous deletion of SMN1, normal and carrier cases had both allele (SMN1 and SMN2). Hence in this case, heterozygous of SMN genes should be discriminated from homozygous of SMN2 using gold nanoprobes. To achieve this goal, next experiments were designed to differentiate heterozygote cases (two different mixed ratios of SMN1/SMN2) from homozygous of SMN2. In contrast to first experiment, for better differentiation, the following assay was done at a final concentration of 34 µg/mL based on the recommended range of target DNA for SNP detection.34,39 As outlined in Fig. 4A, our data revealed a notable difference, wavelength shift, in absorbance spectra between Au-nanoprobes incubated with the SMN2 versus the SMN1 amplicons. Interestingly, this red shift was related to nanoprobes distance. As nanoprobes were closed together, their original peak shifted to longer wavelengths. Also, it was found by decreasing the final concentrations of SMN1 relative to SMN2, absorption peak at 526 nm attenuated and shifted. From the data shown in Fig. 4B, it is assumed that the lower perfect match DNA (SMN1) mixed with nanoprobes, the more aggregation index ratios observed in SMN2 100% group. This high index can be attributed to lower rate of stable target-nanoprobes hybridization protecting Au-nanoprobes from aggregation. Although the homozygous genotypes of SMN1 and SMN2 were distinguished visually by naked eye, due to gradient color change (red to purple) relative to SMN1 concentrations in heterozygous genotypes (Fig. 5), it was preferable that we exploit the UV-vis spectra and subsequently peak analysis ratio for better differentiation of the heterozygous genotypes from homozygous. It should be pointed out that the perfect hybrids retained their color for hours, but gradually lost their color and finally all reaction tubes turned pale blue to colorless.
Fig. 4.
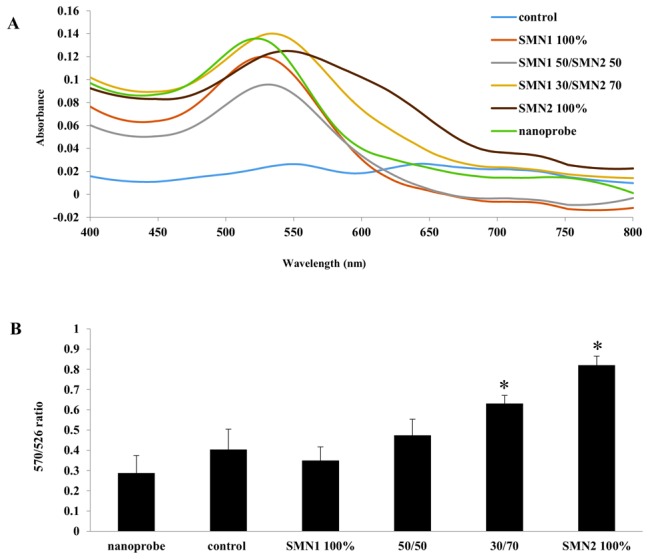
Spectrophotometric analysis graphs: (A) the UV-vis spectra, note that all the Uv/vis curves are denoised for clarity; (B) peak analysis ratio of absorption intensity at 526 and 570 nm: SMN1 100% (homozygote genotype of SMN1), 50/50 (heterozygote genotype of SMN1 and SMN2, 50/50 mixed ratio), 30/70 (heterozygote genotype of SMN1 and SMN2, 30/70 mixed ratio), SMN2 100% (homozygote mismatch genotype of SMN2), respectively. Error bar indicates S.D for three independent assays. Asterisk shows significant (p<0.05) differences compared to nanoprobe.
Fig. 5.

Semi-quantitative SMN1 gene dosage analysis using Au-nanoprobes: a-f represented for nanoprobe, blank, homozygote genotype of SMN1 (100%), heterozygote genotype of SMN1 and SMN2 (50/50 mixed ratio), heterozygote genotype of SMN1 and SMN2 (30/70 mixed ratio), homozygote mismatch genotype of SMN2 (100%), respectively
Discussion
Among autosomal-recessive genetic disorders, SMA has attracted considerable attention in clinical genetic laboratories. Hence, over the last decade, numerous diagnostic methods have been set up for SMA detection. Of these assays, although PCR-RFLP, MLPA and Real-time PCR were exploited more in developing countries, these methods were limited to equipped clinical laboratories. Therefore, implementation of rapid, easy-performable and cost-effective assay for SMA detection encouraged researchers to innovate new methods. Exploiting gold nanoparticles due to their unique optical properties was one of the priorities to meet the mentioned criteria. Gold nanoprobe hybridization assay was demonstrated experimentally by Mirkin et al.; Since then, several articles related to gold nanoprobe-based method were published.19
In the present study, NCL platform was used for discrimination of heterozygous genotypes of SMN genes from homozygous SMN2. In such a system, removing of colloidal stabilization using salt (e.g., MgCl2) played a paramount role in detection process. Bare Au NPs normally were aggregated instantaneously by monovalent salt (<0.1 M NaCl).33 In contrast, due to redistribution of negative charges relevant to surface oligo modification on Au NPs, synthesized Au-nanoprobes were even resistant to divalent salt until they reached to the critical coagulation concentration of electrolyte (e.g., 14 mM MgCl2). At this point, surface charges of nanoprobes were considerably screened. Hence, the electrostatic force between nanoprobes was remarkably attenuated and consequently led to gradual aggregation and color change. In the proposed detection assay, as the surface area of the Au-nanoprobes was covered with the perfect match amplicons (SMN1), the electrosteric repulsion forces among the nanoprobes hindered them from salt-induced aggregation. These forces were diminished while the perfect amplicons (SMN1) relative to mismatched amplicons (SMN2) were decreased. Our results were in agreement with those presented by Baptista et al. where a mismatch (SNP) could not protect Au-nanoprobes from aggregation.34 The orders of the reaction stability were: homozygote genotypes of SMN1 (100%) > heterozygote genotypes of SMN1 (50%) > heterozygote genotypes of SMN1 (30%) > homozygote genotypes of SMN2 (100%), respectively. The data obtained from the different concentrations of amplicons (final concentrations 34, 30, 23 and 12 µg/mL) indicated that although the dynamic range of assay was between 20 and 34 µg/mL, we obtained good results at 34 µg/mL. The data obtained in our study were not at odds with the Baptista et al., where their range was between 18 and 36 µg/mL for SNP detection.34 Despite our results that were consistent with those of Baptista et al., they differed from those presented by Maeda et al. where they used a synthetic target with a size of the same as the probe. Their data showed that the perfect hybrids of target-nanoprobes could not retain their original color upon addition of 0.5 M NaCl.33 This unexpected result later was explained through a structural study of the NCL aggregation mechanism by Fujita et al.50 They assumed that the tight hybridization of target-nanoprobes (perfect match) increased electrosteric repulsion effect. Therefore, it was speculated that the hindrance effect of long DNA length was the main reason of opposite data observed in our experiment compared to Maeda et al. in 2003. Presumably, when the nanoprobes overlapped with some portion of the denaturized DNA, the phosphate backbone of the long free section of DNA created the electrosteric repulsion which hindered the salt-induced aggregation and subsequently color change. On the contrary, as the mismatched target detached from the nanoprobes easily, the electrosteric repulsive force of nanoprobes was attenuated by the screening effect of the salt which consequently changed the color of the reaction from red to blue. Thus, as salt-induced aggregation, it exhibited a red shift from 526 to 550-630 nm. The aggregation index (570/526 ratio) could be used for the detection of SNP.
The advantage of developed assay compared to conventional methods is its simplicity. In addition, time and charges are other benefits of the assay that overcome some of the limitations of more traditional methods. Despite the excellent efficacy and simplicity of the assay, some points such as pipetting error and solution evaporation should be noticed through the assay process. The latter case is probable if the reaction tubes are not capped completely. Altogether, the results of the construct model are encouraging and show that this method can be used as an alternative assay in SMA detection.
In conclusion, we have developed a cheap and easy method for discrimination of homozygous deletion of SMN1 from carrier and normal model cases. We believe that this assay also could be used as a preimplantation genetic screening test for all IVF couples who previously had a child affected by SMA. However, further evaluation of the assay using clinical samples needs to be undertaken. It is anticipated that under the continuous research, the proposed nanodiagnostic method will pave the way prior to real-world use.
Acknowledgments
This work was supported by Cellular and Molecular Biology Research Center, Shahid Beheshti University of Medical Sciences (Ref 7576). We thank Dr Bandehpoor for her valuable technical support. We thank Dr. Baptista for his valuable advice through mail contacts. We also thank Padmavathy et al. for their intimate guidance through mail contacts. We thankfully acknowledge Professor Naderi-Manesh and Dr. Hosseinkhani for allowing us to use their instruments (nanodrop and DLS), in the Biological Sciences faculty of Tarbiat Modares University. This paper is related to the Thesis for Ph.D. degree at Shahid Beheshti University of Medical Sciences by Hossein Ahmadpour Yazdi in 2013-2014.
Ethical issues
There is none to be declared.
Competing interests
The authors declare no conflict of interests.
Footnotes
Supplementary materials
References
- Ogino S, Wilson RB. Genetic testing and risk assessment for spinal muscular atrophy (SMA) Hum Genet . 2002;111:477–500. doi: 10.1007/s00439-002-0828-x. [DOI] [PubMed] [Google Scholar]
- Paushkin S, Gubitz AK, Massenet S, Dreyfuss G. The SMN complex, an assemblyosome of ribonucleoproteins. Curr Opin Cell Biol . 2002;14:305–12. doi: 10.1016/s0955-0674(02)00332-0. [DOI] [PubMed] [Google Scholar]
- Ogino S, Wilson RB. Spinal muscular atrophy: molecular genetics and diagnostics. Expert Rev Mol Diagn . 2004;4:15–29. doi: 10.1586/14737159.4.1.15. [DOI] [PubMed] [Google Scholar]
- MacKenzie AE, Jacob P, Surh L, Besner A. Genetic heterogeneity in spinal muscular atrophy: a linkage analysis-based assessment. Neurology . 1994;44:919–24. doi: 10.1212/wnl.44.5.919. [DOI] [PubMed] [Google Scholar]
- van der Steege G, Grootscholten PM, van der Vlies P, Draaijers TG, Osinga J, Cobben JM. et al. PCR-based DNA test to confirm clinical diagnosis of autosomal recessive spinal muscular atrophy. Lancet . 1995;345:985–6. [PubMed] [Google Scholar]
- Xu R, Ogino S, Lip V, Fang H, Wu BL. Comparison of PCR-RFLP with allele-specific PCR in genetic testing for spinal muscular atrophy. Genet Test . 2003;7:277–81. doi: 10.1089/109065703322783626. [DOI] [PubMed] [Google Scholar]
- Kesari A, Mukherjee M, Mittal B. Mutation analysis in spinal muscular atrophy using allele-specific polymerase chain reaction. Indian J Biochem Biophys . 2003;40:439–41. [PubMed] [Google Scholar]
- Semprini S, Tacconelli A, Capon F, Brancati F, Dallapiccola B, Novelli G. A single strand conformation polymorphism-based carrier test for spinal muscular atrophy. Genet Test . 2001;5:33–7. doi: 10.1089/109065701750168662. [DOI] [PubMed] [Google Scholar]
- Feldkotter M, Schwarzer V, Wirth R, Wienker TF, Wirth B. Quantitative analyses of SMN1 and SMN2 based on real-time lightCycler PCR: fast and highly reliable carrier testing and prediction of severity of spinal muscular atrophy. Am J Hum Genet . 2002;70:358–68. doi: 10.1086/338627. [DOI] [PMC free article] [PubMed] [Google Scholar]
- Abbaszadegan MR, Keify F, Ashrafzadeh F, Farshchian M, Khadivi-Zand F, Teymoorzadeh MN. et al. Gene dosage analysis of proximal spinal muscular atrophy carriers using real-time PCR. Arch Iran Med . 2011;14:188–91. [PubMed] [Google Scholar]
- Maranda B, Fan L, Soucy JF, Simard L, Mitchell GA. Spinal muscular atrophy: clinical validation of a single-tube multiplex real time PCR assay for determination of SMN1 and SMN2 copy numbers. Clin Biochem . 2012;45:88–91. doi: 10.1016/j.clinbiochem.2011.10.019. [DOI] [PubMed] [Google Scholar]
- Watterson JH, Raha S, Kotoris CC, Wust CC, Gharabaghi F, Jantzi SC. et al. Rapid detection of single nucleotide polymorphisms associated with spinal muscular atrophy by use of a reusable fibre-optic biosensor. Nucleic Acids Res . 2004;32:1–9. doi: 10.1093/nar/gnh013. [DOI] [PMC free article] [PubMed] [Google Scholar]
- Kobayashi DT, Olson RJ, Sly L, Swanson CJ, Chung B, Naryshkin N. et al. Utility of survival motor neuron ELISA for spinal muscular atrophy clinical and preclinical analyses. PLoS One . 2011;6:e24269. doi: 10.1371/journal.pone.0024269. [DOI] [PMC free article] [PubMed] [Google Scholar]
- Alias L, Bernal S, Barcelo MJ, Also-Rallo E, Martinez-Hernandez R, Rodriguez-Alvarez FJ. et al. Accuracy of marker analysis, quantitative real-time polymerase chain reaction, and multiple ligation-dependent probe amplification to determine SMN2 copy number in patients with spinal muscular atrophy. Genet Test Mol Biomarkers . 2011;15:587–94. doi: 10.1089/gtmb.2010.0253. [DOI] [PubMed] [Google Scholar]
- Sutomo R, Akutsu T, Takeshima Y, Nishio H, Sadewa AH, Harada Y. et al. Rapid SMN1 deletion test using DHPLC to screen patients with spinal muscular atrophy. Am J Med Genet . 2002;113:225–6. doi: 10.1002/ajmg.10744. [DOI] [PubMed] [Google Scholar]
- Kao HY, Su YN, Liao HK, Liu MS, Chen YJ. Determination of SMN1/SMN2 gene dosage by a quantitative genotyping platform combining capillary electrophoresis and MALDI-TOF mass spectrometry. Clin Chem . 2006;52:361–9. doi: 10.1373/clinchem.2005.061192. [DOI] [PubMed] [Google Scholar]
- Knight Jc Fau, McGuire W Fau, Kortok Mm Fau, Kwiatkowski D. Accuracy of genotyping of single-nucleotide polymorphisms by PCR-ELISA allele-specific oligonucleotide hybridization typing and by amplification refractory mutation system. Clinical Chemistry . 1999;45:1860–3. [PubMed] [Google Scholar]
- Ali ME, Hashim U, Mustafa S, Man YB, Yusop MH, Bari MF. et al. Nanoparticle sensor for label free detection of swine DNA in mixed biological samples. Nanotechnology . 2011;22:195503. doi: 10.1088/0957-4484/22/19/195503. [DOI] [PubMed] [Google Scholar]
- Zhao W, Brook MA, Li Y. Design of gold nanoparticle-based colorimetric biosensing assays. ChemBioChem . 2008;9:2363–71. doi: 10.1002/cbic.200800282. [DOI] [PubMed] [Google Scholar]
- Radwan SH, Azzazy HM. Gold nanoparticles for molecular diagnostics. Expert Rev Mol Diagn . 2009;9:511–24. doi: 10.1586/erm.09.33. [DOI] [PubMed] [Google Scholar]
- Giljohann DA, Seferos DS, Daniel WL, Massich MD, Patel PC, Mirkin CA. Gold nanoparticles for biology and medicine. Angewandte Chemie - International Edition . 2010;49:3280–94. doi: 10.1002/anie.200904359. [DOI] [PMC free article] [PubMed] [Google Scholar]
- Mirkin CA, Letsinger RL, Mucic RC, Storhoff JJ. A DNA-based method for rationally assembling nanoparticles into macroscopic materials. Nature . 1996;382:607–9. doi: 10.1038/382607a0. [DOI] [PubMed] [Google Scholar]
- Elghanian R, Storhoff JJ, Mucic RC, Letsinger RL, Mirkin CA. Selective colorimetric detection of polynucleotides based on the distance-dependent optical properties of gold nanoparticles. Science . 1997;277:1078–81. doi: 10.1126/science.277.5329.1078. [DOI] [PubMed] [Google Scholar]
- Storhoff JJ, Elghanian R, Mucic RC, Mirkin CA, Letsinger RL. One-pot colorimetric differentiation of polynucleotides with single base imperfections using gold nanoparticle probes. Journal of the American Chemical Society . 1998;120:1959–64. [Google Scholar]
- Murphy D, O’Brien P, Redmond G. Sub-picomole colorimetric single nucleotide polymorphism discrimination using oligonucleotide-nanoparticle conjugates. Analyst . 2004;129:970–4. doi: 10.1039/b408394f. [DOI] [PubMed] [Google Scholar]
- Cao YC, Jin R, Thaxton CS, Mirkin CA. A two-color-change, nanoparticle-based method for DNA detection. Talanta . 2005;67:449–55. doi: 10.1016/j.talanta.2005.06.063. [DOI] [PubMed] [Google Scholar]
- Du BA, Li ZP, Liu CH. One-step homogeneous detection of DNA hybridization with gold nanoparticle probes by using a linear light-scattering technique. Angewandte Chemie - International Edition . 2006;45:8022–5. doi: 10.1002/anie.200603331. [DOI] [PubMed] [Google Scholar]
- Qin WJ, Yung LY. Nanoparticle carrying a single probe for target DNA detection and single nucleotide discrimination. Biosens Bioelectron . 2009;25:313–9. doi: 10.1016/j.bios.2009.07.013. [DOI] [PubMed] [Google Scholar]
- Qin WJ, Yim OS, Lai PS, Yung LY. Dimeric gold nanoparticle assembly for detection and discrimination of single nucleotide mutation in Duchenne muscular dystrophy. Biosens Bioelectron . 2010;25:2021–5. doi: 10.1016/j.bios.2010.01.028. [DOI] [PubMed] [Google Scholar]
- Oh JH, Lee JS. Designed hybridization properties of DNA-gold nanoparticle conjugates for the ultraselective detection of a single-base mutation in the breast cancer gene BRCA1. Anal Chem . 2011;83:7364–70. doi: 10.1021/ac201291y. [DOI] [PubMed] [Google Scholar]
- Soo PC, Horng YT, Chang KC, Wang JY, Hsueh PR, Chuang CY. et al. A simple gold nanoparticle probes assay for identification of Mycobacterium tuberculosis and Mycobacterium tuberculosis complex from clinical specimens. Mol Cell Probes . 2009;23:240–6. doi: 10.1016/j.mcp.2009.04.006. [DOI] [PubMed] [Google Scholar]
- Zagorovsky K, Chan WC. A Plasmonic DNAzyme Strategy for Point-of-Care Genetic Detection of Infectious Pathogens. Angew Chem Int Ed Engl . 2013;52:3168–71. doi: 10.1002/anie.201208715. [DOI] [PubMed] [Google Scholar]
- Sato K, Hosokawa K, Maeda M. Rapid aggregation of gold nanoparticles induced by non-cross-linking DNA hybridization. J Am Chem Soc . 2003;125:8102–3. doi: 10.1021/ja034876s. [DOI] [PubMed] [Google Scholar]
- Doria G, Franco R, Baptista P. Nanodiagnostics: fast colorimetric method for single nucleotide polymorphism/mutation detection. IET Nanobiotechnol . 2007;1:53–7. doi: 10.1049/iet-nbt:20070001. [DOI] [PubMed] [Google Scholar]
- Padmavathy B, Vinoth Kumar R, Jaffar Ali BM. A direct detection of Escherichia coli genomic DNA using gold nanoprobes. J Nanobiotechnology . 2012;10:8. doi: 10.1186/1477-3155-10-8. [DOI] [PMC free article] [PubMed] [Google Scholar]
- Mollasalehi H, Yazdanparast R. Non-crosslinking gold nanoprobes for detection of nucleic acid sequence-based amplification products. Anal Biochem . 2012;425:91–5. doi: 10.1016/j.ab.2012.03.008. [DOI] [PubMed] [Google Scholar]
- Li H, Rothberg L. Colorimetric detection of DNA sequences based on electrostatic interactions with unmodified gold nanoparticles. Proc Natl Acad Sci U S A . 2004;101:14036–9. doi: 10.1073/pnas.0406115101. [DOI] [PMC free article] [PubMed] [Google Scholar]
- Lee H, Joo SW, Lee SY, Lee CH, Yoon KA, Lee K. Colorimetric genotyping of single nucleotide polymorphism based on selective aggregation of unmodified gold nanoparticles. Biosens Bioelectron . 2010;26:730–5. doi: 10.1016/j.bios.2010.06.050. [DOI] [PubMed] [Google Scholar]
- Shawky SM, Bald D, Azzazy HM. Direct detection of unamplified hepatitis C virus RNA using unmodified gold nanoparticles. Clin Biochem . 2010;43:1163–8. doi: 10.1016/j.clinbiochem.2010.07.001. [DOI] [PubMed] [Google Scholar]
- Ganbold EO, Kang T, Lee K, Lee SY, Joo SW. Aggregation effects of gold nanoparticles for single-base mismatch detection in influenza A (H1N1) DNA sequences using fluorescence and Raman measurements. Colloids Surf B Biointerfaces . 2012;93:148–53. doi: 10.1016/j.colsurfb.2011.12.026. [DOI] [PubMed] [Google Scholar]
- Lefebvre S, Burglen L, Reboullet S, Clermont O, Burlet P, Viollet L. et al. Identification and characterization of a spinal muscular atrophy-determining gene. Cell . 1995;80:155–65. doi: 10.1016/0092-8674(95)90460-3. [DOI] [PubMed] [Google Scholar]
- Kim EY, Stanton J, Vega RA, Kunstman KJ, Mirkin CA, Wolinsky SM. A real-time PCR-based method for determining the surface coverage of thiol-capped oligonucleotides bound onto gold nanoparticles. Nucleic Acids Research . 2006;34:e54. doi: 10.1093/nar/gkl147. [DOI] [PMC free article] [PubMed] [Google Scholar]
- Frens G. Controlled nucleation for the regulation of the particle size in monodisperse gold suspensions. Nature . 1973;241:20–2. [Google Scholar]
- Grabar KC, Griffith Freeman R, Hommer MB, Natan MJ. Preparation and characterization of Au colloid monolayers. Anal Chem . 1995;67:735–43. [Google Scholar]
- Hill HD, Mirkin CA. The bio-barcode assay for the detection of protein and nucleic acid targets using DTT-induced ligand exchange. Nature Protocols . 2006;1:324–36. doi: 10.1038/nprot.2006.51. [DOI] [PubMed] [Google Scholar]
- Haiss W, Thanh NT, Aveyard J, Fernig DG. Determination of size and concentration of gold nanoparticles from UV-vis spectra. Anal Chem . 2007;79:4215–21. doi: 10.1021/ac0702084. [DOI] [PubMed] [Google Scholar]
- Liu X, Atwater M, Wang J, Huo Q. Extinction coefficient of gold nanoparticles with different sizes and different capping ligands. Colloids Surf B Biointerfaces . 2007;58:3–7. doi: 10.1016/j.colsurfb.2006.08.005. [DOI] [PubMed] [Google Scholar]
- Baptista P, Doria G, Henriques D, Pereira E, Franco R. Colorimetric detection of eukaryotic gene expression with DNA-derivatized gold nanoparticles. J Biotechnol . 2005;119:111–7. doi: 10.1016/j.jbiotec.2005.02.019. [DOI] [PubMed] [Google Scholar]
- Veigas B, Machado D, Perdigao J, Portugal I, Couto I, Viveiros M. et al. Au-nanoprobes for detection of SNPs associated with antibiotic resistance in Mycobacterium tuberculosis. Nanotechnology . 2010;21:415101. doi: 10.1088/0957-4484/21/41/415101. [DOI] [PubMed] [Google Scholar]
- Fujita M, Katafuchi Y, Ito K, Kanayama N, Takarada T, Maeda M. Structural study on gold nanoparticle functionalized with DNA and its non-cross-linking aggregation. J Colloid Interface Sci . 2012;368:629–35. doi: 10.1016/j.jcis.2011.11.021. [DOI] [PubMed] [Google Scholar]
Associated Data
This section collects any data citations, data availability statements, or supplementary materials included in this article.
Supplementary Materials
contains the supplementaries 1, 2 and 3.