

Abstract
This paper documents the spectral and spatial performance characteristics of two new versions of the Daysimeter, devices developed and calibrated by the Lighting Research Center to measure and record personal circadian light exposure and activity levels, and compares them to those of the Actiwatch Spectrum (Philips Healthcare). Photometric errors from the Daysimeters and the Actiwatch Spectrum were also determined for various types of light sources. The Daysimeters had better photometric performance than the Actiwatch Spectrum. To assess differences associated with measuring light and activity levels at different locations on the body, older adults wore four Daysimeters and an Actiwatch Spectrum for five consecutive days. Wearing the Daysimeter or Actiwatch Spectrum on the wrist compromises accurate light measurements relative to locating a calibrated photosensor at the plane of the cornea.
Keywords: light exposure, rest/activity patterns, circadian system, photometric devices
1. Background
The characteristics of retinal light exposures affecting the various channels of the human visual system are quite different than those affecting the circadian system due to different neural processing for these two systems.1 The visual system exhibits a large dynamic response range, from faint starlight to full sun, over some 9 or 10 orders of magnitude. As shown by acute melatonin suppression, the circadian system exhibits a high threshold and rapid saturation response characteristic to optical radiation incident on the retina, with dynamic range of no more than 2 orders of magnitude.2 Even though some of the same photoreceptors participate in both the visual and circadian systems, the two systems have very different spectral sensitivities to light. The circadian system is maximally sensitive to short wavelengths (λmax ≈ 460 nm), whereas the fovea, used for high spatial resolution, has peak sensitivity at longer wavelengths (λmax = 555 nm).3
Because of these differences, devices designed to measure light as it affects the visual or the circadian systems should be calibrated with reference to the physiological differences between these two systems. Importantly too, the design and calibration should be well-documented so that the values generated by these devices can be understood by their users. An important purpose of the present paper was to document the design and calibration of two new form factors for the Daysimeter, developed and calibrated by the Lighting Research Center (Troy, NY, USA),4 and the Actiwatch Spectrum, manufactured and sold by Philips Healthcare (Eindhoven, The Netherlands).5 All of these devices are designed to measure light exposures and activity levels over extended periods of time while deployed in the field. One study characterized the Actiwatch Spectrum in terms of activity patterns and sleep quality,6 another study used the device to record personal light exposures,7 and one recent publication reported on its basic technical characteristics.8 The technical characteristics of an earlier version of the Daysimeter have been published.4 Moreover, the original Daysimeter has been used to study circadian disruption in several sample populations: 1) nurses;9, 10 2) school children;11 3) schoolteachers;12 and 4) young adults.13
Because the original Daysimeter was relatively large and needed good structural support to be worn on the head, new form factors for the device were developed to help increase research participant compliance for acquiring continuous personal light exposure and activity level data from the field. A purpose of this paper was to document the spectral and spatial performance characteristics of two new form factors of the Daysimeter and to compare them to those of the Actiwatch Spectrum.
Since light reaching the retina is important for stimulating the human circadian system and since the new versions of the Daysimeter can be worn at many locations on the body, including near the eye, another important purpose of this study was to compare simultaneously recorded light and activity measurements from different parts of the body. Field measurements of light and activity were collected for five consecutive days from 12 healthy older adults simultaneously wearing four Daysimeters (at the eye, on the wrist, as a pendant on a lanyard hung from the neck, and on the torso as a pin) and the Actiwatch Spectrum (on the wrist).
2. Device Comparisons
2.1. Overview
In order to address the lack of any photometric measuring systems that would characterize retinal optical radiation for the human circadian system, the Daysimeter was developed by the Lighting Research Center, Rensselaer Polytechnic Institute.4 The Daysimeter was designed to measure and record circadian light exposures for extended periods of time in the field. Moreover, using data collected with the device, analytical methods were developed to determine circadian entrainment and disruption in different human populations by comparing circadian light/dark patterns with activity/rest patterns.9, 10 The first version of the Daysimeter employed two photosensors, separately calibrated to provide a photopic and a short-wavelength (“blue”) response to optical radiation. This version of the Daysimeter also contained two solid-state, orthogonally oriented accelerometers that responded to movements with respect to Earth's gravitational field. Data from the two photosensor channels could be downloaded to a host computer and converted into illuminance, circadian light (CLA), and circadian stimulus (CS) levels.1 Briefly, illuminance is irradiance weighted by the photopic luminous efficiency function (V(λ)), an orthodox measure of the spectral sensitivity of the human fovea, peaking at 555 nm. CLA is irradiance weighted by the spectral sensitivity of the retinal phototransduction mechanisms stimulating the SCN, based on nocturnal melatonin suppression.1 CS is a transformation of CLA into relative units from 0, the threshold for circadian system activation, to 0.7, response saturation. The activity data from the two accelerometers could also be downloaded and combined into a measure of activity. All data had a common timestamp so that phasor analyses could be performed to quantify circadian disruption.9, 10
Two new versions of the Daysimeter were designed to be smaller and less obtrusive for users and, therefore, increase compliance in the field. One version, Daysimeter-S (Figure 1), was designed, like the first version of the Daysimeter, to have the photosensors positioned at the plane of the cornea while being worn. This new version has a much smaller profile than the original Daysimeter so it can be attached to spectacles or to an unobtrusive head-wire (Figure 1). The finished circuit board holding the photosensors and the accelerometers of the Daysimeter-S version is 73 × 5 × 5 mm and connected by a wire to a second circuit board holding a microcontroller, a USB interface, the memory chip, and a coin-cell battery. The second new version, Daysimeter-D (Figure 2), was designed to be worn at a wide variety of locations on the body that the experimenter and participant might deem appropriate or comfortable. The Daysimeter-D sample in Figure 2 is fitted with a clip for attaching to a shirt collar, lapel, or hat. Other versions can be attached to a wristband, to a lanyard to be worn as a pendant, to a badge, and to glasses (spectacles). Daysimeter-D versions are approximately 2 cm in diameter; slightly larger than the size of a US $0.10 piece (a dime). The electronics and coin-cell battery are all encased in epoxy, making it waterproof. Communication with the device is through an optical interface.
Figure 1.
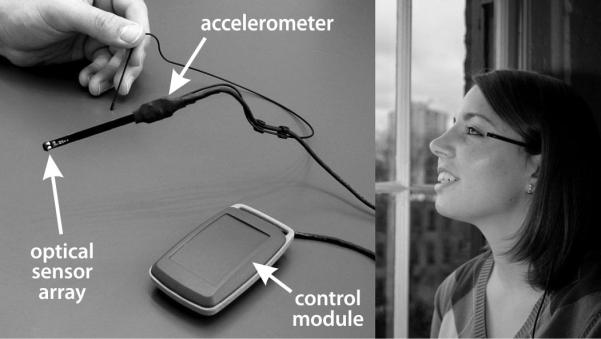
View of Daysimeter-S and a subject wearing the device. The monolithic accelerometer is located on the same circuit board as the optical sensor array which, when worn, is located at or near the plane of the cornea. This circuit board is connected by a shielded wire to a second circuit board encased in a control module which contains the coin-cell battery, the memory chip, a microcontroller, and a USB interface for communicating with this version of the Daysimeter.
Figure 2.
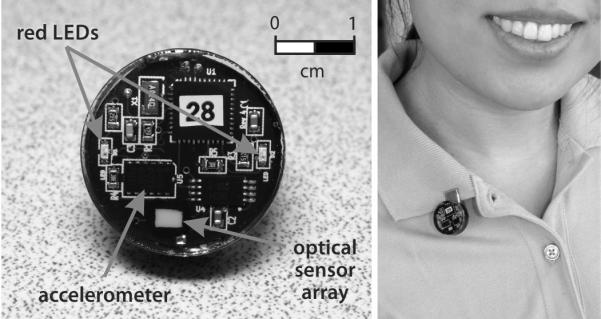
Front view of Daysimeter-D and a subject wearing the device. The optical sensor array and the monolithic accelerometer are indicated along with the two red light emitting diodes used for interfacing this version of the Daysimeter with the docking station (not shown). The coin-cell battery powering the device is on the back-side of the circuit board.
Like the original, the new versions of the Daysimeter measure and record light and activity levels continuously over many days. Unlike the original Daysimeter, the new versions contain a red-green-blue (RGB), solid-state photosensor package, but the post-processing is similar to that of the original Daysimeter, and the RGB values are also converted into illuminance, CLA, and CS levels.1 Also unlike the original Daysimeter, a three-axis, rather than a two-axis, solid-state accelerometer package is used to estimate an Activity Index (AI).
The Actiwatch Spectrum is a commercially available device that can also be used for continuously measuring activity and light. As the name implies, the Actiwatch Spectrum is designed to be worn on the wrist. The technical specifications of the activity and light measuring system in the Actiwatch Spectrum are not publicly available. The manufacturer does report a wavelength sensitivity range between 400 and 700 nm for its RGB photosensor system. The manufacturer reports an accuracy of 10% at 1500 lux when measuring photopic illuminance. A report on the photometric characteristics of the RGB photosensor system of the Actiwatch Spectrum has been recently published.8
2.2. Basic performance characteristics
2.2.1. Light Measurements
The different devices each report photopic illuminance values in lux. Figure 3 shows the spectral response of a Daysimeter device and that of an Actiwatch Spectrum compared to V(λ). Discrepancies between V(λ) and the spectral response of a photometric instrument are characterized by the f1' statistic;14 a lower value of f1' indicates a closer match to V(λ). Values of f1' are included in Figure 3 for the examples tested. As can be readily appreciated by a visual comparison of the graphs in Figure 3, reinforced by their associated f1' values, the photopic response of the new Daysimeters is more similar to V(λ) than the Actiwatch Spectrum.
Figure 3.
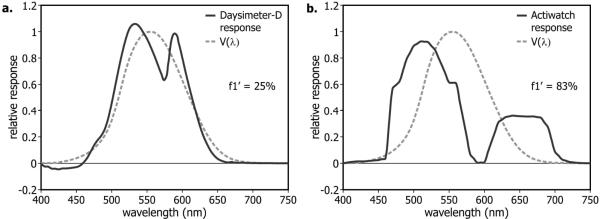
Relative spectral response of the Daysimeter, both S and D versions, (a) and the Actiwatch Spectrum (b).
Four sample Daysimeters were tested and each gave nearly identical f1' values [mean ± standard deviation (SD) = 24.7 ± 0.82%]. Price et al. did not report an f1' statistic for the 16 Actiwatch Spectrum devices they tested, but they did report fairly large statistical variations among Actiwatch Spectrum measurements at different wavelengths; their reported mean/SD values were always above 10% at any wavelength.8 This variation would be expected to translate into variable illuminance level readings for the same lighting condition, as was confirmed and is reported in the next section of the present paper.
The spatial response of a photometric instrument is also important because accurate illuminance measurements depend upon a three-dimensional cosine sensitivity to incident radiation.14 Figure 4 shows the spatial sensitivities of the RGB channels of a Daysimeter together with those of an Actiwatch Spectrum compared to a cosine distribution. Discrepancies between a cosine distribution and the spatial sensitivity of a photometric instrument are characterized by the f2 statistic;14 these values are included in Figure 4. As can be readily appreciated by a visual comparison of the graphs in Figure 4, supported by their associated f2 values, the spatial sensitivities of the Daysimeters are much better than those of the three channels of the Actiwatch Spectrum measured in one plane. The major reason for the difference in spatial sensitivities lies in the photosensor arrays chosen for the different devices. As reported by Price et al., the three sensors of the Actiwatch Spectrum are placed along the major axis of a shallow depression.8 Thus, depending upon the measurement plane, parallel or perpendicular to the major axis, the sides of the shallow depression can shadow incident light reaching a photosensor element. In contrast, there are 40 elements in the photosensor array used in the new versions of the Daysimeter, and these are positioned under an opal glass diffuser. As a result, there is no selective shadowing at any incident angle for the Daysimeter photosensor array and, as would be expected, the f2 statistics in Figure 4 are much lower than those for the Actiwatch Spectrum, suggesting that the Daysimeters have a spatial distribution that is closer to a cosine distribution than the Actiwatch Spectrum. It should also be noted that the spatial response of the human eye is much like a three-dimensional cosine sensitivity, notwithstanding occlusion by the nose and brow.15
Figure 4.
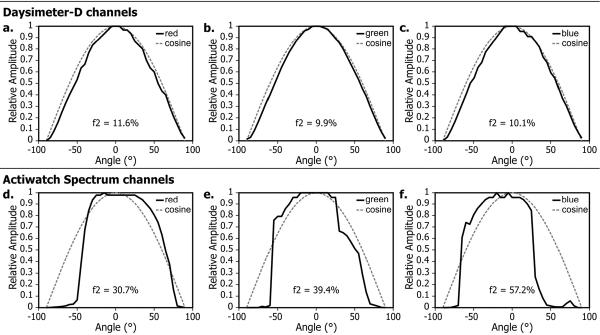
Spatial sensitivity of the three Daysimeter channels, both S and D versions, (a, b, c) and the three Actiwatch Spectrum channels (d, e, f) compared to a cosine distribution.
Finally, the absolute response of a photometric device is important for providing accurate illuminance measurements. The response linearity of the Daysimeters and of the Actiwatch Spectrum were assessed using an integrating sphere and a 532-nm laser with a variety of neutral density filters to obtain a wide range of monochromatic and spatially consistent irradiance levels for each of the devices to measure. Figure 5 shows that both types of instruments are highly linear over several orders of magnitude.
Figure 5.
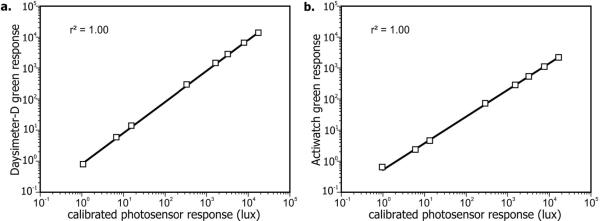
Absolute response characteristics of the Daysimeter, both S and D versions, (a) and the Actiwatch Spectrum (b). Standard deviations are smaller than the size of the symbols in both graphs.
2.2.2. Activity Measurements
The new versions of the Daysimeter measure activity using three orthogonal accelerometers contained within a single electronic sensor package (ADXL345, Analog Devices, Norwood, MA, USA). The sensor outputs digital data via an I2C interface that enables communication with the Daysimeter microcontroller (MSP430F2274, Texas Instruments, Dallas, TX, USA). Each accelerometer outputs a 16-bit digital value (count) that is proportional to the measured acceleration, and the data sheet for the accelerometers states that one g (1 g = 9.8 m/s2) corresponds to a difference in counts between 232 and 286, yielding hypothetical limits for conversion factors of 0.0043 and 0.0035 g/count. Two Daysimeters were selected to verify the values in the accelerometer data sheet and were placed on a platform that could be rotated in three dimensions. Testing all three dimensions multiple times for each device yielded counts between 238 and 277 for one g, which falls in the range specified in the data sheet. For all new Daysimeters then, the average conversion factor of 0.0039 g/count is used. Accelerometer values are continuously acquired at a 6.25 Hz sampling rate. Once per second, the sum of squared differences from the mean value over the 30-second logging interval for that accelerometer is computed. An AI is derived every 30 seconds using the following formula:
where SSx, SSy, and SSz are the sum of the squared differences from the mean for the 30-second logging interval, n is the number of samples, and k is the factor equal to 0.0039 g/count. In other words, AI is the root-mean-square (RMS) deviation in acceleration in three dimensions measured for every 30-second logging interval. For 60-second logging intervals, the two 30-second AI values in each logging interval are averaged together to yield an overall AI value for the interval, the three 30-second AI values in a 90-second logging interval are averaged together to yield and overall AI value for that interval, and so on for longer logging intervals.
According to the manufacturer, the accelerometer package in the Actiwatch Spectrum samples at 32 Hz over a range from 0.5 to 2 g with an approximate resolution of 0.025 g at a two count level.5 When the data are downloaded from the device, a measure called “Activity” corresponding to each time interval is available, though no public information detailing the methods used to compute the “Activity” are available. The fact that a large percentage of the values are typically zero and the range specified only goes down to 0.5 g suggests that measurements below 0.5 g are assigned a value of zero. No side-by-side laboratory measurements of activity levels were undertaken to compare the AI from the Daysimeter to the “Activity” counts from the Actiwatch Spectrum; only field measurement comparisons were undertaken. These are described in a later section of the present paper.
2.3. Photometric Performance for different light sources
Given their similar form factors, six samples each of the Daysimeter-D version and the Actiwatch Spectrum were selected to assess photometric errors from these devices while recording photopic illuminance provided by several commercially available light sources. To ensure that all 12 devices received the same time-averaged illuminance they were mounted on a rotating disc under diffuse illumination provided, in turn, by five practical light sources. The disc was rotated at 12 revolutions per minute for five minutes. Average values from each device were compared to those obtained from a laboratory-grade, calibrated illuminance meter (X91, Gigahertz-Optik, Türkenfeld, Germany). This photometric device is considered to be a DIN class B photometer16 with a manufacturer's reported f1' value of 5% and a reported f2 value of 3%. Table 1 compares the photometric data obtained from this methodology for the different devices for the five light sources.
Table 1.
Mean ± standard deviation (SD) errors in photopic illuminance measurements, relative to a calibrated meter (Gigahertz-Optik), from six Daysimeter (Daysimeter-D) and six Actiwatch Spectrum devices under diffuse illumination from six different practical light sources.
| Source | Calibrated light meter (lux) | Daysimeter (lux) | Daysimeter measurement error (%) | Daysimeter measurement range (lux) | Actiwatch (lux) | Actiwatch measurement error (%) | Actiwatch measurement range (lux) |
|---|---|---|---|---|---|---|---|
| Philips | 427 | 430±5.83 | 0.65±1.37 | 422 – 440 (range = 4%) | 585±20.5 | 37.1±4.80 | 564 – 619 (range = 9%) |
| F32/T8/TL/735 (3500 K fluorescent) | |||||||
|
| |||||||
| GE | 193 | 191±2.37 | −1.21±1.22 | 188 – 195 (range = 3%) | 332±13.5 | 71.9±6.99 | 309 – 349 (range =11%) |
| F55BX/AR/FS (9000 K fluorescent) | |||||||
|
| |||||||
| Sylvania LU 250 (high pressure sodium) | 103 | 96.4±2.49 | −6.70±2.41 | 92.1 – 99.0 (range = 7%) | 40.2±1.54 | −61.1±1.49 | 38.3 – 48.3 (range = 20%) |
|
| |||||||
| Daylight | 1944 | 1950±31.4 | 0.29±1.61 | 1920 – 1991 (range = 4%) | 3886±160 | 99.9±8.20 | 3649 – 4141 (range = 12%) |
|
| |||||||
| Beta Edge 5760 K | 75.4 | 71.5±0.89 | −5.27±1.18 | 70.2 – 72.5 (range = 3%) | 81.9±6.39 | 8.54±8.48 | 73.4 – 89.7 (range =18%) |
| LED | |||||||
The photometric errors are smaller for the Daysimeter (max error = 6.7%) than those of the Actiwatch Spectrum (max error = 99.9%) and, as implied in the Price et al. report,8 the variation in photometric values among the same device type is much smaller for the Daysimeters (max difference = 7%) than for the Actiwatch Spectrums (max difference = 20%).
3. Field Testing
3.1. Participants
Field data collected over five consecutive days from 12 participants were selected for comparing the performance characteristics of the Daysimeters and the Actiwatch Spectrum. The study ran from August 2010 through January 2011. Participants were healthy volunteers over the age of 65 (mean ± SD = 71, ± 4.4 years) and lived in the greater Albany, NY area. A research nurse evaluated the physical health of potential participants via interviews, and only participants who scored above 24 on the Mini–Mental State Examination were allowed to participate in the study.17 None of the participants lived in nursing homes or were hospitalized during the study, and all participants scored a zero (independent) on the Minimum Data Set Activities of Daily Living Scale 18 for the week prior to their participation in the study. All participants signed an informed consent form approved by Rensselaer Polytechnic Institute's Institutional Review Board. Participants were paid for their participation in the study.
3.2. Procedures
Each participant was asked to wear one Actiwatch Spectrum and four Daysimeters for seven consecutive days. One Daysimeter (Daysimeter-D) was attached to the Actiwatch Spectrum wristband so that the sensors of each device were facing up when participants were wearing the wristband. One Daysimeter-D was worn as a pin on the torso and another was worn as a pendant hung from a strap around the neck. A Daysimeter-S was mounted on the participant's spectacle frame if he/she normally wore glasses, or on a headband otherwise. Participants were asked to wear the all four devices continuously for seven days while awake. The Actiwatch Spectrum and the Daysimeter on the wrist were worn continuously, including the times when they were sleeping or showering.
3.3. Data Analyses and Results
To directly assess differences between the Actiwatch Spectrum and the Daysimeters, we compared the photopic illuminance (in lux) and the activity levels obtained with the two devices when worn on the wrist. Light and activity levels from the two wrist-mounted devices were compared because a) they were always mounted at the same body location, b) they were both calibrated in terms of photopic illuminance, and c) they were continuously worn during the study.
To directly assess the impact of the light sensor placement, we compared light levels obtained from the Daysimeter mounted near the plane of the cornea with those levels obtained from Daysimeters worn at the other three locations (wrist, pendant, and pin). The Daysimeters' RGB sensor data were converted into photopic illuminance, circadian light (CLA), and circadian stimulus (CS) levels.1, 12, 19
The sampling rates of the Daysimeters were set at 30, 60, or 180 seconds. All data were downsampled into daily hourly bins of light exposure and of activity, so these differences in sampling rate were not important for the analyses. Periods of time greater than 30 minutes when there was no recorded activity were defined as “not being worn” for both devices, and those data were removed before analyses. All estimates of the central tendencies of the measured photopic illuminance levels were based upon the geometric mean rather than the arithmetic mean because light level exposures are so highly positively skewed. For all devices, recorded values less than 0.1 lux were set to 0.1 lux because the devices were not accurate below 0.1 lux and because any recorded value of 0 lux would be undefined when calculating the geometric mean. When comparing activity levels from the wrist Daysimeter and the Actiwatch Spectrum, all data could be used for analyses because subjects wore the wristband-mounted devices continuously (i.e., both night and day); the central tendencies of activity levels were based upon an arithmetic mean. Of the seven days, the 5 consecutive days with the fewest examples of device failures or participant non-compliance were used.
Figure 6 shows the hourly average CS (top row) and photopic illuminance (bottom row) values obtained with the Daysimeters located at different locations on the body. The data from the Daysimeter located at the eye is shown by the upper histogram bars in each graph and the data from the Daysimeters attached by pin, on a pendant, and on the wrist are shown by the lower, shaded histogram bars in each graph. The Daysimeter readings at the eye were arbitrarily assigned positive values and the Daysimeter readings on other parts of the body negative values. The solid black line represents the sum of the positive and (negative) Dayimesimeter values. When the solid black line is above zero, the Daysimeter values at the eye were higher than the Dayimesimeter values at other locations for that hour. One-Sample two-tailed T tests were performed on the hourly average differences from 06:00 hr to 23:00 hr.
Figure 6.
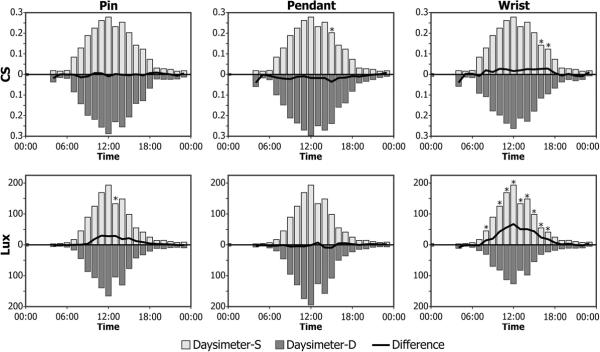
Comparisons of light measurements from the Daysimeter-S located at the plane of the cornea (upper histogram bars) and Daysimeter-Ds located at different parts of the body (lower shaded histogram bars) of 12 participants from the field study. The upper row of figures shows the average hourly circadian stimulus (CS) measured at the eye and at three other locations on the body (pin, pendant, wrist). The hourly geometric mean of measured photopic illuminance levels are shown in the lower row of figures. Also plotted in every panel is the difference between light levels measured hourly by the Daysimeter at the plane of the cornea and those measured light at three other locations on the body; statistically significant differences (p<0.05) are indicated with asterisks.
Figure 7 shows the average hourly photopic illuminance levels obtained with the devices located on the wrist; the Daysimeter values are represented by the upper, shaded histogram bars and the Actiwatch Spectrum data are represented by lower histogram bars. The Daysimeter readings were arbitrarily assigned positive values and the Actiwatch Spectrum readings negative values. The solid black line represents the sum of the positive Daysimeter values and the negative Actiwatch Spectrum values. When the solid black line is below zero, the Daysimeter average values were lower than those of the Actiwatch Spectrum for that hour. One-Sample two-tailed T tests were performed on the hourly average differences from 06:00 hr to 23:00 hr.
Figure 7.
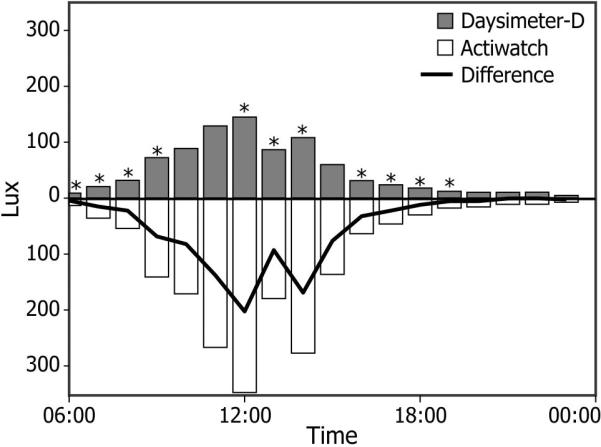
Hourly geometric mean photopic illuminance levels (in lux) as measured by the Daysimeter-D (upper, shaded histogram bars) located on the wrist and by the Actiwatch Spectrum (lower histogram bars), located on the same wrist. The differences in geometric mean illuminance levels at each hourly time interval are also shown; statistically significant differences (p<0.05) are indicated with asterisks.
To compare the actigraphy data from the Daysimeter and the Actiwatch located on the wrist, the Daysimeter data needed to be transformed because the Actiwatch Spectrum records activity level differently than the Daysimeter. In order to account for these measurement differences, a unique threshold value was introduced into each Daysimeter data file. The threshold value was based upon the minimum hourly value recorded from that Daysimeter; this hourly value was subtracted from all other hourly values. These “net” hourly values from each Daysimeter were then averaged together to yield a single average. Similarly, the hourly values from the Actiwatch Spectrum were averaged. Since the activity recording scales were different for the two devices, the threshold-adjusted Daysimeter hourly values were normalized to the hourly values from the Actiwatch Spectrum based upon the ratio of the two averages.
The transformed hourly activity levels obtained from the wrist Daysimeter (upper, shaded histogram bars) and those from the Actiwatch Spectrum (lower histogram bars) are shown in Figure 8. Daysimeter readings were arbitrarily assigned positive values and Actiwatch Spectrum readings negative values. The solid black line represents the sum of the positive Daysimeter values and the negative Actiwatch Spectrum values. When the solid black line is above zero, the Daysimeter average values were higher than those of the Actiwatch Spectrum values for that hour. One-Sample two-tailed T tests were performed on the hourly average differences from 06:00 hr to 23:00 hr.
Figure 8.
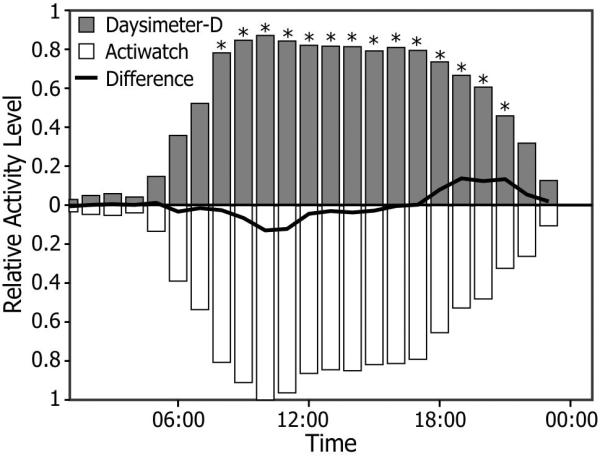
Hourly arithmetic mean activity levels as measured by the Daysimeter-D on the wrist (upper, shaded histogram bars) and by the Actiwatch Spectrum (lower histogram bars), located on the same wrist. The differences in activity levels at each hourly time interval are also shown; statistically significant differences (p<0.05) are indicated with asterisks.
4. Discussion
Reported here are the spectral and spatial performance characteristics of two new versions of the Daysimeter, and of the Actiwatch Spectrum, both devices used in sleep and circadian rhythms field research. Also discussed here are differences associated with measuring light and activity levels at different locations on the body.
Although neither the Daysimeter nor the Actiwatch Spectrum would qualify as laboratory-grade photometers,16 differences between the two devices with regard to light measurements were significant. The f1' error for the Actiwatch Spectrum was 83% (Figure 3), a large value that does not fully represent the types of errors that might occur with practical light sources. Discharge light sources, like fluorescent and high intensity discharge, have emission lines between 570 and 600 nm to which the Actiwatch Spectrum is almost completely insensitive. Consequently, photometric measurements of these common light sources will be systematically biased with the Actiwatch Spectrum. Compared to a commercial grade illuminance meter, significant photometric errors were found for common discharge light sources using the Actiwatch Spectrum (e.g., high pressure sodium in Table 1). The Actiwatch Spectrum also has significant errors in photopic sensitivity at short-wavelength and long-wavelength regions of the spectrum. Its added sensitivity outside the photopic luminous efficiency function would lead to large photometric measurement errors for some sources with significant radiant power in tails of the photopic luminous efficiency function (e.g., daylight in Table 1). In fact, in the field study, the Actiwatch Spectrum measurements obtained from all but two subjects while they were outdoors showed values higher than 150 000 lux, which is, in fact, about 50% higher than is actually available on the surface of the earth at noon under a clear sky.20
The Daysimeter has a smaller f1' value (25%) and has no significant sensitivity outside the visible spectrum (Figure 3). Importantly for photometric measurements in the field, the Daysimeter should yield much smaller errors for commonly experienced light sources. Illuminance measurements performed with the Daysimeter inside a room lighted by various light sources were no more than 7% different than those made using a commercial grade, calibrated illuminance meter (Table 1). Importantly too, the variations in the measured illuminance values among the six Daysimeters were no more than 7%, whereas the variations were as much as 20% for the six Actiwatch Spectrum samples (Table 1). The spatial sensitivity of a photometric device is also important. The Actiwatch Spectrum can result in photometric errors for directional light sources. In particular, its blue channel has an f2 error of 57% and, depending upon its orientation, can be insensitive to incident radiation at angles greater than about 50°. Consequently, short-wavelength light from oblique angles, as might occur with blue light emitting diode devices or windows, might be entirely missed by the Actiwatch Spectrum. It would seem then that a new photosensor array is needed to improve both the spectral and spatial response characteristics of the Actiwatch Spectrum.
The Actiwatch Spectrum does not record, nor does it purport to record, light as it might impact the human circadian system, although the manufacturer could certainly calibrate the devices in those terms. This may or may not be of particular concern for a research hypothesis, but the relationship between measured light as a photometric quantity (i.e., lux) and measured light as a stimulus for either the visual or circadian systems should be understood by the investigator. In the field, the Actiwatch Spectrum values were systematically higher than those generated by the Daysimeter. Thus, when it is used as a device to characterize circadian light exposure, the Actiwatch Spectrum can potentially overestimate the amount of light to which a person is exposed. Again, the manufacturer could make more appropriate calibrations to overcome this problem. The absolute sensitivity of the human circadian system, as measured by acute melatonin suppression, goes from threshold to saturation within about 2 log units,2 whereas that of the human visual system is about 9 or 10 log units. If the Actiwatch Spectrum systematically overestimates light levels, exposure to light below the threshold for circadian system stimulation will be recorded as effective, whereas exposure to light just above that threshold can be recorded as above saturation. Given the highly non-linear response of the human circadian system, care must be taken to estimate circadian-effective light doses.
For sleep and circadian rhythms research then, the absolute, spectral, and spatial calibrations of a light-measurement device can be quite important for drawing valid inferences. For example, the Actiwatch Spectrum has been used to compare the spectral composition of winter and summer evening daylight.7 Based on the “blue” sensor data from the Actiwatch Spectrum, the authors concluded that summer evenings had significantly more short-wavelength content than winter evenings. Although this may be true,21 seasonal differences actually measured may reflect artifacts of the inherent absolute, spectral, and spatial characteristics of the Actiwatch Spectrum and how it was worn on the wrist during the winter (with long-sleeved clothing) and during the summer (without long-sleeved clothing). It would be interesting to repeat the study with the Daysimeter to verify if indeed winter evenings are less rich in short-wavelength corneal irradiance than summer evenings.
Comparisons of CS values measured near the eye with the Daysimeter to those measured at other locations primarily reflect the effects of different measurement locations (Figure 6) because both devices have been calibrated the same way. The differences in CS measured at the eye and measured at the three other locations were surprisingly small, typically less than 10% over the range of hourly average CS values, suggesting that measuring light at locations other than near the eye introduces minimal errors in assessing circadian-effective light exposure. However, when device locations are compared in terms of photopic illuminance levels, the magnitudes of the differences can be quite large. Indeed, placing the Daysimeter on the wrist, rather than close to the cornea, yielded large differences in the absolute levels of photopic illuminance (in lux), especially at high levels when the CS values would already be near saturation. The photopic illuminance measurements taken by the Daysimeter near the eye and those taken by the Daysimeter used as a pin or a pendant were similar (Figure 6). Thus, these data underscore the potential problems in measuring light exposures at the wrist for use as surrogates for corneal light exposures. In winter months when long-sleeved clothing is worn, light measurements on the wrist will undoubtedly be lower than in the summer, when people wear short sleeves, daylengths are longer, and the sun is higher in the sky. The field data reported here were collected between August and January, with the majority of the data collected during warmer temperatures. Even larger differences between photopic illuminance measurements from the Daysimeter at the eye and at the wrist would be expected if they were only obtained during the winter months.
Activity values from the Daysimeter are based upon the RMS activity counts, whereas it is not known how the activity counts by the Actiwatch Spectrum are computed. Therefore the statistically significant differences (Figure 8) simply may be attributed to the differences in the way the devices determined activity.
Finally, more research is being undertaken to understand the relationships between our luminous environments and our health and well-being.12, 22 Devices such as the ones tested here will presumably play an ever-increasing role in fostering our understanding of these relationships. Therefore, it is increasingly important that, first, the operating characteristics of these measurement devices be clearly defined and, second, that the operating characteristics of these measurement devices be related to those of the visual and of the non-visual biological systems that underlie our health and well-being. Without an understanding of the measurement devices we use, it will be very difficult to make significant progress in understanding how our luminous environment affects our health and well-being.
Acknowledgments
This project was funded by the National Institute on Aging (R01AG034157) to the MGF and the National Institute on Drug Abuse (DA023822-01) to MSR. B. Plitnick, B. Wood, D. Guyon, and I. Martinovic are acknowledged for their technical and editorial support.
Footnotes
The authors report no commercial conflicts of interest.
References
- 1.Rea MS, Figueiro MG, Bierman A, Bullough JD. Circadian light. Journal of Circadian Rhythms. 2010;8:2. doi: 10.1186/1740-3391-8-2. [DOI] [PMC free article] [PubMed] [Google Scholar]
- 2.Zeitzer JM, Khalsa SB, Boivin DB, Duffy JF, Shanahan TL, Kronauer RE. Temporal dynamics of late-night photic stimulation of the human circadian timing system. American Journal of Physiology: Regulatory, Integrative and Comparative Physiology. 2005;289(3):R839–R44. doi: 10.1152/ajpregu.00232.2005. [DOI] [PubMed] [Google Scholar]
- 3.Wyszecki G, Stiles WS. Color Science: Concepts and Methods, Quantitative Data and Formulae. 2 ed. John Wiley & Sons; New York, NY: 1982. [Google Scholar]
- 4.Bierman A, Klein TR, Rea MS. The Daysimeter: A device for measuring optical radiation as a stimulus for the human circadian system. Measurement Science and Technology. 2005;16:2292–9. [Google Scholar]
- 5.Philips Actiwatch. 2011 [cited 2012 May 4]; Available from: http://www.healthcare.philips.com/wpd.aspx?p=/us_en/homehealth/sleep/actiw atch/default.wpd&.
- 6.Kripke DF, Hahn EK, Grizas AP, Wadiak KH, Loving RT, Poceta JS, Shadan FF, Cronin JW, Kline LE. Wrist actigraphic scoring for sleep laboratory patients: algorithm development. Journal of Sleep Research. 2010;19(4):612–9. doi: 10.1111/j.1365-2869.2010.00835.x. [DOI] [PubMed] [Google Scholar]
- 7.Thorne HC, Jones KH, Peters SP, Archer SN, Dijk DJ. Daily and seasonal variation in the spectral composition of light exposure in humans. Chronobiology International. 2009;26(5):854–66. doi: 10.1080/07420520903044315. Epub 2009/07/29. [DOI] [PubMed] [Google Scholar]
- 8.Price L, Khazova M, O'Hagan J. Performance assessment of commercial circadian personal exposure devices. Lighting Research and Technology. 2012;44(1):17–26. [Google Scholar]
- 9.Miller D, Figueiro MG, Bierman A, Schernhammer E, Rea MS. Ecological measurements of light exposure, activity and circadian disruption. Lighting Research and Technology. 2010;42:271–84. doi: 10.1177/1477153510367977. [DOI] [PMC free article] [PubMed] [Google Scholar]
- 10.Rea MS, Bierman A, Figueiro MG, Bullough JD. A new approach to understanding the impact of circadian disruption on human health. Journal of Circadian Rhythms. 2008;6:7. doi: 10.1186/1740-3391-6-7. [DOI] [PMC free article] [PubMed] [Google Scholar]
- 11.Figueiro MG, Rea MS. Lack of short-wavelength light during the school day delays dim light melatonin onset (DLMO) in middle school students. NeuroEndocrinology Letters. 2010;31(1):4. [PMC free article] [PubMed] [Google Scholar]
- 12.Rea MS, Brons JA, Figueiro MG. Measurements of light at night (LAN) for a sample of female school teachers. Chronobiology International. 2011;28(8):673–80. doi: 10.3109/07420528.2011.602198. [DOI] [PMC free article] [PubMed] [Google Scholar]
- 13.Sharkey KM, Carskadon MC, Figueiro MG, Zhu Y, Rea MS. Effects of an advanced sleep schedule and morning short-wavelength light exposure on circadian phase in young adults with late sleep schedules. Sleep Medicine. 2011;12(7):685–92. doi: 10.1016/j.sleep.2011.01.016. [DOI] [PMC free article] [PubMed] [Google Scholar]
- 14.Czeisler CA, Wright JKP. Influence of light on circadian rhythmicity in humans. In: Turek FW, Zee PC, editors. Regulation of sleep and circadian rhythms. Marcel Dekker; NY: 1999. pp. 149–80. [Google Scholar]
- 15.Van Derlofske J, Bierman A, Rea MS, Ramanath J, Bullough JD. Design and optimization of a retinal flux density meter. Measurement Science and Technology. 2002;13(6):821–8. [Google Scholar]
- 16.Deutsches Institut für Normung . Photometry; classification of illuminance meters and luminance meters. Deutsches Institut für Normung; Germany: NA 058-00-03 AA - Photometrie; 1985 DIN 5032-7. [Google Scholar]
- 17.Folstein MF, Folstein SE, McHugh PR. Mini-mental state: A practical method for grading the cognitive state of patients for the clinician. Journal of Psychiatric Research. 1975;12(3):189–98. doi: 10.1016/0022-3956(75)90026-6. [DOI] [PubMed] [Google Scholar]
- 18.Morris JN, Fries BE, Morris SA. Scaling ADLs Within the MDS. The Journals of Gerontology Series A: Biological Sciences and Medical Sciences. 1999;54(11):M546–M53. doi: 10.1093/gerona/54.11.m546. [DOI] [PubMed] [Google Scholar]
- 19.Rea MS, Figueiro MG, Bullough JD, Bierman A. A model of phototransduction by the human circadian system. Brain Research Reviews. 2005;50(2):213–28. doi: 10.1016/j.brainresrev.2005.07.002. [DOI] [PubMed] [Google Scholar]
- 20.IESNA Lighting Handbook . In: Reference and Application. 9th ed. Rea MS, editor. Illuminating Engineering Society of North America; New York, NY: 2000. [Google Scholar]
- 21.Figueiro MG, Rea MS. Evening daylight may cause adolescents to sleep less in spring than in winter. Chronobiology International. 2010;27(6):1242–58. doi: 10.3109/07420528.2010.487965. [DOI] [PMC free article] [PubMed] [Google Scholar]
- 22.Kloog I, Portnov BA, Rennert HS, Haim A. Does the modern urbanized sleeping habitat pose a breast cancer risk? Chronobiology International. 2011;28:76–80. doi: 10.3109/07420528.2010.531490. [DOI] [PubMed] [Google Scholar]