Abstract
The study of protein kinetics requires an accurate measurement of isotopic ratios of peptides. Although Fourier transform-ion cyclotron resonance mass spectrometers (FT-ICR MS) yield accurate mass measurements of analytes, the isotopoloque ratios are consistently lower than predicted. Recently, we demonstrated that the magnitude of the spectral error in the FT-ICR MS is proportional to the scan duration of ions. Here we present a novel isotopic ratio extrapolation (IRE) method for obtaining accurate isotopic ratio measurements. Accuracy is achieved by performing scans with different duration and extrapolation of the data to the initial moment of the ion rotation; IRE minimizes the absolute isotopic ratio error to ≤1%. We demonstrate the application of IRE in protein turnover studies using 2H2O-metabolic labeling. Overall, this technique allows accurate measurements of the isotopic ratios of proteolytic peptides, a critical step for enabling routine studies of proteome dynamics.
Introduction
Proteome dynamic studies involve the administration of a stable isotope labeled precursor and the subsequent measurement of isotope incorporation into a protein of interest by mass spectrometry (MS) [1]. Since the mass isotopoloque distribution (MID) profile of a proteolytic peptide reflects the relative isotope abundance, the temporal change of the MID profile represents the synthesis rate of the protein of origin. Studies of protein dynamics require accurate and precise measurements of isotopic ratios, which may be achieved using high resolution Fourier transform-ion cyclotron resonance MS (FT-ICR MS). Detection of different isotopoloques in FT-ICR is achieved via the separation of ions with a specific mass-to-charge ratio rotating at a characteristic cyclotron resonance frequency [2] (longer ion rotations result in higher isotopologue resolutions). However, the MID measurements in these instruments are consistently lower than the predicted values [1], [3, 4]; spectral accuracy of the isotopic ratios depends on several factors including the ions' population size, shearing forces, digital resolution, the bias of closely spaced cyclotron frequencies and geometry of the ICR cell [5-8]. These factors lead to a dissipation of the ion signal with the inhibitions of the individual damping rate of each isotopoloque [3, 5, 6] which results in inaccurate measurements of isotope ratios and suggests that spectral error is proportional to the time of an ions' rotation.
Previous reports demonstrated that the logarithm of the measured isotopic ratio linearly decreased with the acquisition time and that this phenomenon could be used to improve the accuracy of the isotopic distribution for noble gases [3, 5]. Here we expand on those findings and report an approach for improving measurements of peptide MIDs. We hypothesized that by analyzing a sample at several resolutions in a single run, it would be possible to infer the initial moment of ion rotation by linear isotope ratio extrapolation (IRE). The utility of the IRE method was tested by quantifying the fractional synthesis rate of albumin in rats given 2H2O.
Experimental
The peptides YLYEIAR and [2-2H]alanyl-YLYEIAR were synthesized as described [1]. All other chemicals and peptides were from Sigma-Aldrich (St. Louis, MO).
Details of animal experiments including albumin isolation and digestion were previously described [1]. High resolution mass spectra were collected using a LTQ FT Ultra MC (Thermo Electron, Bremen, Germany), peptides were infused directly or using UltiMate 3000 nano-HPLC system (Dionex, Germering, Germany) [1]. The MID measurements were performed in the SIM mode with mass isolation window of 10 Da in the ICR cell at a target value of 5×10⁴, which allows statistical accuracy of the ion intensity [9], (Supplementary Table 1S).
Experiments were carried out at resolutions of 12,500, 25,000, 50,000 and 100,000, Gaussian peak shape fitting was used for all data analyses (Supplementary Fig.1s, Table 2s). The isotopic ratio was calculated in each scan as the ratio of the appropriate mass isotopoloque peak apexes, the data collected at each resolution were then averaged over the chromatographic peak. The predicted asymptotic isotopic ratios of unlabeled and [2H]-enriched peptides were calculated using software that we developed [1].
To obtain accurate values for isotopic ratios, the linear regression analysis of experimental isotopic ratios at different resolutions was performed. The extrapolation of the isotopic ratios to the initial time-domain (zero) allows the calculation of the corrected isotopic ratio. The fractional synthesis rate (FSR) of albumin was calculated based on the corrected values at each time point [1].
Results and Discussion
Studies of protein dynamics require measurements of temporal labeling patterns of a protein of interest which can be determined via MID analysis using high resolution MS. Here we present a simple method for obtaining accurate isotope ratio measurements. Our approach is based on a consideration of the theory that when the ion current dissipation is sufficiently small, the isotope intensity ratio (I1/I0) after Fourier transformation is represented as:
| (Eq 1) |
where N1 and N0 are the ions number, T is acquisition time, τ0 and τ1 are the decay signal of rates of M0 and M1 isotopologues [3], [5], [10]. This expression shows that the isotopic ratio damps linearly with the character period of τ:
| (Eq 2) |
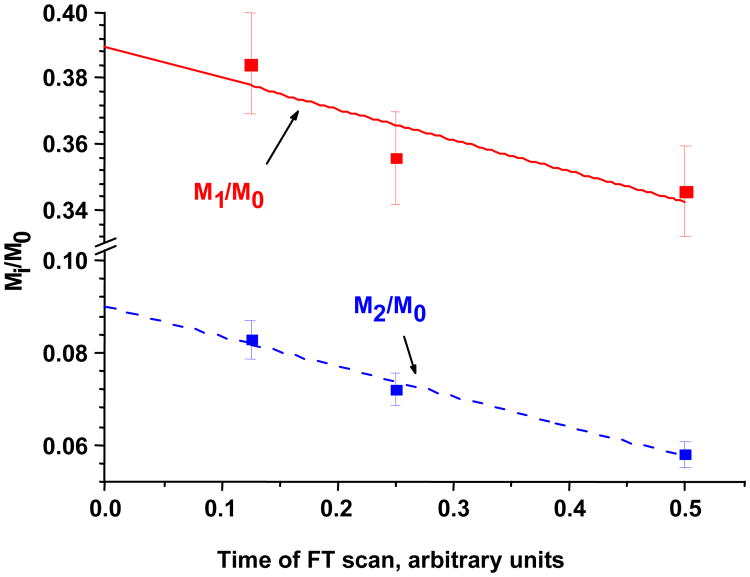
In accordance with Eq 1 our initial analyses of pure peptides revealed that increasing the resolution setting reduces the accuracy of isotopic ratio measurements. In order to improve the isotopic ratio accuracy, MS analyses were performed at different resolutions in the same run. The regression analysis of isotopic ratios as a function of ion rotation time yields a line which is extrapolated to the initial ion rotation time (t=0). The intercept of this extrapolated line in isotopic ratio axis represents the isotopic ratio at the hypothetical zero time ion rotation (Fig.1).
Fig.1.
Measured and extrapolated isotopic ratios (natural abundance) of the peptide AWAVAR. Data were collected at 3 different acquisition times with multiple injections (n=4). The Mi/M0 intercepts represent the extrapolated isotopic ratios. Error bars represent standard deviation from the mean value.
To facilitate the application of our approach, we developed a software program that quantifies the intensities of all isotopoloques at each scan and averages the isotopic ratios over the full scans; our program performs this operation at each resolution and generates isotopic ratios at each setting. The isotopic ratio calculated by our software at any single resolution is comparable with the results using XCalibur software.
Validation of MID at a low gas pressure
In this study the ion detection was performed in the ICR cell at a typical low gas pressure (∼10−10 Torr) where both ion-neutral and ion-ion interactions occur [11]. However, if the cumulative signal dissipation is small for each isotopoloque, the isotopic ratios could be expressed using Eq 1 (low rate damping mechanism). To validate the IRE method, we performed isotopic measurements of unique peptides at different charge state in the direct infusion or LC mode. The regression analysis of isotopic ratios as a function of ion rotation time yields a reasonable linear regression (r2 >0.97, Fig.1). For ions with low charges (z=1-3) the extrapolated data are in good agreement with the theoretical values with the absolute error of ∼ 0.5%, while data obtained at 12,500 are usually of ∼ 1 to 5% below the theoretically predicted (Supplementary Table 3S).
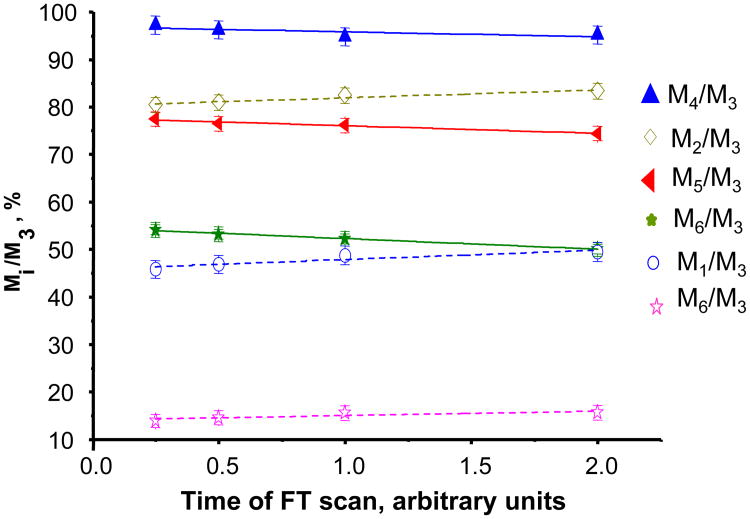
The regression analysis of measured isotopic ratios of multiple charged human insulin (z=6) led to a spectral error of 1-2% (Fig. 2), while measurements at fixed resolution of 100,000 gave an error of 3-4%. Interestingly, the negative slopes are observed for heavier mass isotopoloques (M4, M5 and M6), while lighter mass isotopoloques (i.e. M0, M1 and M2) have positive slopes. This suggests the lower damping of lighter masses and higher dissipation of heavier masses, despite the fact that both masses are less populated than M3. It is possible that the additional mutual Coulomb interaction of the ion clouds of different masses results in different damping rates [11, 12].
Fig.2.
Isotopologue ratio analysis of commercial human insulin of 6+ charge state. Data were collected at 4 different acquisition times and normalized to the most abundant signal (M3).
Isotopic ratio analysis of a synthetic [2H]-enriched peptide
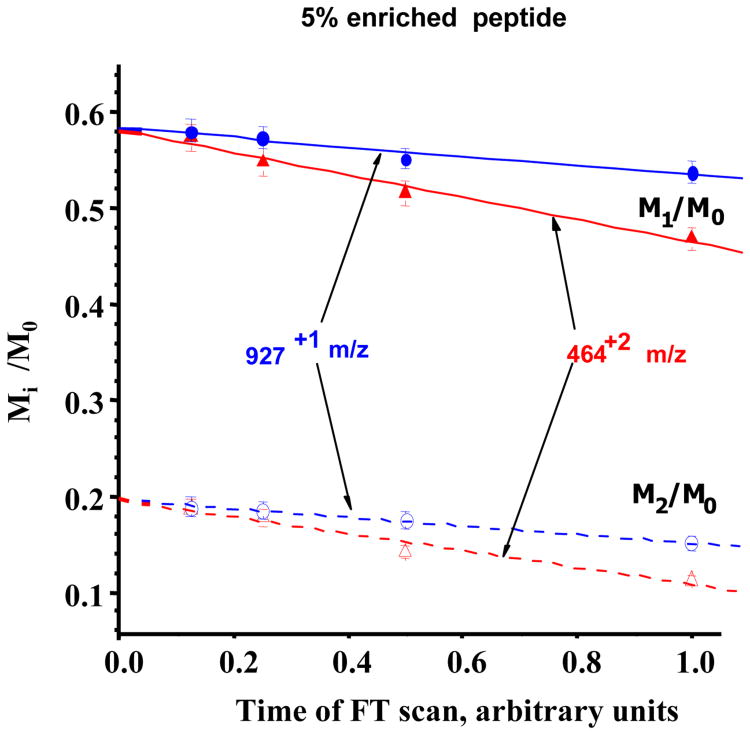
The main purpose of this study is to measure MIDs of [2H]-enriched proteolytic peptides. For this purpose we used the synthetic YLYEIAR peptide mixed with known amounts of synthetic [2-2H]alanyl-YLYEIAR. Fig.3 demonstrates the regression analyses of singly and doubly charged M1/M0 and M2/M0 isotope ratios at different resolutions, the isotopic ratios are a linear function of the resolution and the extrapolated data coincide with the predicted values. The IRE method reduces the error ∼2-5 times compared to measurements at the resolution of 25,000 (Supplements Table 4S).
Fig.3.
Measured isotope ratios of YLYEIAR peptide with 5% [2H]-enrichment. Data were collected at 4 different acquisition times with multiple injections (n=5).
Fig.3 also shows that the linear slopes of doubly charged ions are higher than those of singly charged ones, reflecting the effect of the ion charge state on the isotopoloque damping. These suggest that the population stability of an ion also depends on the charge-charge interactions inside the ion cloud rather than ion-neutral interaction.
Recently it has been demonstrated that the ion motion damping could be also reduced by the technical improvement of the ion trapping pre-excitation conditions [7, 8]. Presumably, this technical development in combination with our method could further increase the isotopic accuracy.
Biological Application
We recently developed the 2H2O-metabolic labeling technique coupled with classical proteomics for measuring protein synthesis in free living animals [1, 13]. Oral administration of 2H2O (a safe, non-radioactive tracer) results in a rapid steady state labeling of body water and free amino acids, the rate of incorporation of [2H]-labeled amino acids into proteins yields the respective rate of protein synthesis. Here we demonstrate an improved measurement of the FSR of albumin using the IRE approach.
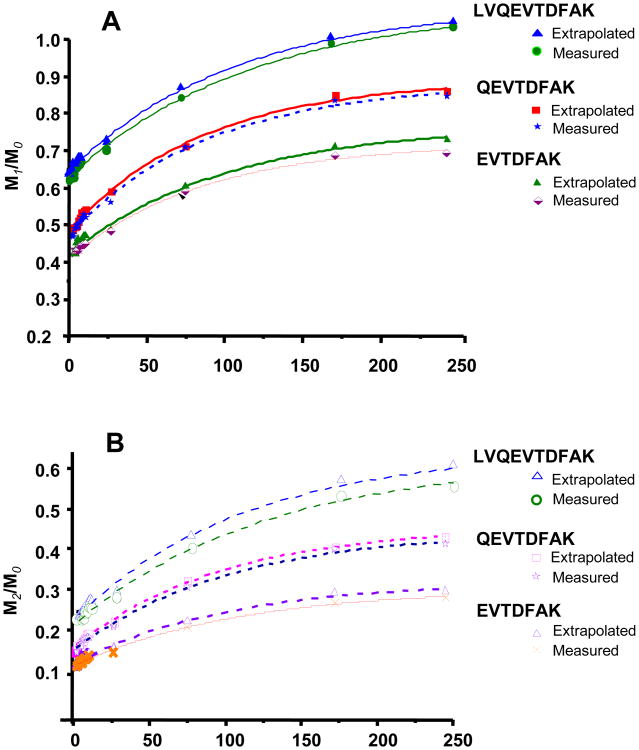
Figure 4 represents the [2H]-labeling of rat albumin during 10 days of steady-state body water labeling at ∼2.7% 2H [1]. The FSR of albumin was calculated using the time-course profile of the extrapolated and measured isotopic ratios (data acquired at 25,000 resolution) of the tryptic albumin peptide LVQEVTDFAK and its fragments QEVTDFAK and EVTDFAK. Comparison of the rate constants that are calculated using three isotopoloques (M0, M1 and M2) reveals that the M1/M0 ratio yields a value (0.01 per hour) that is ∼ 11% higher than that of M2/M0 ratio (0.008 per hour). This could be related to both lower ion population size and [2H]-enrichment of M2 isotopoloque leading to inaccurate M2/M0 isotope ratio measurement. In comparison, the IRE method results in similar rate constants regardless of whether one uses the M1/M0 ratio or the M2/M0 ratio, the values are each ∼ 10% greater than the rate constant that was calculated using the M1/M0 ratio at 25,000 resolution. Thus a single resolution measurement of isotopic ratios results in a higher variation compared to extrapolated values. More reliable estimates of the isotopic ratio are critical when one aims to quantify subtle changes in the synthesis of a protein following an intervention/perturbation.
Fig.4.
Time course labeling of rat albumin peptide and its fragments. Panel A demonstrates the M1/M0 ratios for the precursor ion LVQEVTDFAK and product ions QEVTDFAK and EVTDFAK ions; comparable estimates of newly made protein were obtained using raw spectra measured at 25,000 resolution (i.e. 9±1, 11±1 and 10±1%, respectively) and extrapolated data (10±1, 12±1 and 11±1%, respectively). Panel B demonstrates the M2/M0 ratios for the precursor ion LVQEVTDFAK and product ions QEVTDFAK and EVTDFAK ions; comparable estimates of newly made protein were obtained using raw spectra measured at 25,000 resolution (i.e. 8±1, 10±1 and 9±1%, respectively) and extrapolated data (9±1, 11±1 and 10±2%, respectively).
Conclusion
The IRE method developed herein allows an accurate measurement of isotopic ratios for peptides and should be suitable for other analytes. The ability to improve the accuracy of the isotope labeling ratios has an immediate impact on the application of high resolution mass spectrometry in studies which aim to use isotope tracers in order to interrogate protein turnover. Since 2H2O-metabolic labeling results in 2H incorporation into all proteolytic-peptides, we suspect that this method can be applied to studies of global proteome dynamics. Presumably, our algorithm could be incorporated into the commercially available data analysis software and therein allow relatively easy and wide-spread use of the IRE method for quantitative proteomic analyses.
Supplementary Material
Acknowledgments
Supported by NIH (5R21RR025346-02) and the Cleveland Clinic Foundation.
Abbreviations
- HPLC
high performance liquid chromatography
- FT-ICR MS
Fourier transform-ion cyclotron resonance mass spectrometry
- MID
mass isotopoloque distribution
- SIM
selected ion monitoring
- CID
collision induced dissociation
- IRE
isotopic ratio extrapolation
- FSR
fractional synthesis rate
References
- 1.Kasumov T, Ilchenko S, Li L, Rachdaoui N, Sadygov RG, Willard B, et al. Measuring protein synthesis using metabolic 2H labeling, high-resolution mass spectrometry, and an algorithm. Anal Biochem. 2011;412:47–55. doi: 10.1016/j.ab.2011.01.021. [DOI] [PMC free article] [PubMed] [Google Scholar]
- 2.Marshall AG, Hendrickson CL, Jackson GS. Fourier transform ion cyclotron resonance mass spectrometry: A primer. Mass Spectrom Rev. 1998;17:1–35. doi: 10.1002/(SICI)1098-2787(1998)17:1<1::AID-MAS1>3.0.CO;2-K. [DOI] [PubMed] [Google Scholar]
- 3.Mitchell DW, DeLong S. Initial Relative Ion Abundances and Relaxation Times from Apodized, Segmented FTICR Time Domain Signals. Int J Mass Spectrom Ion Processes. 1990;96:1–16. [Google Scholar]
- 4.Erve JC, Gu M, Wang Y, DeMaio W, Talaat RE. Spectral accuracy of molecular ions in an LTQ/Orbitrap mass spectrometer and implications for elemental composition determination. J Am Soc Mass Spectrom. 2009;20:2058–2069. doi: 10.1016/j.jasms.2009.07.014. [DOI] [PubMed] [Google Scholar]
- 5.Koning L, Kort C, Pinkse F, Nibberring N. Segmented Fourier Transform and its Application to FT-ICR MC: Ion Abundances and Mass Measurements. Int J Mass Spectrom Ion Processes. 1989;95:71–92. [Google Scholar]
- 6.Bresson JAAG, Bruce JE, Smith RD. Improved Isotopic Abundance Measurments for High Resolution FT-ICR Mass Spectra via Time-Domain Data Extraction. J Am Soc Mass Spectrom. 1998;9:799–804. [Google Scholar]
- 7.Tolmachev AV, Robinson EW, Wu S, Kang H, Lourette NM, Pasa-Tolic L, et al. Trapped-Ion Cell with Improved DC Potential Harmonicity for FT-ICR MS. J Am Soc Mass Spectrom. 2008;19:586–597. doi: 10.1016/j.jasms.2008.01.006. [DOI] [PMC free article] [PubMed] [Google Scholar]
- 8.Boldin IA, Nikolaev E. Fourier transform ion cyclotron resonance cell with dynamic harmonization of the electric field in the whole volume by shaping of the excitation and detection electrode assembly. Rapid Commun Mass Spectrom. 2011;25:122–126. doi: 10.1002/rcm.4838. [DOI] [PubMed] [Google Scholar]
- 9.Kaur P, O'Connor PB. Quantitative determination of isotope ratios from experimental isotopic distributions. Anal Chem. 2007;79:1198–1204. doi: 10.1021/ac061535z. [DOI] [PMC free article] [PubMed] [Google Scholar]
- 10.Marshall A, Comisarow M, Parisod G. Relaxation and spectral line shape in Fourier transform ion resonance spectroscopy. J Chem Phys. 1979;71:4434–4444. [Google Scholar]
- 11.Mitchell DW, Smith RD. Cyclotron motion of two Coulombically interacting ion clouds with implications to FT-ICR MC. Phys Review E. 1995;52:4366–4386. doi: 10.1103/physreve.52.4366. [DOI] [PubMed] [Google Scholar]
- 12.Tolmachev AV, Robinson EW, Wu S, Pasa-Tolic L, Smith RD. FT-ICR MS Optimisation for the Analysis of Intact Proteins. Int J Mass Spectrom. 2009;287:32–38. doi: 10.1016/j.ijms.2008.10.010. [DOI] [PMC free article] [PubMed] [Google Scholar]
- 13.Rachdaoui N, Austin L, Kramer E, Previs MJ, Anderson VE, Kasumov T, et al. Measuring proteome dynamics in vivo: as easy as adding water? Mol Cell Proteomics. 2009;8:2653–2663. doi: 10.1074/mcp.M900026-MCP200. [DOI] [PMC free article] [PubMed] [Google Scholar]
Associated Data
This section collects any data citations, data availability statements, or supplementary materials included in this article.


