Abstract
Using fingerprints as a method to identify an individual has been accepted in forensics since the nineteenth century, and the fingerprint has become one of the most widely used biometric characteristics. Most of the modern fingerprint recognition systems are based on the print pattern of the finger surface and are not robust against spoof attaching. We demonstrate a novel vital vascular fingerprint system using Doppler optical coherence tomography that provides highly sensitive and reliable personal identification. Because the system is based on blood flow, which only exists in a livng person, the technique is robust against spoof attaching.
1. Introduction
Using fingerprints as a method to identify an individual has been accepted in forensics since the nineteenth century [1], and the fingerprint has become one of the most widely used biometric characteristics. The fingerprint database is well established. Most of the modern fingerprint recognition systems are based on the print pattern of the finger surface and are not robust against spoof attaching. There may be problems when there are scars or cuts on fingertips.
Optical coherence tomography (OCT) is a noncontact imaging technique which can capture high resolution, 3D images from within highly scattering biological tissues [2]. There has been great interest to use OCT for fingerprint recognition and structures below the finger surface can be imaged with OCT [3, 4]. The human skin layer includes epidermis, dermis, and hypodermis. The epidermis is the outermost layer of skin. The epidermis layer is free from any blood vessel. The layer beneath the epidermis is the dermis which contains two layers: papillary and reticular. At the papillary layer which is located at the junction between epidermis and dermis, the structure feature follows the same pattern as the external fingertip. This layer forms an internal fingerprint and has been demonstrated by OCT [4]. In addition, there has been demonstration of imaging the sweat glands of fingertip to provide fingertip internal features [3]. Although these demonstrations have enhanced the performance of high security biometric recognition, they are not able to provide the liveness information. The dermis contains capillary blood vessels and at the papillary layer, the capillary blood vessels (papillary loops) extend into the papillary ridge. The capillary blood vessel network is another kind of representation of the external fingerprint pattern [5].
Recently, we proposed a method for high resolution imaging of the microcirculation of the skin based on the flow of blood [6, 7]. In addition to the 3D structure information, we were able to obtain the 3D vasculature information based on a numerical algorithm. Blood vessels down to the capillary level in the skin were able to be captured with this method. The blood flow only exists in a live person so that imaging the blood vessels based on blood flow provides a way for liveness test. The capillary vessels (or capillary loops) that exist in the papillary dermis of the fingertip follow the same pattern as the fingerprint [5]. These blood vessels form another representation of the external fingerprint pattern [8]. This feature provides a way to capture the “live” finger print: only the fingerprint from a live person will be captured and the fingerprint is, actually, obtained from the capillary vasculature network in the papillary dermis.
2. System and Method
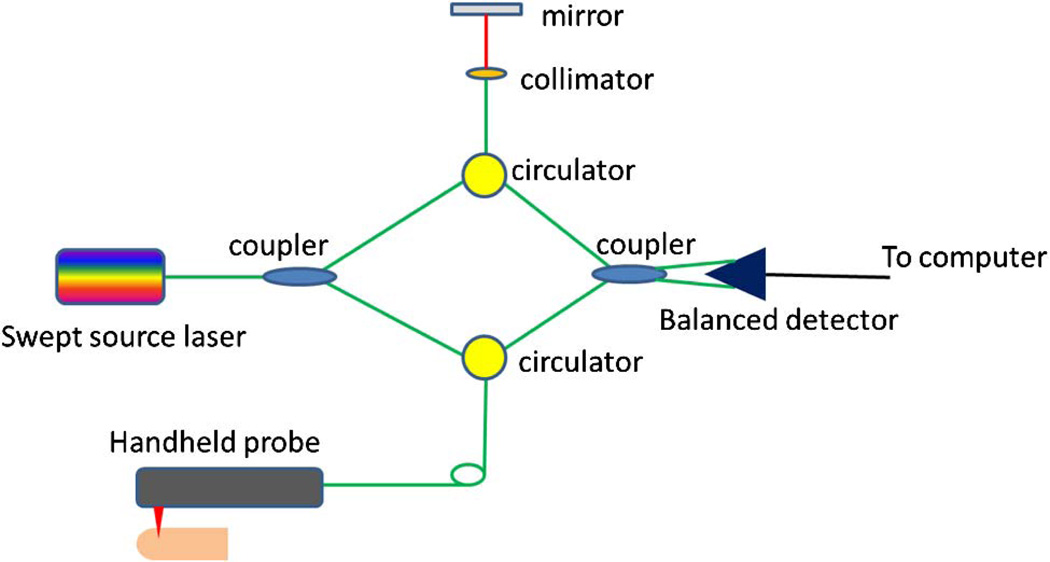
For live vascular fingerprint imaging, either time domain OCT or Fourier domain OCT can be used. Here, we will demonstrate the capture of live vascular fingerprints with a swept source OCT system. The schematic of the system setup is shown in Fig. 1. The system used a MEMS-based swept source laser with a central wavelength of 1310 nm, an A-line speed of 50 kHz, and a total average power of 16 mW (SSOCT-1310, Axsun Technologies Inc., Billerica, Massachusetts). A Mach–Zehnder type interferometer was used and 90% of the laser light power was sent to the sample arm and 10% of the light in the reference arm. A dual-balanced detection scheme was used to acquire the signal. The system utilized K-trigger mode so that no re-calibration was needed. In the sample arm, a fiber collimator, a two-axial galvo mirror scanning system, and an achromatic doublet was used. The collimator, galvo mirror scanner, and the achromatic doublet were packaged in a handheld probe. The fiber collimator gave a beam diameter of 2 mm and with the 30 mm focusing length doublet, the system gave a lateral resolution of 14.6 µm. The bandwidth of the laser source was around 80 nm and the axial resolution of the system was 9.3 µm in air (6.6 µm in tissue). C++ platform based data acquisition software running on a 64 bit Windows 7 operation systems was used to control the galvo scanner and acquire the data.
Fig. 1.
Schematic of the swept source OCT system.
The inter-frame intensity-based Doppler variance (IBDV) method that is derived from the phase-resolved Doppler variance based on the autocorrelation algorithm was used to process the data and obtain the blood vessel network [7]. Briefly, the amplitude autocorrelation between adjacent frames was used to obtain the variance value
| (1) |
where Pi,j,z is the amplitude (absolute value) for a pixel at a depth of z for the ith A-line in the jth frame. J is the number of averaged frames and N is the number of averaged depth pixels. In this experiment, the values for J and N were both set at 4 to balance between the signal-to-noise ratio, resolution, and computation time. The data processing included background fringe subtraction, spectrum shaping with a Gaussian function, and fast Fourier transform (FFT). The amplitude values of the final-depth-encoded signals were used to calculate both the OCT images and IBDV images. And a threshold that is 1 dB above the OCT intensity noise floor was used to eliminate the low scattering but high noise region in the IBDV images. The velocity sensitivity of this method can be increased by increasing the time interval and the IBDV method is sensitive enough for the imaging of Brownian motion [7]. The IBDV method is able to image the vessels in situations where the blood flow speed drops, such as temperature change or temporary blood occlusion.
In this experiment, the imaging area on the fingertip was around 5 mm by 5 mm. The three-dimensional data volume contained a total of 2000 frames with 512 A-lines per frame. The total imaging time was around 20 s. A custom C++ based software was used to process the acquired dataset and save the OCT structure and IBDV images. Those OCT structure and IBDV images were loaded into ImageJ (http://imagej.nih.gov/ij/) for further processing. The images were further smoothed with a Gaussian filter, which are built-in functions of ImageJ. The maximum intensity projection (MIP) en-face images for the vasculature or the structure were produced with ImageJ. The structure images were further loaded into Amira for three-dimensional rendering.
3. Results
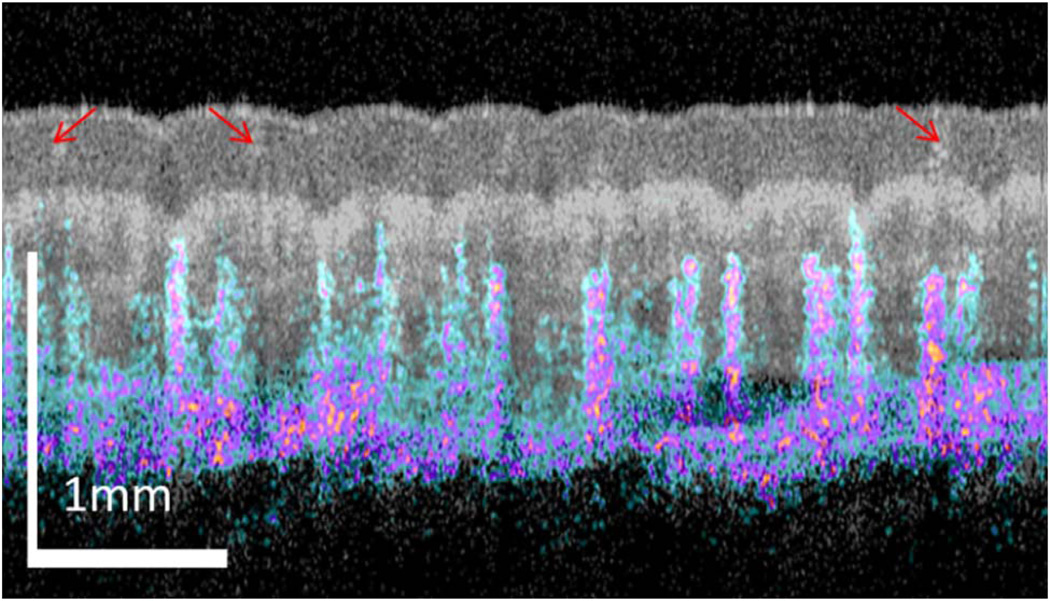
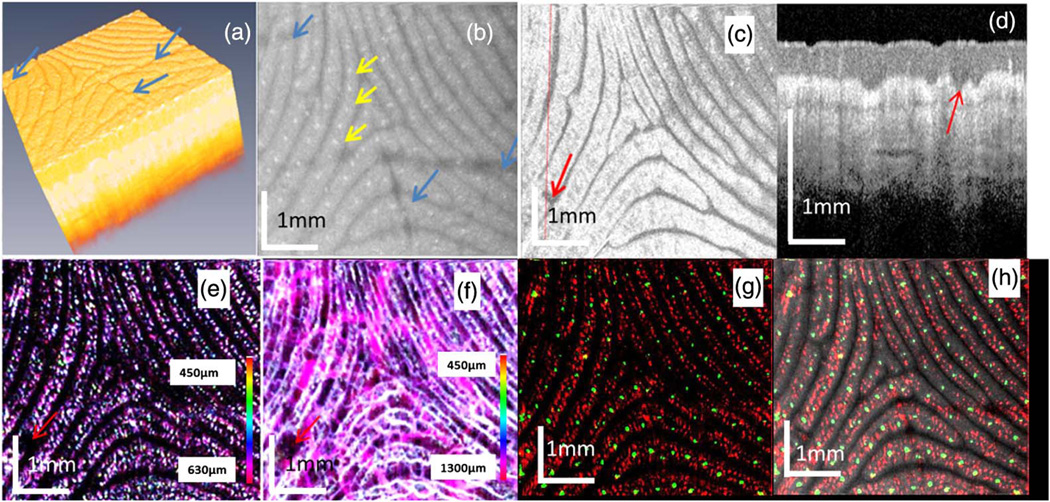
Figure 2 shows the overlayed image of OCT structural (shown in gray) and IBDV vasculature (shown in color) image from the thumb fingertip of a volunteer. The structure image clearly shows the tissue layer boundaries and sweat pores (indicated by red arrows). The blood vessels are located several hundred microns beneath the skin surface. So the vasculature patterns are not easily affected by fingertip dirt, superficial injury or scratches, which may affect the fingerprint pattern. Figure 3 shows the images of a fingertip with wrinkles or scratches on the fingertip surface. Figure 3(a) shows the 3D rendering of the OCT structure images. The blue arrows indicate three wrinkles or scratches. Figure 3(b) is the MIP image for the epidermis layers. The yellow arrows point out three sweat pores. The blue arrows indicate three wrinkles or scratches. Figure 3(c) is the en-face OCT image beneath the tissue surface and at a depth corresponding to the dermal papilla region. In this image, the three wrinkles or scratches do not show up and this means the wrinkle or scratches are only in the superficial layer. However, a very special region indicated by the red arrow is found on the en-face image. The OCT image [Fig. 3(d)] along the red dotted line in Fig. 3(c) shows that there is a lesion in the dermal papilla. However, this lesion is not reflected on the finger surface. Figure 3(e) shows the MIP vascular pattern around the dermal papilla region. This vascular pattern matches well with the en-face view OCT image in Fig. 3(c). Note that the lesion region which is absent of any blood vessel is clearly seen in the vascular pattern. The MIP vascular pattern for the whole depth (around 1.3 mm depth) is shown in Fig. 3(f). The lesion region is absent of blood vessels until a depth around 1.0 mm. This shows that the technique can also be used to evaluate the effect of a lesion or a cut on the fingerprint pattern. Since both the fingertip sweat pores and vasculature follow the same pattern as fingerprint, they may be combined for high security biometric recognition. Figure 3(g) shows the overlayed en-face images of sweat pores and capillary loop vasculature. The green color dots in Fig. 3(g) are sweat pores and red color dots in it are the capillary loops. Figure 3(h) shows the overlayed en-face images of sweat pores (green), capillary loop vasculature (red), and the structure (gray). The vasculature fingerprint matches the structure fingerprint very well.
Fig. 2.
Overlay of OCT structure (gray) and IBDV (color) images.
Fig. 3.
OCT images from a fingertip. (a) The 3D rendering of the OCT structure images. (b) The maximum intensity projection (MIP) image for the epidermis layers. (c) The en-face OCT image beneath the tissue surface and at a depth in the dermal papilla region. (d) An OCT image along the red dotted line in (c). (e) The MIP vascular pattern around the dermal papilla region. (f) The MIP vascular pattern for the whole depth. (g) Overlayed en-face images of sweat pores and capillary loop vasculature (450–630 µm). (h) Overlayed en-face images of sweat pores, capillary loop vasculature, and structure.
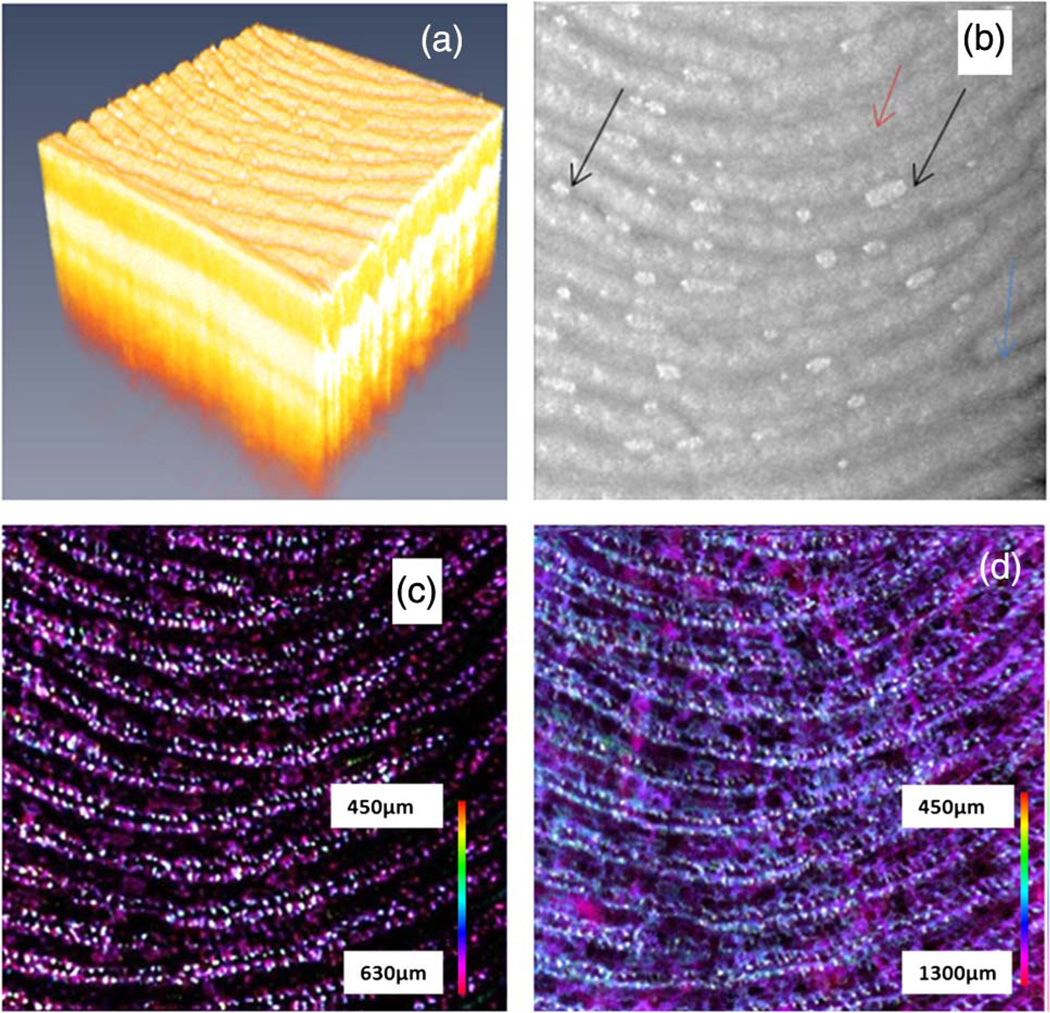
Figure 4 shows the images of another fingertip. Figure 4(a) shows the 3D rendering of the fingertip region of the OCT structure images. Figure 4(b) shows the MIP structure image for the epidermis layer. The sweat gland pores can be seen in the image but the water drops (as indicated by the black arrows) in the finger furrows degrade the fingerprint pattern and cause a misleading result. As demonstrated by several groups, OCT provides the capability to image beneath the finger surface and the en-face view image around the dermal papilla region will provide an artifact-free fingerprint. Figure 4(c) shows the blood vessel network around the dermal papilla region. In this region, the blood vessels are not connected horizontally. Following the pathological information of the skin on the human finger, we understood that the white dots were capillary loops. Generally, a single capillary loop extends into one dermal papilla [9]. Just as the dermal papilla pattern follows the fingerprint pattern, the capillary loops also follow the fingerprint pattern. By comparing Fig. 4(b) with Fig. 4(c)it can be found that there are two rows of capillary loops below each finger ridge, and these two rows of capillary loops follow the same pattern as the finger ridge which forms the fingerprint. This feature has been shown with an ex vivo method using a scanning electron microscopy (SEM) [5]. The microvascular pattern has been called “vascular fingerprint” [8]. The findings from current in vivo results agree well with the SEM results obtained with the corrosion cast technique for ex vivo cases [5]. With the OCT techniques, the imaging depth can reach 1 to 2 mm and blood vessels in part of the reticular dermis region can also be imaged. Figure 4(d) shows the microvascular pattern for the depth until 1.3 mm. In addition to the capillary vessels which follow the fingerprint pattern, larger blood vessels beneath these capillary vessels can also be seen. Vascular pattern is unique to each individual and there have been techniques to use the vascular pattern on a finger or hand for biometric applications [10]. Different from the finger or hand vein recognition technique, which originate its contrast from the absorption of hemoglobin or melanin and captures large vein vessels to provide two-dimensional vein patterns, the vascular pattern obtained here is three-dimensional and the capillary blood vessels at the superficial layer of tissue are imaged. The physical principle of the current method is based on the flow of blood. Therefore, the microvascular pattern shown here is a three-dimensional live pattern. Blood vessels without blood flow will not be captured by this method [7].
Fig. 4.
OCT images from another fingertip. (a) The 3D rendering of the OCT structure images. (b) The MIP image for the epidermis layer. (c) The MIP vascular pattern around the dermal papilla region. (d) The MIP vascular pattern for the whole depth.
4. Discussion
The applications of blood vessel information are several-fold. First, the detection of blood vessels is based on the blood flow, so liveness information of the sample can be obtained accordingly. The blood vessel network may not be necessary and a small imaging area or even a single tomography image is enough for liveness detection. Second, the capillary vessel (or capillary loop) network existing in the papillary dermis of the fingertip provides a live fingerprint pattern, which is impossible to duplicate or fake. This “live” fingerprint pattern may use the established fingerprint database for verification or recognition purposes. Third, the three-dimensional blood vessel network itself is unique for each individual and can serve as a way for authentication applications. Fourth, the current system can image both the structure and vasculature of the fingertip and identification can be performed from both the information.
With the current system, it will take 20 s to acquire the whole 3D data. In the future, a faster system with more than 200 kHz A-line rate will reduce the imaging time to less than 5 s, which is sufficient for fingerprint applications. With a faster system, the motion artifacts will be also reduced. A contact mode OCT imaging probe may be used to further reduce the motion artifacts. Specular reflection from the finger-air interface may be reduced with contact mode OCT probe and water or ultrasound gel as index matching media. The field of view of the system is dependent on the focusing objective and out current system uses an objective with focusing length of 30 mm. With this objective, a field of view of more than 10 mm by 10 mm can be achieved. However, with a larger field of view, the imaging time will be increased.
5. Conclusions
In summary, with OCT, we demonstrated in vivo imaging of three-dimensional microcirculation or vascular pattern in the superficial layer (1.3 mm) of human fingertip skin. At the dermal papilla region, the vascular pattern follows the same pattern of the fingerprint and this vascular pattern forms a live vascular fingerprint. This live vascular fingerprint provides an ultrahigh security, unique way for fingerprint-based personal verification.
Acknowledgments
The authors thank Elaine Kato for proofreading this paper. A provisional patent based on this work has been filed in February 2012. The work is supported by National Institutes of Health (R01EB-10090, R01EY-021519, R01HL-105215, R01HL-103764, and P41EB-015890), Office of Scientific Research (FA9550-10-1-0538), and the Beckman Laser Institute Endowment. Dr. Chen has a financial interest in OCT Medical Imaging Inc., which, however, did not support this work.
References
- 1. http://www.biometrics.gov/documents/fingerprintrec.pdf.
- 2.Huang D, Swanson EA, Lin CP, Schuman JS, Stinson WG, Chang W, Hee MR, Flotte T, Gregory K, Puliafito CA, Fujimoto JG. Optical coherence tomography. Science. 1991;254:1178–1181. doi: 10.1126/science.1957169. [DOI] [PMC free article] [PubMed] [Google Scholar]
- 3.Liu MY, Buma T. Biometric mapping of fingertip eccrine glands with optical coherence tomography. IEEE Photon. Technol. Lett. 2010;22:1677–1679. [Google Scholar]
- 4.Cheng Y, Larin KV. In vivo two- and three-dimensional imaging of artificial and real fingerprints with optical coherence tomography. IEEE Photon. Technol. Lett. 2007;19:1634–1636. [Google Scholar]
- 5.Sangiorgi S, Manelli A, Congiu T, Bini A, Pilato G, Reguzzoni M, Raspanti M. Microvascularization of the human digit as studied by corrosion casting. J. Anat. 2004;204:123–131. doi: 10.1111/j.1469-7580.2004.00251.x. [DOI] [PMC free article] [PubMed] [Google Scholar]
- 6.Liu G, Chou L, Jia W, Qi W, Choi B, Chen Z. Intensity-based modified Doppler variance algorithm: application to phase instable and phase stable optical coherence tomography systems. Opt. Express. 2011;19:11429–11440. doi: 10.1364/OE.19.011429. [DOI] [PMC free article] [PubMed] [Google Scholar]
- 7.Liu G, Jia W, Sun V, Choi B, Chen Z. High-resolution imaging of microvasculature in human skin in-vivo with optical coherence tomography. Opt. Express. 2012;20:7694–7705. doi: 10.1364/OE.20.007694. [DOI] [PMC free article] [PubMed] [Google Scholar]
- 8.Jain AK, Chen Y, Demirkus M. Pores and ridges: high-resolution fingerprint matching using level 3 features. IEEE Trans. Pattern Anal. Mach. Intell. 2007;29:15–27. doi: 10.1109/tpami.2007.250596. [DOI] [PubMed] [Google Scholar]
- 9.Freinkel RK, Woodley DT, editors. The Biology of the Skin. Taylor & Francis; 2001. [Google Scholar]
- 10.Coffey VC. Biometric imaging–finger vein patterns used for identification. Laser Focus World. 2003;39:26–27. [Google Scholar]


