

Abstract
Tissue vs. plasma concentration profiles have been generated from a physiologically-based pharmacokinetic model of monoclonal antibody (mAb). Based on the profiles, we hypothesized that a linear relationship between the plasma and tissue concentrations of non-binding mAbs could exist; and that the relationship may be generally constant irrespective of the absolute mAb concentration, time, and animal species being analyzed. The hypothesis was verified for various tissues in mice, rat, monkey, and human using mAb or antibody-drug conjugate tissue distribution data collected from diverse literature. The relationship between the plasma and various tissue concentrations was mathematically characterized using the antibody biodistribution coefficient (ABC). Estimated ABC values suggest that typically the concentration of mAb in lung is 14.9%, heart 10.2%, kidney 13.7%, muscle 3.97%, skin 15.7%, small intestine 5.22%, large intestine 5.03%, spleen 12.8%, liver 12.1%, bone 7.27%, stomach 4.98%, lymph node 8.46%, adipose 4.78%, brain 0.351%, pancreas 6.4%, testes 5.88%, thyroid 67.5% and thymus is 6.62% of the plasma concentration. The validity of using the ABC to predict mAb concentrations in different tissues of mouse, rat, monkey, and human species was evaluated by generating validation data sets, which demonstrated that predicted concentrations were within 2-fold of the observed concentrations. The use of ABC to infer tissue concentrations of mAbs and related molecules provides a valuable tool for investigating preclinical or clinical disposition of these molecules. It can also help eliminate or optimize biodistribution studies, and interpret efficacy or toxicity of the drug in a particular tissue.
Keywords: ABC, ADC, antibody biodistribution coefficient, antibody drug conjugates, monoclonal antibody, tissue distribution, tissue vs. plasma concentration
Introduction
For many monoclonal antibodies (mAbs) and other targeted drug modalities, the molecular target may be located within tissues, making their pharmacodynamic (PD) and exaggerated-PD/toxic effects a function of tissue concentrations. It thus becomes important to characterize and accurately predict the tissue distribution of the molecule to better understand the dose-response relationship. For mAbs, the tissue distribution is usually investigated by performing biodistribution studies with radiolabeled molecules, but such studies are labor intensive, costly, and require large numbers of animals. Use of a physiologically-based pharmacokinetic (PBPK) model is an alternative to performing cumbersome in vivo biodistribution studies. The intricacy of PBPK models enables detailed quantitative assessment of the plasma and tissue disposition of drugs, and facilitates scale-up of the model to different species because the structural model is relatively common to most mammalian species. One such PBPK model for mAbs can simultaneously characterize the disposition data obtained from various published mAb PBPK models, and it is also capable of characterizing mAb disposition in various preclinical species and human simultaneously.1 The analysis presented here attempts to verify tissue distribution predictions made by the aforementioned platform PBPK model for mAb, and define the quantitative relationship between the plasma and tissue concentrations of mAb.
To understand the distribution characteristics of a drug in a given tissue, ‘local’ PBPK models can be used2 where the plasma concentrations vs. time profile of a drug is used as a forcing function to understand the time and dose-dependent changes in tissue drug concentrations. Alternatively, one can plot a tissue vs. plasma drug concentration profile to get a time-independent analysis of the relationship between the plasma and tissue concentrations of a drug in a given tissue. To understand the relationship between the plasma and tissue concentrations for mAbs in a time-independent manner, we used the platform PBPK model1 where plasma and tissue concentrations vs. time profiles for non-binding mAbs (i.e., mAbs that do not bind to any target) in mouse, rat, monkey and human were simulated. Tissue vs. plasma concentration profiles were generated for each tissue, and profiles for a given tissue were compared across the four species being analyzed. The predictions made by the PBPK model were verified by collecting the mAb tissue distribution data in mouse, rat, monkey, and human from various in-house studies and published literature. Additionally, biodistribution coefficients for mAb were established to help infer tissue mAb concentrations based on the plasma concentration.
Results
PBPK Model Simulations
The tissue vs. plasma mAb concentration profiles generated from the platform PBPK model simulations are shown in Figure 1. For each tissue, the profiles for mouse, rat, monkey, and human are superimposed. For all the tissues, a linear relationship between the plasma and tissue mAb concentrations, which was generally constant irrespective of the absolute mAb concentration and animal species being analyzed, was observed. For skin, muscle, adipose, and bone, a ‘hook-effect’ was observed for pre-distribution time points, where tissue concentrations fell below the linear relationship at respective plasma concentrations.

Figure 1. The figure shows tissue vs. plasma mAb concentration profiles for several tissues. For each tissue the PBPK model simulated profiles for mouse (pink), rat (green), monkey (red), and human (blue) are provided. The black solid line in each tissue panel is the relationship based on the estimated ABC value for the respective tissue, and black dotted lines around the solid line represent the 2-fold error envelop.
Estimation of antibody biodistribution coefficient
Tissue vs. plasma mAb concentration profiles for all the tissues from the training data set, along with the relationship generated for each tissue by model fitting, are shown in Figure 2. The estimated antibody biodistribution coefficient (ABC) value for each tissue is provided in Table 1.

Figure 2. Tissue vs. plasma mAb concentration profiles generated from the mouse training data set are shown. Black solid circles represent the observed data, and the black solid line in each tissue panel is the fitted line based on the estimated ABC value. Black dotted lines around the solid line represent the 2-fold error envelop. The black dashed circle around the data points for lung and brain highlights the distribution of antigen specific mAb in antigen positive tissues. The ‘n’ value in each panel displays the number of observed data points for each tissue.
Table 1. Estimated values of antibody biodistribution coefficients (ABCs).
| ABC (%) | CV% | |
|---|---|---|
| Lung | 14.9 | 4.95 |
| Heart | 10.2 | 3.57 |
| Kidney | 13.7 | 3.10 |
| Muscle | 3.97 | 5.76 |
| Skin | 15.7 | 5.67 |
| Small int. | 5.22 | 3.89 |
| Large int. | 5.03 | 4.74 |
| Spleen | 12.8 | 4.85 |
| Liver | 12.1 | 3.75 |
| Bone | 7.27 | 11.8 |
| Stomach | 4.98 | 8.06 |
| Lymph nodes | 8.46 | 11.4 |
| Fat | 4.78 | 9.59 |
| Brain | 0.351 | 10.7 |
| Pancreas | 6.40 | 14.6 |
| Testes | 5.88 | 10.8 |
| Thyroid | 67.5 | 38.4 |
| Thymus | 6.62 | 27.1 |
Validation of the ABC values using mouse mAb tissue distribution studies
Figure 3 shows the tissue vs. plasma mAb concentration relationship for various tissues based on the estimated ABC values from the training data set, superimposed over the profiles for each tissue generated using the mouse validation data set. The objective comparison between the predicted and observed data set (n = 913) provided the median %PE value of 29.7% with the 10th and 90th percentile values of 5.76 and 68.7%.

Figure 3. Tissue vs. plasma mAb concentration profiles generated from the mouse validation data set are shown. Black solid circles represents the observed data, the black solid line represents the profile generated based on the estimated ABC values, and black dotted lines around the solid line represent the 2-fold error envelop. The ‘n’ value in each panel displays the number of observed data points for each tissue. The black dashed circle around the data points for bone and spleen highlights the distribution of mAb that was labeled with zirconium.
Validation of the ABC values using rat mAb tissue distribution studies
Figure 4 shows the tissue vs. plasma mAb concentration relationship for various tissues based on the estimated ABC values, superimposed over the profiles for each tissue generated using the rat validation data set. The objective comparison between the predicted and observed data set (n = 369) provided the median % PE value of 28.6% with the 10th and 90th percentile values of 6.48 and 88.2%.

Figure 4. Tissue vs. plasma mAb concentration profiles generated from the rat validation data set are shown. Black solid dots represents the observed data, the black solid line represents the profile generated based on the mouse estimated ABC values, and black dotted lines around the solid line represent the 2-fold error envelop. The ‘n’ value in each panel displays the number of observed data points for each tissue.
Validation of the ABC values using monkey and human mAb tissue distribution studies
Figure 5 shows the tissue vs. plasma mAb concentration relationship for various tissues based on the estimated ABC values, superimposed over the profiles for each tissue generated using the monkey and human validation data set. The objective comparison between the predicted and observed data set (n = 124) provided the median % PE value of 52.9%, with the 10th and 90th percentile values of 24.6 and 74.7%.

Figure 5. The figure displays the tissue vs. plasma mAb concentration profiles generated from the monkey and human combined validation data set. Black open circles represents monkey and the black solid circles represents human observed data. Black solid line represents the profile generated based on the mouse estimated ABC values and black dotted lines around the solid line represent the 2-fold error envelop. The ‘n’ value in each panel displays the number of observed data points for each tissue.
Discussion
The rate and extent of mAb distribution in a tissue is determined by the rate and extent of extravasation within tissue, the rate of distribution within tissue, the rate and extent of antibody binding in tissue, and the rate of elimination from tissue.3,4 For a non-binding mAb (i.e., a mAb that does not bind to any target) or antigen-negative tissue, the binding component is not relevant and the distribution is mainly dependent on the extravasation and elimination processes, which are drive by the convective lymph flow to and from the tissue, and the vascular and interstitial reflection coefficients.1,3-5 Due to the large size and polarity of mAbs, it has been proposed that very little extravasation within tissues occurs via diffusion.6 Physiologically-based mathematical models that can account for the aforementioned physiological processes can aptly characterize the tissue distribution of mAb.1,5-7 Thus, simulations performed by the mAb PBPK models can be used to inform us regarding the disposition behavior of mAbs, e.g., > 98% of antibody enters tissue via convection,4,6 and skin, muscle, liver, and gut are the major organs for IgG catabolism, accounting for ~33, 24, 16 and 12% of the total IgG elimination, respectively.5,8 In this study, a previously published platform PBPK model for mAb1 was used to investigate the relationship between the plasma and tissue concentrations of mAbs.
The distribution characteristics of a mAb in a given tissue is typically represented by notations such as percentage of injected dose per gram of tissue, tissue-to-serum/plasma/blood ratio, absolute tissue concentrations, area under the tissue concentration-time curve (AUC), maximum achievable tissue concentration (Cmax), time to achieve Cmax (Tmax), tissue elimination half life, and uptake clearance (CLuptake).9 Analyzing tissue distribution data by plotting the tissue vs. plasma concentration profile, however, provides a unique time-independent insight into the distribution characteristics of a drug in a given tissue. To investigate the relationship between the plasma and tissue concentrations of mAb, PBPK model simulated data of a non-binding mAb in mouse, rat, monkey, and human were plotted as tissue vs. plasma concentration profiles for each tissue (Fig. 1). The model-generated data suggest that there is a linear relationship between plasma and tissue mAb concentration for all tissues. The relationship was similar for all four of the species analyzed and also seemed constant over a wide range of concentrations. Of note, since the tissue vs. plasma concentration profiles remove time from the equation, one can deduce that the linear relationship is also generally constant irrespective of time. For some tissues, e.g., skin, muscle, adipose, and bone, however, the model suggested a ‘hook-effect’ in the linear tissue vs. plasma concentration relationship, where at early (pre-distribution) times the tissue concentrations fell lower than the linear relationship. This can be explained by examination of the ratio of plasma flow to tissue volumes (parameter values in Shah and Betts1), which is smallest for these tissues, suggesting a slow uptake clearance for them and a longer time to reach equilibrium.
To verify the predictions made by the PBPK model, mouse mAb tissue distribution studies were collected from various publications to create a training data set (n = 1444). Tissue vs. plasma mAb concentration profiles were created for each available tissue in the training data set (Fig. 2). As predicted by the PBPK model, a linear relationship between the plasma and tissue mAb concentrations, was observed for all tissues; linearity was constant over the half-million fold concentration range. Additionally, as predicted by the PBPK model, a ‘hook-effect’ was observed for skin, muscle, adipose, and bone. It was also observed for lymph node, which was not part of the model.
The observed relationship between the plasma and tissue concentration of mAb for each tissue was fitted using a simple proportionality constant to estimate the biodistribution coefficient of mAb for each tissue. The value of ABC was estimated with reasonable confidence for all the tissues (Table 1), and the predicted tissue vs. plasma mAb concentration profiles for each tissue (along with the 2-fold error lines) superimposed over the observed results are shown in Figure 2. For all the tissues, the majority of the points from a very diverse data set fell within the 2-fold error envelope; however, interestingly, there were few systematic deviations from the linear relationships and few noteworthy outliers. For single profiles in the lung and brain, there was a systematic bias toward higher tissue concentration at any given plasma concentration compared with what one might expect based on the ABC value. Further analysis of these data points (highlighted by dashed circles in the panels for lung and brain in Figure 2) revealed that those points belong to mAbs that had specific antigens located in the respective tissues.9,10 Investigation of a few other outliers revealed that they were early time point samples taken from studies where the drug was administered as intraperitoneal injection. Stomach, adipose, spleen, and intestines were the main tissues affected by local contamination due to the proximity of the sample collection site with the drug administration site. Generation of anti-drug antibody (ADA) can also lead to disproportionate tissue distribution of mAb,9 which could be another reason for the presence of a few outliers (especially the left-most point in the heart, kidney, muscle, skin, small and large intestines, spleen, liver, bone, stomach, liver and adipose tissue panels of Figure 2).
The estimated ABC values for mAbs (Table 1) suggest that the concentration of mAb is ~4–16% of plasma concentration for most of the tissues. Brain has unusually lower (~0.3%) and thyroid has unusually higher (~68%) mAb concentration. These values are comparable to mAb tissue distribution values reported as tissue-to-blood ratios of 0.1–0.53 and other mAb tissue distribution values reported in various other formats.5,9 The very low value of mAb distribution to brain is also comparable to the literature where plasma-to-brain ratio is reported to be as high as ~500 (0.2%).4,11 The low value of mAb brain distribution is attributed to either FcRn efflux12 or inefficient convective uptake combined with rapid turnover of brain interstitial fluids that leads to efficient convective elimination of mAbs from the brain.4,11 Conversely, the high value of mAb distribution to thyroid may be due to the deposition of iodine-labeled metabolite into the tissue.
The validation of mouse-derived ABC values was performed by investigating the ability of these values to predict the tissue concentrations of mAbs, including antibody-drug conjugates (ADCs) based on the plasma concentrations of the mouse validation data set. Figure 3 depicts the predicted tissue vs. plasma mAb concentration profiles for each tissue (along with the 2-fold error lines) superimposed over the observed results from the mouse validation data set; as shown in the figure, the majority of the points fell within the 2-fold error envelope for all the tissues. The median %PE for the mouse validation data set was 29.7%, suggesting the ABC values generated based on the training data set are applicable to other mAb tissue distribution studies included in the mouse validation data set. As observed in the training data set, a ‘hook-effect’ was observed for skin and muscle in the mouse validation data set as well. For the spleen and bone, some outliers that fell notably out of the 2-fold error envelope were observed; these were attributed to a tissue distribution study conducted using zirconium-89, which is a residualizing isotope with a tendency to deposit in these tissues, as the label.13
Because the PBPK model predictions suggested that the distribution characteristics of mAbs (analyzed as tissue vs. plasma mAb concentration) between mouse, rat, monkey, and human is the same in a given tissue, the ability of mouse-derived ABC values to predict tissue mAb concentrations of other species was investigated. Figure 4 shows the mouse ABC predicted tissue vs. plasma mAb concentration profiles for each tissue (along with the 2-fold error lines) superimposed over the observed results from the rat validation data set. For all the tissues, the majority of the points fell within the 2-fold error envelope, and the median %PE for the rat validation data set was 28.6%. Consistent with the PBPK model predictions and the mouse data, a ‘hook-effect’ was observed for skin, muscle, and lymph node. In Figure 5, the mouse ABC predicted tissue vs. plasma mAb concentration profiles for each tissue are superimposed over the observed results from monkey and human validation data sets. Although the numbers of data points from these two species are very low compared with mouse and rat, the majority of the points fell within the 2-fold error envelope for all the tissues. The median %PE for the monkey and human combined validation data set was 52.9%. In Figure 1, the PBPK model predicted profiles of all the tissues for all four species are superimposed over mouse ABC predicted tissue vs. plasma mAb concentration profiles (along with the 2-fold error lines). For most of the tissues, the model predicted profiles were within the 2-fold error envelope generated based on the ABC values, which were estimated from the mouse mAb tissue distribution training data set. For brain, however, the model over-predicted the tissue concentrations because of the FcRn efflux and relatively faster lymph turnover process involved in the brain that were not incorporated in the platform PBPK model.1
In the study presented here, the predictions made by the mAb platform PBPK model were confirmed by the experimental data sets. We found that generally the tissue vs. plasma mAb concentration profiles for mAbs are linear, and the correlation between the plasma and tissue concentrations of mAb is constant, irrespective of the absolute mAb concentration and animal species analyzed. The linear relationship between plasma and tissue mAb concentration generally holds true irrespective of sample collection times, except for tissues with low blood flow to tissue volume ratio (e.g., muscle, skin, bone), for which the linear relationship is predictive at post-distribution (post-α phase) time points. Of note, distribution of mAbs with affinity toward an antigen may not follow the linear pattern in tissues that are antigen positive. It is not surprising that for most tissues the PBPK model well-predicted the tissue vs. plasma mAb concentrations because the model takes into account all the known necessary processes involved in the disposition of mAb. It was interesting, however, that, as predicted by the PBPK model, the correlation between the plasma and tissue concentrations of mAb (ABC values) was also constant across the four different species analyzed. One reason for the consistency could be the conserved nature of anatomy and physiological processes involved in mAb disposition among the analyzed species. Because of their large molecular weight, the tissue distribution of most mAbs is limited to vascular and interstitial spaces of tissues, and the presence of similar fractions of these spaces for a given tissue across the species may result in the similar extent of distribution. It is important to note that the PBPK model suggests that for many tissues a significant (more than 50%) amount of the drug in a tissue homogenate comes from the residual blood left in the tissue vasculature (data not shown), which may lead to significant differences in the tissue mAb concentrations of perfused vs. non-perfused tissues. As such, it would be important to exclusively analyze the tissue vs. plasma mAb concentration profiles from studies that collect tissues after proper perfusion, which is outside the scope of this report.
On comparing the FcRn knockout and the wild-type mouse, simulations performed using the PBPK model and the observed data obtained from literature did not show dramatic differences between the two strains in the tissue vs. plasma mAb concentration profiles for most tissues. There were, however, differences in the tissue vs. plasma mAb concentration profiles between the two strains for the muscle and skin, where the ‘hook-effect’ observed in the wild-type mouse was diminished or altered in the FcRn knockout mouse (data not shown). This result is consistent with the reported effect of FcRn on mAb distribution in these tissues.5 Of note, despite the assumption by the PBPK model that FcRn concentration is similar in the vascular endothelial cells of all the tissues in all species,1 it provided reasonable prediction of the tissue vs. plasma mAb concentration profiles for most of the tissues in all the species tested. This suggests either that the tissue distribution is not sensitive to the FcRn concentration or the assumption made by the PBPK model is close to reality.
Because use of ADCs as the targeting modality is increasing, two mouse and one rat ADC tissue distribution data sets were also included in the present analysis.14-16 It was observed that the tissue distribution of analyzed ADCs was not much different than that of naked mAbs (Figs. Three and 4, Fig. S1), suggesting that the conjugation of payload with mAbs did not dramatically alter the tissue distribution of the ADCs. It would be naïve to conclude, however, that the ADC disposition in tissues is usually similar to that of mAb based on the small number of examples tested here because there are clinical reports demonstrating different tissue distribution of ADC compared with its parent mAb, e.g., unexpected in vivo fate for the anti-Lewis Y ADC (CMD-193) in patients with advanced epithelial cancers, marked by difference in biodistribution of the ADC compared with parental antibody hu3S193.17
The mAb tissue distribution studies used to generate the data for our training and validation data sets employed iodine-125, iodine-131, indium-111, tritium (H-3), or zirconium-89 labels. It is therefore important to understand the affect the isotopes themselves can have on the outcome of mAb tissue distribution studies. Radioactive isotopes can be divided into residualizing (e.g., indium-111, zirconium-89) or non-residualizing (e.g., iodine-125) isotopes. It is generally believed that when a mAb is attached to a non-residualizing isotope, the isotope will leave the cell rapidly after digestion of mAb in the cells. When a mAb is attached to a residualizing isotope, however, the isotope can be retained in the cell for prolonged period of time after the mAb is digested. Thus, mAb tissue concentrations obtained using a non-residualizing isotope generally follow the serum concentration profile, and mAb tissue concentrations obtained using residualizing isotopes may not show as rapid a decline in concentration as the serum concentration profile. However, except for bone and spleen data from a zirconium-89 labeled mAb, we did not observe any visible trend where residualizing isotopes showed significant (within 2-fold) digression from ABC predicated tissue vs. plasma concentration profiles. This suggests that either the effect of residualizing isotopes was not significant enough to be captured as a systematic deviation from the typical tissue vs. plasma concentration profiles, or the effect of residualizing isotopes may be more prominent on molecules with short half-life (e.g., Fab and scFv) than on intact mAbs with relatively longer half-lives.
The estimated and validated ABC values for mAb tissue distribution presented here can have a significant effect on preclinical and clinical research by allowing prediction of tissue mAb concentration based on plasma concentration. Such predictions can aid in the dilution/preparation of tissue samples from mAb distribution studies. The ability to infer tissue mAb concentration can also help pharmacologists and toxicologists who may want to know mAb concentration in a specific tissue based on Cmax (maximum plasma concentration), Cmin (minimum plasma concentration) or Css (steady-state plasma concentration) for safety or efficacy evaluation purposes. Because a relationship for tissue distribution of non-binding mAbs is established, results from a reduced tissue distribution study can be compared with the expected ones based on the ABC values to determine if a mAb is showing specific affinity/retention in any given tissue, rather than executing an extensive tissue distribution study. The tissue vs. plasma mAb concentration profile from the experiment can be compared with the one established here to assess tissue targeting or experimental/analytical error based on deviation from the correlation. Thus, the established relationship described here can be used to avoid expensive, and often radiolabeled, tissue distribution studies, thereby saving time, money, resources, and the lives of animals. The proposed coefficient-based method to predict tissue concentration of mAb and related molecules provides a simpler alternative to the PBPK models because sophisticated mathematical modeling skills and software would not be needed to approximate tissue mAb concentrations using the ABC values.
In summary, based on the PBPK model and experimental data, we established that there is a linear relationship between the plasma and tissue concentration of mAbs. The relationship was quantified by estimating the ABCs for mAbs, which can help infer tissue mAb concentration based on the plasma concentration within a 2-fold error range. The ABC values established based on mouse data seem to hold for other animal species as well, and seems generally independent of concentration and time. The confidence in the tissue concentration predictions based on ABC values would be high for post-distribution predictions for mAbs and related molecules in the non-binding tissues. Because substantial amounts of data regarding the tissue distribution of mAbs and related molecules in different animal species are being generated, additional validation and evaluation of the proposed tissue vs. plasma concentration relationship and refinement of the ABC values, especially for monkey and human, are needed.
Materials and Methods
PBPK model simulations
A previously published platform PBPK model for mAb1 was used to simulate (using the software Berkeley Madonna, version 8.3.18) plasma and tissue concentrations vs. time profiles of non-binding mAbs in mouse, rat, monkey, and human. The mouse, rat, monkey, and human simulations were performed at 8, 0.7, 1, and 5 mg/kg doses, which are the same doses that were used to develop the PBPK model. For each tissue, the simulated data was plotted as ‘tissue mAb concentration vs. plasma mAb concentration’ profile. The tissue vs. plasma concentration profiles for all 4 species were superimposed for comparison.
Building training data set from mouse mAb tissue distribution studies
Twenty-three different mouse tissue distribution studies with various kinds of mAbs, in various animal models, with diverse route of administration and radiolabels were obtained from published or in-house references to build the training data set.5-7,9-11,18,19 The details about the individual biodistribution studies are provided in Table S1. The data set ranged from PK of a non-specific mAb in wild-type mouse, FcRn knockdown mouse, wild-type mouse pre-administered with IVIG, and tumor bearing nude mouse, to the PK of tumor antigen specific mAb in tumor bearing mouse. All the data sets were digitized from the literature (using the software ‘Grab It! XP’) and mean data were used for the analysis. Tissue and plasma concentration were converted in the units of nM for comparison.
Estimation of antibody biodistribution coefficient
Tissue concentration vs. plasma concentration profiles for all the tissues involved in the training data set was plotted to assess the pattern of the data. The data was fitted, with the software WinNonlin (version 5.2, Pharsight Corp.), using Equation 1 to estimate the ABC value for each tissue, which is essentially the slope of the tissue vs. plasma concentration profile:
mAb_Tissue Conc. = ABC • mAb_Plasma _Conc.
Validation data set from mouse mAb tissue distribution studies
Twenty-one different mouse tissue distribution studies from published references other than the ones used to develop the mouse training data set, with various kinds of mAbs and ADC, in various animal models and with diverse radiolabels, were used to build the mouse validation data set.13-15,20-28 Details about the individual biodistribution studies are provided in Table S2. Based on equation 1, using the plasma mAb concentration and ABC values, expected tissue concentrations were calculated for each tissue. For quantitative comparison of observed and predicted tissue concentration data, the median percent predictive error (%PE) with 10 and 90 percentiles was calculated for the whole data sets using Equation 2:
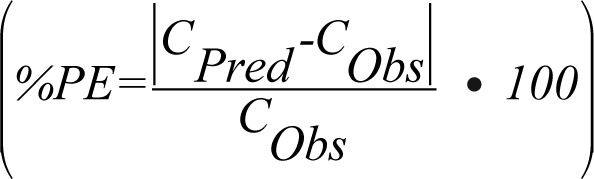 |
Validation data set from rat, monkey, and human mAb tissue distribution studies
Fourteen different rat tissue distribution studies,16,19,24,29-33 3 different monkey tissue distribution studies,24,34 and one human tissue distribution study with a non-binding mAb35 were used to build two different non-mouse validation data sets. Data from monkey and the human tissues distribution studies were combined in a single validation data set. The details about the individual biodistribution studies are provided in Tables S3 and S4. Based on the ABC values and Equation 1, expected tissue concentrations were calculated for each tissue. For quantitative comparison of observed and predicted tissue concentration data, the median percent predictive error (%PE) with 10 and 90 percentiles was calculated for both the data sets.
Supplementary Material
Disclosure of Potential Conflicts of Interest
No potential conflicts of interest were disclosed.
Footnotes
Previously published online: www.landesbioscience.com/journals/mabs/article/23684
References
- 1.Shah DK, Betts AM. Towards a platform PBPK model to characterize the plasma and tissue disposition of monoclonal antibodies in preclinical species and human. J Pharmacokinet Pharmacodyn. 2012;39:67–86. doi: 10.1007/s10928-011-9232-2. [DOI] [PubMed] [Google Scholar]
- 2.Tanaka C, Kawai R, Rowland M. Physiologically based pharmacokinetics of cyclosporine A: reevaluation of dose-nonlinear kinetics in rats. J Pharmacokinet Biopharm. 1999;27:597–623. doi: 10.1023/A:1020978509566. [DOI] [PubMed] [Google Scholar]
- 3.Lobo ED, Hansen RJ, Balthasar JP. Antibody pharmacokinetics and pharmacodynamics. J Pharm Sci. 2004;93:2645–68. doi: 10.1002/jps.20178. [DOI] [PubMed] [Google Scholar]
- 4.Wang W, Wang EQ, Balthasar JP. Monoclonal antibody pharmacokinetics and pharmacodynamics. Clin Pharmacol Ther. 2008;84:548–58. doi: 10.1038/clpt.2008.170. [DOI] [PubMed] [Google Scholar]
- 5.Garg A, Balthasar JP. Physiologically-based pharmacokinetic (PBPK) model to predict IgG tissue kinetics in wild-type and FcRn-knockout mice. J Pharmacokinet Pharmacodyn. 2007;34:687–709. doi: 10.1007/s10928-007-9065-1. [DOI] [PubMed] [Google Scholar]
- 6.Baxter LT, Zhu H, Mackensen DG, Jain RK. Physiologically based pharmacokinetic model for specific and nonspecific monoclonal antibodies and fragments in normal tissues and human tumor xenografts in nude mice. Cancer Res. 1994;54:1517–28. [PubMed] [Google Scholar]
- 7.Ferl GZ, Wu AM, DiStefano JJ., 3rd A predictive model of therapeutic monoclonal antibody dynamics and regulation by the neonatal Fc receptor (FcRn) Ann Biomed Eng. 2005;33:1640–52. doi: 10.1007/s10439-005-7410-3. [DOI] [PubMed] [Google Scholar]
- 8.Keizer RJ, Huitema AD, Schellens JH, Beijnen JH. Clinical pharmacokinetics of therapeutic monoclonal antibodies. Clin Pharmacokinet. 2010;49:493–507. doi: 10.2165/11531280-000000000-00000. [DOI] [PubMed] [Google Scholar]
- 9.Vugmeyster Y, DeFranco D, Szklut P, Wang Q, Xu X. Biodistribution of [125I]-labeled therapeutic proteins: application in protein drug development beyond oncology. J Pharm Sci. 2010;99:1028–45. doi: 10.1002/jps.21855. [DOI] [PubMed] [Google Scholar]
- 10.Vugmeyster Y, DeFranco D, Pittman DD, Xu X. Pharmacokinetics and lung distribution of a humanized anti-RAGE antibody in wild-type and RAGE-/- mice. MAbs. 2010;2:571–5. doi: 10.4161/mabs.2.5.13089. [DOI] [PMC free article] [PubMed] [Google Scholar]
- 11.Garg A, Balthasar JP. Investigation of the influence of FcRn on the distribution of IgG to the brain. AAPS J. 2009;11:553–7. doi: 10.1208/s12248-009-9129-9. [DOI] [PMC free article] [PubMed] [Google Scholar]
- 12.Zhang Y, Pardridge WM. Mediated efflux of IgG molecules from brain to blood across the blood-brain barrier. J Neuroimmunol. 2001;114:168–72. doi: 10.1016/S0165-5728(01)00242-9. [DOI] [PubMed] [Google Scholar]
- 13.Perk LR, Visser GW, Vosjan MJ, Stigter-van Walsum M, Tijink BM, Leemans CR, et al. (89)Zr as a PET surrogate radioisotope for scouting biodistribution of the therapeutic radiometals (90)Y and (177)Lu in tumor-bearing nude mice after coupling to the internalizing antibody cetuximab. J Nucl Med. 2005;46:1898–906. [PubMed] [Google Scholar]
- 14.Xie H, Audette C, Hoffee M, Lambert JM, Blättler WA. Pharmacokinetics and biodistribution of the antitumor immunoconjugate, cantuzumab mertansine (huC242-DM1), and its two components in mice. J Pharmacol Exp Ther. 2004;308:1073–82. doi: 10.1124/jpet.103.060533. [DOI] [PubMed] [Google Scholar]
- 15.Alley SC, Zhang X, Okeley NM, Anderson M, Law CL, Senter PD, et al. The pharmacologic basis for antibody-auristatin conjugate activity. J Pharmacol Exp Ther. 2009;330:932–8. doi: 10.1124/jpet.109.155549. [DOI] [PubMed] [Google Scholar]
- 16.Boswell CA, Mundo EE, Zhang C, Bumbaca D, Valle NR, Kozak KR, et al. Impact of drug conjugation on pharmacokinetics and tissue distribution of anti-STEAP1 antibody-drug conjugates in rats. Bioconjug Chem. 2011;22:1994–2004. doi: 10.1021/bc200212a. [DOI] [PubMed] [Google Scholar]
- 17.Herbertson RA, Tebbutt NC, Lee FT, MacFarlane DJ, Chappell B, Micallef N, et al. Phase I biodistribution and pharmacokinetic study of Lewis Y-targeting immunoconjugate CMD-193 in patients with advanced epithelial cancers. Clin Cancer Res. 2009;15:6709–15. doi: 10.1158/1078-0432.CCR-09-0536. [DOI] [PMC free article] [PubMed] [Google Scholar]
- 18.Garg A. Investigation of the role of FcRn in the absorption, distribution, and elimination of monoclonal antibodies. PhD Thesis, Department of Pharmaceutical Sciences. Buffalo: SUNY at Buffalo, 2007: Chapter 3:71-111. [Google Scholar]
- 19.Vugmeyster Y, Szklut P, Tchistiakova L, Abraham W, Kasaian M, Xu X. Preclinical pharmacokinetics, interspecies scaling, and tissue distribution of humanized monoclonal anti-IL-13 antibodies with different IL-13 neutralization mechanisms. Int Immunopharmacol. 2008;8:477–83. doi: 10.1016/j.intimp.2007.12.004. [DOI] [PubMed] [Google Scholar]
- 20.Fleuren ED, Versleijen-Jonkers YM, van de Luijtgaarden AC, Molkenboer-Kuenen JD, Heskamp S, Roeffen MH, et al. Predicting IGF-1R therapy response in bone sarcomas: immuno-SPECT imaging with radiolabeled R1507. Clin Cancer Res. 2011;17:7693–703. doi: 10.1158/1078-0432.CCR-11-1488. [DOI] [PMC free article] [PubMed] [Google Scholar]
- 21.van Rij CM, Sharkey RM, Goldenberg DM, Frielink C, Molkenboer JD, Franssen GM, et al. Imaging of prostate cancer with immuno-PET and immuno-SPECT using a radiolabeled anti-EGP-1 monoclonal antibody. J Nucl Med. 2011;52:1601–7. doi: 10.2967/jnumed.110.086520. [DOI] [PubMed] [Google Scholar]
- 22.Burvenich I, Schoonooghe S, Cornelissen B, Blanckaert P, Coene E, Cuvelier C, et al. In vitro and in vivo targeting properties of iodine-123- or iodine-131-labeled monoclonal antibody 14C5 in a non-small cell lung cancer and colon carcinoma model. Clin Cancer Res. 2005;11:7288–96. doi: 10.1158/1078-0432.CCR-04-2503. [DOI] [PubMed] [Google Scholar]
- 23.Akanji AG, Muramoto E, Filho SC, Couto RM, Araújo EB. Radiolabeling and biodistribution of monoclonal antibody (MAb) anti-CD20 with iodine-131. Brazilian Archives of Biology and Technology. 2005;48:69–72. doi: 10.1590/S1516-89132005000700010. [DOI] [Google Scholar]
- 24.Haunschild J, Steiner K, Faro HP, Senekowitsch R. Pharmacokinetics of reshaped MAb 425 in three animal species. Cell Biophys. 1995;26:167–82. doi: 10.1007/BF02791578. [DOI] [PubMed] [Google Scholar]
- 25.Shankar S, Vaidyanathan G, Affleck DJ, Peixoto K, Bigner DD, Zalutsky MR. Evaluation of an internalizing monoclonal antibody labeled using N-succinimidyl 3-[131I]iodo-4-phosphonomethylbenzoate ([131I]SIPMB), a negatively charged substituent bearing acylation agent. Nucl Med Biol. 2004;31:909–19. doi: 10.1016/j.nucmedbio.2004.04.007. [DOI] [PubMed] [Google Scholar]
- 26.Brouwers A, Mulders P, Oosterwijk E, Buijs W, Corstens F, Boerman O, et al. Pharmacokinetics and tumor targeting of 131I-labeled F(ab’)2 fragments of the chimeric monoclonal antibody G250: preclinical and clinical pilot studies. Cancer Biother Radiopharm. 2004;19:466–77. doi: 10.1089/cbr.2004.19.466. [DOI] [PubMed] [Google Scholar]
- 27.Abuqayyas L, Balthasar JP. Pharmacokinetic mAb-mAb interaction: anti-VEGF mAb decreases the distribution of anti-CEA mAb into colorectal tumor xenografts. AAPS J. 2012;14:445–55. doi: 10.1208/s12248-012-9357-2. [DOI] [PMC free article] [PubMed] [Google Scholar]
- 28.Khawli LA, Mizokami MM, Sharifi J, Hu P, Epstein AL. Pharmacokinetic characteristics and biodistribution of radioiodinated chimeric TNT-1, -2, and -3 monoclonal antibodies after chemical modification with biotin. Cancer Biother Radiopharm. 2002;17:359–70. doi: 10.1089/108497802760363150. [DOI] [PubMed] [Google Scholar]
- 29.Buchegger F, Chalandon Y, Pèlegrin A, Hardman N, Mach JP. Bone marrow dosimetry in rats using direct tissue counting after injection of radio-iodinated intact monoclonal antibodies or F(ab’)2 fragments. J Nucl Med. 1991;32:1414–21. [PubMed] [Google Scholar]
- 30.Danilov SM, Gavrilyuk VD, Franke FE, Pauls K, Harshaw DW, McDonald TD, et al. Lung uptake of antibodies to endothelial antigens: key determinants of vascular immunotargeting. Am J Physiol Lung Cell Mol Physiol. 2001;280:L1335–47. doi: 10.1152/ajplung.2001.280.6.L1335. [DOI] [PubMed] [Google Scholar]
- 31.Muzykantov VR, Puchnina EA, Atochina EN, Hiemish H, Slinkin MA, Meertsuk FE, et al. Endotoxin reduces specific pulmonary uptake of radiolabeled monoclonal antibody to angiotensin-converting enzyme. J Nucl Med. 1991;32:453–60. [PubMed] [Google Scholar]
- 32.O’Boyle KP, Goya V, Zuckier LS, Chun S, Bhargava K. Expression of human tumor mucin-associated carbohydrate epitopes, including sialylated Tn, and localization of murine monoclonal antibodies CC49 and B72.3 in a syngeneic rat colon carcinoma model. J Immunother Emphasis Tumor Immunol. 1994;16:251–61. doi: 10.1097/00002371-199411000-00001. [DOI] [PubMed] [Google Scholar]
- 33.Pepinsky RB, Shao Z, Ji B, Wang Q, Meng G, Walus L, et al. Exposure levels of anti-LINGO-1 Li81 antibody in the central nervous system and dose-efficacy relationships in rat spinal cord remyelination models after systemic administration. J Pharmacol Exp Ther. 2011;339:519–29. doi: 10.1124/jpet.111.183483. [DOI] [PubMed] [Google Scholar]
- 34.Matthews DC, Appelbaum FR, Eary JF, Hui TE, Fisher DR, Martin PJ, et al. Radiolabeled anti-CD45 monoclonal antibodies target lymphohematopoietic tissue in the macaque. Blood. 1991;78:1864–74. [PubMed] [Google Scholar]
- 35.Buist MR, Kenemans P, den Hollander W, Vermorken JB, Molthoff CJ, Burger CW, et al. Kinetics and tissue distribution of the radiolabeled chimeric monoclonal antibody MOv18 IgG and F(ab’)2 fragments in ovarian carcinoma patients. Cancer Res. 1993;53:5413–8. [PubMed] [Google Scholar]
Associated Data
This section collects any data citations, data availability statements, or supplementary materials included in this article.