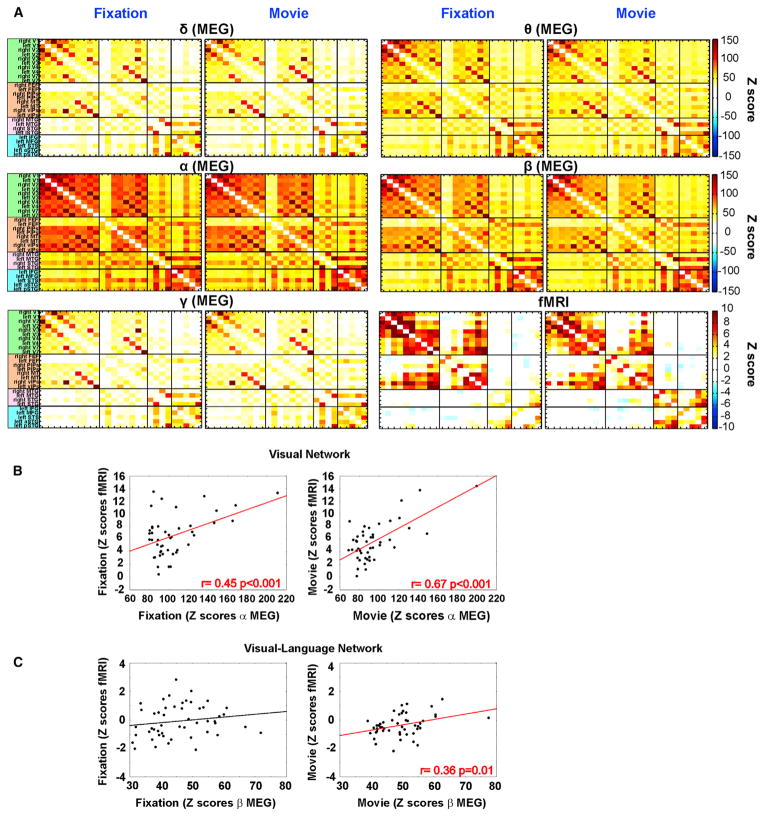
Figure 7. MEG BLP versus fMRI Covariance Structures.
(A) Group-level Z score covariance matrices for fixation and movie by nodes for each MEG BLP and fMRI. Each row represents the interregional Z score correlation between nodes belonging either to the same RSN (within-network interaction) or to distinct networks (cross-network interaction).
(B) Spatial correlation between MEG and fMRI covariance structures for the within-network interaction in visual network (fMRI-α BLP correlation), during fixation and movie.
(C) Spatial correlation between MEG and fMRI covariance structures for the across-network interaction (fMRI-β BLP correlation) between the visual and the language network, during fixation and movie.
See also Table S2.

