

Abstract
Objective:
The purpose of this study was to determine (a) whether among sober (blood alcohol concentration [BAC] = .00%) drivers, being drug positive increases the drivers' risk of being killed in a fatal crash; (b) whether among drinking (BAC > .00%) drivers, being drug positive increases the drivers' risk of being killed in a fatal crash; and (c) whether alcohol and other drugs interact in increasing crash risk.
Method:
We compared BACs for the 2006, 2007, and 2008 crash cases drawn from the U.S. Fatality Analysis Reporting System (FARS) with control drug and blood alcohol data from participants in the 2007 U.S. National Roadside Survey. Only FARS drivers from states with drug information on 80% or more of the drivers who also participated in the 2007 National Roadside Survey were selected.
Results:
For both sober and drinking drivers, being positive for a drug was found to increase the risk of being fatally injured. When the drug-positive variable was separated into marijuana and other drugs, only the latter was found to contribute significantly to crash risk. In all cases, the contribution of drugs other than alcohol to crash risk was significantly lower than that produced by alcohol.
Conclusions:
Although overall, drugs contribute to crash risk regardless of the presence of alcohol, such a contribution is much lower than that by alcohol. The lower contribution of drugs other than alcohol to crash risk relative to that of alcohol suggests caution in focusing too much on drugged driving, potentially diverting scarce resources from curbing drunk driving.
A body of work ranging from experimental studies (Dobbs, 2005; Moskowitz and Wilkinson, 2004) to epidemiological studies (Asbridge et al., 2012; Berghaus et al., 2010; Elvik, 2012; Kelly et al., 2004; Rapoport et al., 2009) suggests that drug use impairs skills related to driving. In response to this growing concern, several countries (e.g., Australia, Britain, the Netherlands, and Norway) have been developing new legislation criminalizing driving while impaired by drugs other than alcohol (Transport Research Centre and International Transport Forum, 2010). In the United States, concern with drugged driving has increased since the publication of the results from the 2007 National Roadside Survey (NRS), which found that 14% of drivers were using drugs other than alcohol compared with 12% using only alcohol (Lacey et al., 2009). Stimulated in part by these results, the U.S. Office on National Drug Control Policy (ONDCP) issued a call in 2010 for states to enact per se drugged-driving laws (DuPont et al., 2012). Seventeen states currently have such laws (Voas et al., 2012).
A key requirement for designing efficient drugged-driving laws is the accurate determination of the marginal increase in crash risk associated with drugged driving relative to the crash risk associated with the absence of drugs. In an attempt to estimate such relative risk (RR), a large and comprehensive study—the Driving Under the Influence of Drugs, Alcohol and Medicines (DRUID) project—has recently been completed by a consortium of nine European nations (Hels et al., 2011). Based on a comparison of data from injured drivers entering medical facilities with data collected from drivers stopped at road surveys, the DRUID project found an increase in the RR of injury and death among drivers testing positive for drugs (Bernhoft, 2011; Hargutt et al., 2011). In the United States, no study comparing crash data with roadside data has yet been reported. We believe that this article constitutes the first U.S. study to estimate the RR of fatal crash involvement associated with drugged drivers using fatally crashed drivers as cases and roadside survey drivers as controls.
The strategy of estimating RR by comparing drivers in fatal crashes with roadside survey drivers has been applied in the past to the analysis of alcohol-related crash risk (Voas et al., 2012; Zador et al., 2000). However, absent from those reports is the contribution to crash risk of drugs either alone or associated with alcohol. We now have an opportunity to address that gap with the inclusion of drug testing in the 2007 NRS and the improved reporting of drug tests on fatally injured drivers in the U.S. census of fatal crashes contained in the Fatality Analysis Reporting System (FARS). On November 30, 2010, the National Highway Traffic Safety Administration (NHTSA) released the “first ever analysis of drug involvement among deceased drivers in fatal crashes” (NHTSA, 2010). Hingson et al. (2010) and Romano and Voas (2011) were among the first to explore drug involvement in this publicly available file. Using the FARS, these authors have shown that about 20 of the 50 states have now provided drug-use information in the FARS on at least 80% of their fatally injured drivers, creating a critical mass of information suitable for scientific research and policy analysis. By taking advantage of this data development, Romano and Voas (2011) examined the FARS for fatally injured drivers involved in single-vehicle crashes in states in which 80% or more of the drivers were tested for drugs other than alcohol and had a known result. They found that about 25% of the drivers tested positive for drugs, a figure almost double the 14% found in the 2007 NRS. Relevant to this effort, they found evidence suggesting that the contribution of these drugs to crash risk may vary, depending on the presence of alcohol.
Given the strong potential role of drugs in influencing crash risk (alcohol related or not) and the possible interaction between drugs and alcohol in shaping such risk, the availability of drug information in the 2007 NRS, and the recent confirmation that reliable information on drugs other than alcohol is now available in the FARS, this effort aims to determine (a) whether among sober (blood alcohol concentration [BAC] = .00%) drivers, being drug positive increases the driver's risk of being killed in a fatal crash; (b) whether among drinking (BAC > .00%) drivers, being drug positive increases the driver's risk of being killed in a fatal crash; and (c) whether alcohol and other drugs interact in increasing crash risk.
Method
The overall analytical strategy pursued by this effort follows that of Zador et al. (2000) and Voas et al. (2012) based on the matching and subsequent analysis of comparable exposure and crash data. Zador et al. (2000) provided a detailed justification for the use of the fatality data (FARS) and exposure data (NRS) to estimate the RR of being fatally injured in a vehicle crash. Briefly, the RR of a fatal crash between two groups is estimated by comparing the fatality/ exposure ratio between the two groups, which is calculated using the FARS and NRS information.
Exposure
Measures of crash exposure were obtained from the 2007 NRS (Lacey et al., 2009), for which researchers collected information on daytime and nighttime drivers of noncommercial motor vehicles on Fridays during the day and on Friday and Saturday nights in the 48 contiguous states (Lacey et al., 2009). Survey sites for the 2007 NRS were selected from 60 primary sampling units of the National Analysis Sampling System/General Estimates System of NHTSA. Drivers were randomly selected from the traffic flow at those sites and recruited for participation in the survey (Lacey et al., 2009). As in previous roadside surveys, the 2007 NRS collected information on the drivers' age, gender, race, ethnicity, and BAC. New to the 2007 NRS was the collection of an oral-fluid sample that was submitted for laboratory analysis to determine the presence of drugs other than alcohol. A list of all drugs tested in the FARS and 2007 NRS is shown in Table 1. About 71% of the eligible drivers provided an oral-fluid sample (Lacey et al., 2009). Despite such relatively high participation, Lacey and colleagues addressed the possibility of sampling bias by (a) offering large monetary incentives ($100) to refusals to reconsider and participate and (b) replicating the survey using the protocol established for the 1996 NRS, which excluded oral-fluid samples. The outcome of both analyses suggested that the main reason for refusing participation in the oral-fluid component of the 2007 NRS was the additional time required for survey completion, a finding that reduces our concerns about sampling bias in the exposure database (Lacey et al., 2009). The oral-fluid samples were analyzed using enzyme-linked immunosorbent assay screening, followed by a confirmatory analysis by liquid chromatography-tandem mass spectrometry or gas chromatography/mass spectrometry (Lacey et al., 2009).
Table 1.
Drugs tested for in the U.S. Fatality Analysis Reporting System and the 2007 National Road-side Survey
| Cannabinoids | Depressants | Narcotic analgesics | Stimulants | Other |
| Marijuana | Barbiturates | Methadone | Amphetamines | Street drugs |
| THC | Butalbital | Methadone | Amphetamine | Ketamine |
| Phenobarbital | MDA/MDEA | PCP | ||
| Pentobarbital | Opiates | MDMA | ||
| Secobarbital | Codeine | Methamphetamine | ||
| Morphine | Phentermine | |||
| Benzodiazepines | Hydrocodone | |||
| Alprazolam | Hydromorphone | Cocaine | ||
| Chlordiazepoxide | Oxycodone | Cocaine | ||
| Diazepam | Oxymorphone | Benzoylecgonine | ||
| Lorazepam | ||||
| Oxazepam | Atypical opioids | ADHD medications | ||
| Temazepam | Meperidine | Methylphenidate | ||
| Triazolam | Propoxyphene | |||
| Clonazepam | ||||
| Flunitrazepam | ||||
| Bromazepam | ||||
| Nitrazepam | ||||
| Estazolam | ||||
| Midazolam | ||||
| Flurazepam | ||||
| Nordiazepam | ||||
| Carisoprodol | ||||
| Carisoprodol | ||||
| Meprobamate | ||||
| Sleep aids | ||||
| Zolpidem |
Notes: THC = Δ9-tetrahydrocannabinol; MDA/MDEA = 3,4-methylenedioxyamphetamine/3,4-methylene-dioxy-N-ethylamphetamine; MDMA = 3,4-methylenedioxy-N-methylamphetamine; ADHD = attention-deficit/hyperactivity disorder; PCP = phencyclidine. Source: 2011 Fatality Analysis Reporting System, Coving and Validation Manual (National Highway Traffic Safety Administration, 2012) and 2007 National Roadside Survey—drug results (Lacey et al., 2009).
Crash data
For crash data, we used the FARS. The descriptions of each fatal crash reported in the FARS characterize in detail the features of the crash and the vehicles involved. In addition, the FARS informs about each driver's age, gender, and race and lists each driver's BAC and drug-test results. In this study, we used driver records having known drug-test results and BACs. Information about drug use from deceased drivers was obtained by using either blood or urine samples (or both). Only driver records having known drug-test results and BACs were used. To allow for a meaningful merging of databases, only a selected number of FARS records was used in this study.
First, we selected crash data only from states that were surveyed in the 2007 NRS. Unlike Voas et al. (2012), who matched the 2007 NRS with the 2006-2007 FARS, in this effort, we used the 2006-2008 FARS. The inclusion of one more year allowed for a larger sample size and, therefore, more power to account for the stricter data selection process we applied to this effort.
Second, we considered only states that routinely test fatally injured drivers for drugs other than alcohol. Following the approach by Hingson and others, we included just those states in which at least 80% of the fatally injured drivers have known drug-test results (surviving drivers are generally not tested) (Hingson et al., 2010; Romano and Pollini, 2013; Romano and Voas, 2011). As suggested by Hingson and colleagues, by restricting our study to states that routinely test for drugs other than alcohol, we avoided much of the laboratory-based variation caused by data originated after occasional, court-mandated analyses. Nine states matched these two selection criteria: California, Colorado, Illinois, Maryland, New Jersey, New Mexico, North Carolina, Ohio, and Pennsylvania.
Third, to further match the conditions of the crash-exposure database (the 2007 NRS), we considered only the FARS records of drivers of four-wheeled passenger vehicles who were between 16 and 97 years old and who had been involved in crashes that occurred (a) on Fridays between 9 a.m. and 4 p.m. or on Fridays and Saturdays between 10 p.m. and 3 a.m.; (b) outside of Indian country on paved roads not classified as an interstate or an urban freeway or expressway; and (c) in counties with a population of at least 20,000 in the years covered by this study, according to the U.S. Census projections.
Analyses
As in Zador et al. (2000), we approximated the RR of a fatal crash by computing odds ratios (ORs), which provide accurate estimates of RR when the frequency of the targeted disease (e.g., crashes) is small relative to the exposed population (Agresti, 2002). In this article, we therefore use the acronyms “RR” or “OR” interchangeably when referring to results from our logistic regressions.
The logistic regression involved a binary response depending on whether the driver is a “case” (i.e., 2006-2008 FARS) or a “control” (i.e., 2007 NRS). We considered five predictors in the logistic regressions—gender, age, race/ ethnicity, BAC, and drug result—and all the possible dual interactions among them. To account for (a) the possibility that fewer fatal crashes occurred at nighttime than at daytime and (b) time-based differences in alcohol and other drug use (Romano and Pollini, 2013), we also examined the impact the inclusion of “time of the day” as an explanatory variable would have on the outcome of the logistic regressions. The variable time of the day had a value of 1 to indicate daytime (Friday between 9 p.m. and 4 p.m.) and a value of 0 otherwise (i.e., Fridays and Saturdays between 10 p.m. and 3 p. M .—nighttime).
Drug results were codified into a single binary variable indicating the presence or absence of any drug other than alcohol. We also conducted separate analyses for marijuana. The BAC was entered as a continuous variable in the models, although it was rescaled by multiplying the actual BAC by 1,000 to avoid large coefficient estimates associated with BAC in the logistic models (we denoted the rescaled BAC by breath alcohol concentration). Last, despite relying only on states that routinely test their fatally injured drivers for drugs other than alcohol, the likelihood of finding drug-positive drivers may vary from state to state because of some unaccounted laboratory differences across states. Following Romano and Pollini (2013), we included random intercepts in the logistic model to account for such a possibility, yielding a logistic model with random effects that is usually termed a “logistic-normal” model (Agresti, 2002):
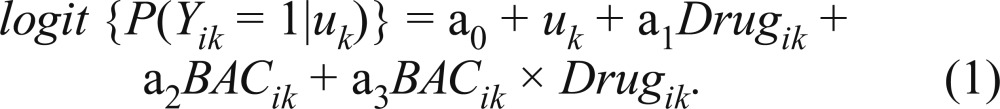 |
Model 1 illustrates a logistic model with the covariates BAC and Drug, the indicator variable for the presence of any drugs other than alcohol (0 = drug negative, 1 = drug positive) and their interaction. The variable Yik takes the value of 1 if the ith driver record is a fatal crash from the kth state, elsewhere zero. Random intercepts (which account for the clustering effect of state) are represented by the term uk, which is assumed to be normally distributed with zero mean and variance σ2. The OR for two drivers from state k(i.e., two drivers with random effects uk and ul), is equal to exp {(uk − ul) + a1 + a3BAC}. In a logistic-normal model with a small variance of the random effects (σ2), the coefficients in Model 1 could have an interpretation similar to that coming from an ordinary logistic regression with fixed effects. For ease of interpretation in the discussion of results, we focus on the case where term (uk− ul) is not present in the OR calculation. That is, we limit the discussion to scenarios in which, for instance, drug-positive and drug-negative drivers come from the same state. This assumption leads to the same OR calculation as in the ordinary logistic regression (i.e., the exponential of the coefficients). To estimate the crash risk attributed to marijuana, variable Drugik was replaced in Model 1 by a variable denoting three levels (0 = drug negative, 1 = marijuana positive, 2 = positive for drugs other than marijuana).
Key to this effort is the examination of the Dual Drug x Alcohol interaction. If significant, that interaction would indicate that the contribution of drugs other than alcohol to crash risk varies depending on the driver being alcohol positive or not. If positive, we could subsequently estimate how much crash risk increases when drug consumption is added to alcohol consumption. The Akaike Information Criterion and the Schwarz Criterion were used to compare candidate models (i.e., model with main effects vs. model with main effects and interaction terms). Logistic models were fitted using PROC GLIMMIX from the SAS/STAT software, Version 8.2, of the SAS System for Windows (SAS Institute Inc., Cary, NC).
Results
Table 2 lists the number of drivers in the databases by state. Table 2 shows variation among the states in their contribution to the exposure and crash files, which provides support for the decision to adjust risk estimates by state-based differences.
Table 2.
Number of drivers fatally injured in crashes having drug and blood alcohol concentration information from states with at least 80% of drug-test results from 2006 to 2008 U.S. Fatality Analysis Reporting System (FARS) and number of drivers from 2007 National Roadside Survey (NRS)
| 2007 NRS |
2006-2008 FARS |
|||
| State | n | % | n | % |
| California | 589 | 17.2 | 493 | 27.9 |
| Colorado | 121 | 3.5 | 55 | 3.1 |
| Illinois | 242 | 7.1 | 164 | 9.3 |
| Maryland | 275 | 8.0 | 109 | 6.2 |
| New Jersey | 129 | 3.8 | 108 | 6.1 |
| New Mexico | 144 | 4.2 | 44 | 2.5 |
| North Carolina | 468 | 13.7 | 288 | 16.3 |
| Ohio | 804 | 23.5 | 225 | 12.7 |
| Pennsylvania | 652 | 19.0 | 280 | 15.9 |
| Total | 3,424 | 100.0 | 1,766 | 100.0 |
Table 3 lists the percentage of drivers who were drug positive and the percentage of drivers who tested positive for each of five drug categories. On both NRS and FARS, cannabinols were the most prevalent drugs followed by stimulants. About 9% of the crash case drivers were cannabi-nol positive compared with only around 6% of the controls. Stimulants were present in nearly 7% of the fatal crashes and 4% of the control drivers. These differences seem to suggest that cannabinols and stimulants are contributors to fatal crash risk.
Table 3.
Prevalence of drug categories in the nine selected states
| 2007 NRS |
2006-2008 FARS |
||||
| Drug category | n | % | n | % | Unadjusted ORa [95% CI] |
| Positive | 441 | 12.9 | 348 | 19.7 | 1.66 [1.42, 1.94] |
| Cannabinol | 220 | 6.4 | 162 | 9.2 | 1.55 [1.25, 1.92] |
| Narcotic | 99 | 2.9 | 54 | 3.1 | 1.14 [0.92, 1.61] |
| Depressant | 12 | 0.4 | 42 | 2.4 | NEb |
| Stimulant | 129 | 3.8 | 115 | 6.5 | 1.87 [1.45, 2.43] |
| Other (PCP, others) | 19 | 0.6 | 77 | 4.4 | NEb |
| Negative | 2,983 | 87.1 | 1,418 | 80.3 | |
| Sample size, n | 3,424 | 1,766 | |||
Notes: NRS = National Roadside Survey; FARS = U.S. Fatality Analysis Reporting System; OR = odds ratio; CI = confidence interval; PCP = phencyclidine.
ORs were estimated relative to “negative”; “unadjusted” denotes ORs were estimated from raw counts;
NE stands for “not estimated” and denotes a sample too small for meaningful estimates.
The marginal and joint prevalence of alcohol and other drugs are shown in Table 4. There are more alcohol-positive drivers among crashes (58.3%) than among controls (8.7%). Also, around 13% of the control drivers were drug positive, and 20% of the crash drivers were drug positive. From the contents of Table 4, crude (unadjusted) ORs for drug-positive (OR = 1.66, 95% CI [1.42, 1.94]) and alcohol-positive (OR = 14.67, 95% CI [12.60, 17.08]) drivers were calculated, and both were statistically significant. Of interest, the crude OR for alcohol-positive (OR = 14.7) drivers was about 9 times higher than that for drug-positive (OR =1.7) drivers.
Table 4.
Blood alcohol concentration and drug results for fatally injured drivers from 2006 to 2008 U.S. Fatality Analysis Reporting System (FARS) and drivers from 2007 National Roadside Survey (NRS)
| Drugs | ||||||
| 2007 NRS |
2006-2008 FARS |
|||||
| Blood alcohol concentration | - | + | Overall | - | + | Overall |
| Negative (-), | 80.3 | 11.0 | 91.3 | 34.9 | 6.8 | 41.7 |
| Positive (+), % | 6.8 | 1.9 | 8.7 | 45.4 | 12.9 | 58.3 |
| %Overall, % | 87.1 | 12.9 | 100.0 | 80.3 | 19.7 | 100.0 |
| Sample size, n | 3,424 | 1,766 | ||||
Notes: A “positive” drug result indicates the presence of any drug.
We conducted a separate analysis of the RR for drugs other than alcohol for sober drivers. There are 3,126 sober (BAC = .00%) drivers in the control database and 737 sober drivers in the FARS database. Table 5 shows the results from the analyses for sober (BAC = .00%) drivers and for all drivers in the file. Models 1 and 2 in Table 5 differ only on the way they treat the “drug-positive” variable, which appears as a sole variable in Model 1 but is partitioned into marijuana and drugs other than marijuana in Model 2. In Model 1, after adjusting for drivers' demographics, being drug positive was found to be a significant contributor to fatal crash risk among all drivers, as well as only on those at BAC = .00%. In Model 2, the presence of drugs other than marijuana was found to be associated with an increase in fatal crash risk regardless of the driver's BAC. The presence of marijuana, however, did not contribute to fatal crash risk. Except for a BAC × Age interaction, no significant dual interaction was found in any model. Not shown in Table 5 is the impact of including the time of day in the models. As expected, when included in the analysis, the main effect of the time of day was significant in all models (p < .0001), indicating that most fatal crashes occurred at night. The estimated variance of the random intercepts (σ2) was small in each of the models under study, suggesting a small clustering effect of state.
Table 5.
Demographic and drug use characteristics associated with fatal crashes, 2006—2008
| Sober (BAC = .00%) drivers |
All drivers (any BAC) |
|||
| Model 1a (positive for any drug) | Model 2a (marijuana + drugs other than marijuana) | Model 1a (positive for any drug) | Model 2a (marijuana + drugs other than marijuana) | |
| Effect | Coefficient (SE) | Coefficient (SE) | Coefficient (SE) | Coefficient (SE) |
| Intercept | -2.574 (0.254) | -2.554 (0.245) | -2.589 (0.253) | -2.572 (0.244) |
| Gender (ref. = male) | ||||
| Female | -0.155 (0.097) | -0.178(0.097) | -0.423 (0.175) | -0.428 (0.175) |
| Age (ref. = 21—34 years) | ||||
| 16-20 years | 1.101 (0.145) | 1.117 (0.146) | 1.162 (0.162) | 1.192 (0.163) |
| ≥35 years | 0.786 (0.117) | 0.755 (0.118) | 0.598 (0.133) | 0.574 (0.133) |
| Race/ethnicity (ref. = Hispanic) | ||||
| Black, non-Hispanic | -0.255 (0.2) | -0.238 (0.201) | -0.092 (0.176) | -0.077 (0.177) |
| White, non-Hispanic | 0.712 (0.143) | 0.71 (0.144) | 0.854 (0.131) | 0.850 (0.132) |
| Other | -0.876 (0.257) | -0.876 (0.257) | -0.802 (0.232) | -0.802 (0.232) |
| BrACb | 0.031 (0.002) | 0.031 (0.002) | ||
| Drug (I) (ref. = negative) | ||||
| Drug positive | 0.347 (0.132) | 0.286 (0.117) | ||
| Drug (II) (ref.= negative) | ||||
| Positive for marijuana | -0.087 (0.217) | -0.147(0.181) | ||
| Positive for drugs other than marijuana | 0.617 (0.16) | 0.589 (0.145) | ||
| σ2 | 0.358(0.192) | 0.316(0.162) | 0.365 (0.193) | 0.324(0.162) |
| BrAC × Age | ||||
| BAC, 16-20 | - | - | 0.006 (0.006) | 0.007 (0.006) |
| BAC, ≥35 | - | - | -0.006 (0.002) | -0.007 (0.002) |
Notes: Total number of drivers with nonmissing demographic, drug, and BAC information: n = 4,807. BAC = blood alcohol concentration; ref. = reference; BrAC = breath alcohol concentration.
Models 1 and 2 only differ on how the drug variable is built: two levels in Model 1 (positive for any drug, drug negative) and three levels in Model 2 (positive for marijuana, positive for drugs other than marijuana, and drug negative);
BrAC is the rescaled BAC: BrAC = BAC × 1,000. Coefficient and SE denote the estimated coefficient and its standard error, respectively. Coefficients marked in bold are significant (5%). σ2 denotes the estimated variance of the random effect (i.e., state).
The corresponding ORs are provided in Table 6. For drug-positive and sober (BAC = .00%) drivers (Model 1), the odds of being involved in a crash were 1.41 times higher than those for drug-negative drivers (statistically significant: 95% CI [1.09, 1.83]). When all drivers were considered, the OR for drug-positive drivers (OR = 1.33, 95% CI [1.06, 1.67]) did not differ statistically from that of sober drivers, a result that relates to the lack of significance of the Drug × BAC interaction reported in Table 5. When the drug-positive variable is partitioned into positive for marijuana and positive for drugs other than marijuana (Model 2), only drivers positive for drugs other than marijuana had the odds of being involved in a fatal crash significantly different from one, being almost twice that of drug-negative drivers, irrespective of the drivers' BACs.
Table 6.
Drugs and blood alcohol concentrations (BACs): Odds ratio (95% confidence interval) estimated for fatally injured drivers
| Drugsa | Sober drivers (BAC = .00%) (Table 5) | All drivers (BAC = .00% and BAC > .00%) (Table 6) | ||
| Model 1 | ||||
| Positive for any drug | 1.41 [1.09, 1.83] | 1.33 [1.06, 1.67] | ||
| Model 2 | ||||
| Positive for marijuana | 0.92 [0.60, 1.40] | 0.86 [0.61, 1.23] | ||
| Positive for drugs other than marijuana | 1.85 [1.35,2.54] | 1.80 [1.36,2.39] | ||
| Age | ||||
| BACb | 16-20 | 21-34 | ≥35 | |
| Model 1 | ||||
| .01% | – | 1.45 [1.30, 1.62] | 1.37 [1.32, 2.41] | 1.29 [1 24, 1.33] |
| .05% | – | 6.45 [3.75, 11.09] | 4.77 [4.08, 5.95] | 3.52 [2.94, 4.21] |
| .08% | – | 19.72 [8.28, 46.96] | 12.20 [9.47, 15.72] | 7.48 [5.62, 9.96] |
Odds ratios relative to drug negative drivers. Odds ratios for drugs are estimated from coefficients shown in Table 5 (sober drivers only) and Table 6 (all drivers). As shown in Tables 5 and 6, Models 1 and 2 differ only on how the drug variable is built: two levels in Model 1 (positive for any drug, drug negative) and three levels in Model 2 (positive for marijuana, positive for drugs other than marijuana, and drug negative).
Odds ratios for BAC are obtained only from coefficients in Table 6. Odds ratios at given BAC values are estimated relative to sober (BAC = .00%) drivers ages 21-34. Because odds ratios based on either Model 1 or Model 2 were very similar, only those based in Model 1 are shown.
Regarding alcohol, the significance of the BAC × Age interaction (Table 5) makes the ORs vary not only by BAC level but also by age. As expected, crash risk increases with BAC and decreases with age. The ORs for a 16- to 20-year-old driver at BAC = .01%, .05%, and .08% were 1.45, 6.45, and 19.72, respectively. Thus, the crash risk for a 16- to 20-year-old driver at BAC = .08% is about 14 times higher than at BAC = .01%. For drivers ages 21-34 and 35 and older, the crash risk at BAC = .08% is about nine times and six times higher than at BAC = .01%, respectively. This finding reproduces once more evidence of the deleterious impact of alcohol on drivers, particularly among the youngest ones.
Of interest is the comparison between the ORs for drug-positive and alcohol-positive drivers. The ORs associated with drivers at BAC = .05% or BAC = .08% are significantly higher than for drug-positive drivers, either those positive for marijuana (nonsignificant OR) or for drugs other than marijuana. For drivers ages 16-20, the crash risk at BAC = .05% and BAC = .08% is about 4 and 11 times higher, respectively, than that for being positive for drugs other than marijuana. For drivers age 35 and older, these differences are reduced to about 3 and 7 times higher, albeit they remain statistically significant. Compared with the risk at BAC = .01%, however, drivers positive for drugs other than marijuana had significantly higher crash risk.
Discussion
One outcome from this study is that it confirms earlier reports that both alcohol and other drugs do contribute to crash risk. This finding was not surprising given the abundance of previous evidence pointing in that direction (Bern-hoft, 2011; Hargutt et al., 2011; Romano and Pollini, 2013; Romano and Voas, 2011). Although drugs other than alcohol do contribute to crash risk, we found that such a contribution depends on the type of drug under consideration. Somewhat unexpected was the finding that although marijuana's crude OR indicated a significant contribution to fatal crash risk, once it was adjusted by the presence of alcohol and drivers' demographics, marijuana's OR was no longer significant among either sober or drinking drivers. This finding is somewhat surprising because, as reviewed by Sewell et al. (2009), most experimental and epidemiological studies (e.g., the DRUID project [Bernhoft, 2011; Hargutt et al., 2011]) have reported at least a modest impairing effect of marijuana on driving. Citing MacDonald and colleagues (2008), Sewell et al. (2009) argue that a possible explanation for such a modest outcome is that, unlike alcohol drinkers, marijuana users tend to overestimate their level of impairment, which could induce them to apply compensatory strategies that would make them drive more cautiously. However, our results showing no increase in relative risk for a fatal crash associated with marijuana should be interpreted with caution. It is impossible to determine the time of marijuana use relative to the crash in the FARS database, and the contribution of Δ9-tetrahydrocannabinol (THC) to crash risk may become significant only among recent users (Ramaekers et al., 2004). Also, we used any measured presence of marijuana in the FARS, but only medium or high concentrations affect driving (Ménétrey et al., 2005). Furthermore, the excessive delays in the collection of some biological samples in the FARS file may have reduced the number of marijuana-positive results and diluted the contribution of marijuana to fatal crash risk.
Another important outcome from this study is that the contribution of alcohol to crash risk is much larger than that by other drugs. This finding is consistent with the reports by the DRUID project in Europe (Bernhoft, 2011; Hargutt et al., 2011), as well as by studies using the FARS database in the United States (Romano and Pollini, 2013; Romano and Voas, 2011). This finding, coupled with a recent report indicating that 25% of drivers with positive BACs were also using an illegal drug (Voas et al. 2012), suggests the significance of maintaining the intensity of current impaired-driving programs, which are primarily oriented to apprehending drinking drivers (Compton et al., 2009). They offer the opportunity not only to apprehend the highest risk drivers but also to identify and intervene with a substantial number of drug-using drivers. Furthermore, our finding that the risk of involvement in a fatal crash at a BAC of .05% is significantly higher than that for being positive for drugs other than alcohol emphasizes the soundness of proposals suggesting the need to reduce current BAC driving legal limits from a BAC of .08% to a BAC of .05% (e.g., Fell and Voas, 2006).
Relevant to extant and proposed alcohol policies is our finding of no statistical interaction between drugs and alcohol in determining the crash risk. A finding was based on RR associated with being drug positive being statistically similar for sober (BAC = .00%) drivers and drivers with positive BACs. This finding provides reassurance of the validity of past BAC RR estimates (Blomberg et al., 2009; Borkenstein et al., 1974; Zador et al., 2000). Those estimates were crucial to the passing of current per se laws, and our study shows that they were not affected by the failure to include drug data in their analyses. The much higher crash risk of alcohol compared with that of other drugs suggests that in times of limited resources, efforts to curb drugged driving should not reduce our efforts to pass and implement effective alcohol-related laws and policies.
As briefly illustrated in the preceding paragraph, perhaps the main limitation of this report resides in the intrinsic complexity of the drugged-driving problem and the near impossibility of capturing it fully. Parent drugs and metabolites vary in their impairing effect depending, among other factors, on their concentration, mechanism of consumption, time since consumption, and individual genotypic and phenotypic characteristics. Such complexity is further exacerbated by variations in the drug-test procedures and standards applied by each state in the FARS database. No publicly available documentation provides comprehensive information on how the drug tests are performed or on which drugs are tested by each of the 50 states. Relevant to this discussion is that it also is reasonable to argue that the contribution of drugs other than alcohol to crash risk differs depending on the severity (and therefore type) of crash. Therefore, some of the findings reported in this effort may not be reproduced if examined on nonfatal crashes. These limitations, which have hampered previous research efforts using actual traffic data, are also present in this study. Relying on only those states that have consistently tested 80% or more of their fatally injured drivers allowed us to minimize the variability in drug information in the FARS. The inclusion of “state” as a random variable in our models has permitted us to further control for state-based variations in laboratory results.
Despite these shortcomings, the findings of this study coincide with a growing body of evidence indicating that the contribution of alcohol to crash risk surpasses that of other drugs (Bernhoft, 2011; Hels et al., 2011; Kuypers et al., 2012; Romano and Pollini, 2013; Romano and Voas, 2011). Alcohol was not only found to be an important contributor to fatal crash risk, but also in keeping with prior research, it was associated with fatal crash risk levels significantly higher than those for other drugs.
As noted, this study is the first to use actual traffic data in conjunction with FARS data to estimate the joint contribution of alcohol and other drugs to fatal crash risk in the United States. As such, the findings of this effort are timely and important. By developing information on the relative contribution of alcohol and other drugs to fatal crash risk, this article contributes to the database available to policy makers concerned with the control of drugged driving. One of the most significant pieces of information coming from this article is perhaps the need for future crash studies to focus on individual drugs (or drug classes) rather than treating all drugs as one. Because of the small percentage of any single drug other than marijuana in the NRS data set, grouping was necessary in this study to provide the power to estimate reliable RRs. However, such a grouping may attribute too much risk to medications necessary for safe driving while clouding the importance of individual drugs with potential serious effects. Thus, the findings of this effort suggest the need to search out larger or more specific databases that would allow us to shift our research focus from a broad treatment of all drugs to more targeted studies.
Footnotes
This research was supported by National Institute on Alcohol Abuse and Alcoholism Grants R21 AA018158 and R01 AA018352-02.
References
- Agresti A. 2nd ed. Hoboken, NJ: John Wiley & Sons; 2002. Categorical data analysis. [Google Scholar]
- Asbridge M, Hayden JA, Cartwright JL. Acute cannabis consumption and motor vehicle collision risk: Systematic review of observational studies and meta-analysis. BMJ. 2012;344:e536. doi: 10.1136/bmj.e536. [DOI] [PMC free article] [PubMed] [Google Scholar]
- Berghaus G, Sticht G, Grellner W, Lenz D, Naumann T, Wiesen-müller S. DRUID (Driving Under the Influence of Drugs, Alcohol and Medicines) Deliverable 1.1.2b. Bergisch-Gladbach, Germany: Federal Highway Research Institute; 2010. Meta-analysis of empirical studies concerning the effects of medicines and illegal drugs including pharmacokinetics on safe driving. Retrieved from http://www.druid-project.eu/cln_031/nn_107548/Druid/EN/deliverales-list/downloads/Deliverable_1_1_2_B,templateId=raw,property=publicationFile.pdf/ Deliverable__1__1__2__B.pdf. [Google Scholar]
- Bernhoft IM. DRUID (Driving Under the Influence of Drugs, Alcohol and Medicines) Deliverable 2.4.1. Bergisch-Gladbach, Germany: Federal Highway Research Institute; 2011. Results from epidemiological research—prevalence, risk and characteristics of impaired drivers. Retrieved from http://www.druid-project.eu/cln_031/nn_107548/Druid/EN/deliverales-list/downloads/Deliverable__2__4__1,templateId=raw,p roperty=publicationFile.pdf/Deliverable_2_4_1.pdf. [Google Scholar]
- Blomberg RD, Peck RC, Moskowitz H, Burns M, Fiorentino D. The Long Beach/Fort Lauderdale relative risk study. Journal of Safety Research. 2009;40:285–292. doi: 10.1016/j.jsr.2009.07.002. [DOI] [PubMed] [Google Scholar]
- Borkenstein RF, Crowther RF, Shumate RP, Ziel WB, Zylman R. The role of the drinking driver in traffic accidents: The Grand Rapids Study. Blutalkohol, 11, Supplement. 1974;1:1–132. [Google Scholar]
- Compton R, Vegega M, Smither D. Washington, DC: U.S. Department of Transportation, National Highway Traffic Safety Administration; 2009. Drug-impaired driving: Understanding the problem & ways to reduce it (a report to Congress) (DOT HS 811 268) Retrieved from http://www.nhtsa.gov/staticfiles/nti/pdf/811268.pdf. [Google Scholar]
- Dobbs B. Washington, DC: U.S. Department of Transportation, National Highway Traffic Safety Administration; 2005. Medical conditions and driving: A review of the scientific literature (1960-2000) (DOT HS 809 690) [Google Scholar]
- DuPont RL, Voas RB, Walsh JM, Shea C, Talpins SK, Neil MM. The need for drugged driving per se laws: A commentary. Traffic Injury Prevention. 2012;13:31–42. doi: 10.1080/15389588.2011.632658. [DOI] [PubMed] [Google Scholar]
- Elvik R. Risk of road accident associated with the use of drugs: A systematic review and meta-analysis of evidence from epidemiological studies. Accident Analysis and Prevention. 2012 doi: 10.1016/j.aap.2012.06.017. Advance online publication. Retrieved from http://www.sciencedirect.com/science/article/pii/S0001457512002412. [DOI] [PubMed] [Google Scholar]
- Fell JC, Voas RB. The effectiveness of reducing illegal blood alcohol concentration (BAC) limits for driving: Evidence for lowering the limit to. 05 BAC. Journal of Safety Research. 2006;37:233–243. doi: 10.1016/j.jsr.2005.07.006. [DOI] [PubMed] [Google Scholar]
- Hargutt V, Krüger H-P, Knoche A. DRUID (Driving Under the Influence of Drugs, Alcohol and Medicines) Deliverable 1.3.1. Bergisch-Gladbach, Germany: Federal Highway Research Institute; 2011. Driving under the influence of alcohol, illicit drugs and medicines. Risk estimations from different methodological approaches. Retrieved from http://www.druid-project.eu/cln_031/nn_107548/Druid/EN/deliverales-list/downloads/Deliverable__1__3__1,templateId=raw,property=publicationFile.pdf/Deliverable_1_3_1.pdf. [Google Scholar]
- Hels T, Bernhoft IM, Lyckegaard A, Houwing S, Hagenzieker M, Legrand S-A, Verstraete A. Bergisch-Gladbach, Germany: Federal Highway Research Institute; 2011. Risk of injury by driving with alcohol and other drugs. DRUID (Driving Under the Influence of Drugs, Alcohol and Medicines) Deliverable D2.3.5. Retrieved from http://www.druid-project.eu/cln_031/nn_107548/Druid/EN/deliverales-list/downloads/Deliverable__2__3__5,templateId=raw,property=publicatio nFile.pdf/Deliverable_2_3_5.pdf. [Google Scholar]
- Hingson R, Winter M, Heeren T. Presented at The Tri-Annual Meeting of the International Conference on Alcohol. Oslo, Norway: Drugs and Traffic Safety; 2010. August). Alcohol and drug use in fatally injured drivers in states that test over 80% for both alcohol and drugs. [Google Scholar]
- Kelly E, Darke S, Ross J. A review of drug use and driving: Epidemiology, impairment, risk factors and risk perceptions. Drug and Alcohol Review. 2004;23:319–344. doi: 10.1080/09595230412331289482. [DOI] [PubMed] [Google Scholar]
- Kuypers KP, Legrand SA, Ramaekers JG, Verstraete AG. A case-control study estimating accident risk for alcohol, medicines and illegal drugs. PLoS ONE. 2012;7(8):e43496. doi: 10.1371/journal.pone.0043496. [DOI] [PMC free article] [PubMed] [Google Scholar]
- Lacey JH, Kelley-Baker T, Furr-Holden D, Voas R, Moore C, Brain-ard K, Berning A. Washington, DC: U.S. Department of Transportation, National Highway Traffic Safety Administration; 2009. 2007 National Roadside Survey of Alcohol and Drug Use by Drivers: Methodology (Report No. DOT HS 811 237) Retrieved from http://www.nhtsa.gov/Driving+Safety/Research+&+Evaluation/2007+National+Roadside+Survey+of+Alcohol+and+Drug+Use+by+Drivers. [Google Scholar]
- MacDonald S, Mann R, Chipman M, Pakula B, Erickson P, Hathaway A, MacIntyre P. Driving behavior under the influence of cannabis or cocaine. Traffic Injury Prevention. 2008;9:190–194. doi: 10.1080/15389580802040295. [DOI] [PubMed] [Google Scholar]
- Ménétrey A, Augsburger M, Favrat B, Pin MA, Rothuizen LE, Ap-penzeller M, Giroud C. Assessment of driving capability through the use of clinical and psychomotor tests in relation to blood cannabinoids levels following oral administration of 20 mg dronabinol or of a cannabis decoction made with 20 or 60 mg Delta9-THC. Journal of Analytical Toxicology. 2005;29:327–338. doi: 10.1093/jat/29.5.327. [DOI] [PubMed] [Google Scholar]
- Moskowitz H, Wilkinson CJ. Washington, DC: U.S. Department of Transportation, National Highway Traffic Safety Administration; 2004. Antihistamines and driving-related behavior: A review of the evidence of impairment (DOT HS 809 714) [Google Scholar]
- National Highway Traffic and Safety Administration. Washington, DC: Author; 2010. Traffic Safety Facts: Drug involvement of fatally injured drivers (DOT HS 811 415) Retrieved from http://www-nrd.nhtsa.dot.gov/Pubs/811415.pdf. [Google Scholar]
- Ramaekers JG, Berghaus G, van Laar M, Drummer OH. Dose related risk of motor vehicle crashes after cannabis use. Drug and Alcohol Dependence. 2004;73:109–119. doi: 10.1016/j.drugalcdep.2003.10.008. [DOI] [PubMed] [Google Scholar]
- Rapoport MJ, Lanctôt KL, Streiner DL, Bédard M, Vingilis E, Murray B, Herrmann N. Benzodiazepine use and driving: A meta-analysis. Journal of Clinical Psychiatry. 2009;70:663–673. doi: 10.4088/JCP.08m04325. [DOI] [PubMed] [Google Scholar]
- Romano E, Pollini R. Patterns of drug use in fatal crashes. Addiction. 2013;108:1428–1438. doi: 10.1111/add.12180. [DOI] [PMC free article] [PubMed] [Google Scholar]
- Romano E, Voas RB. Drug and alcohol involvement in four types of fatal crashes. Journal of Studies on Alcohol and Drugs. 2011;72:567–576. doi: 10.15288/jsad.2011.72.567. [DOI] [PMC free article] [PubMed] [Google Scholar]
- Sewell RA, Poling J, Sofuoglu M. The effect of cannabis compared with alcohol on driving. American Journal on Addictions. 2009;18:185–193. doi: 10.1080/10550490902786934. [DOI] [PMC free article] [PubMed] [Google Scholar]
- Transport Research Centre and International Transport Forum. Summary document. Leipzig. Germany: OCED Publishing; 2010. Drugs and driving: Detection and deterrence. Retrieved from http://www.internationaltransportforum.org/jtrc/safety/drugs/DrugsSummary.pdf. [Google Scholar]
- Voas RB, Torres P, Romano E, Lacey JH. Alcohol-related risk of driver fatalities: An update using 2007 data. Journal of Studies on Alcohol and Drugs. 2012;73:341–350. doi: 10.15288/jsad.2012.73.341. [DOI] [PMC free article] [PubMed] [Google Scholar]
- Zador PL, Krawchuk SA, Voas RB. Alcohol-related relative risk of driver fatalities and driver involvement in fatal crashes in relation to driver age and gender: An update using 1996 data. Journal of Studies on Alcohol. 2000;61:387–395. doi: 10.15288/jsa.2000.61.387. [DOI] [PubMed] [Google Scholar]