Abstract
In this paper, we present a mobile user interface for image-based dietary assessment. The mobile user interface provides a front end to a client-server image recognition and portion estimation software. In the client-server configuration, the user interactively records a series of food images using a built-in camera on the mobile device. Images are sent from the mobile device to the server, and the calorie content of the meal is estimated. In this paper, we describe and discuss the design and development of our mobile user interface features. We discuss the design concepts, through initial ideas and implementations. For each concept, we discuss qualitative user feedback from participants using the mobile client application. We then discuss future designs, including work on design considerations for the mobile application to allow the user to interactively correct errors in the automatic processing while reducing the user burden associated with classical pen-and-paper dietary records.
Keywords: Mobile user interfaces, User interface design, Mobile devices, Health monitoring tools, Dietary assessment system
1. INTRODUCTION
As smart telephone technology continues to advance in sensor capability and computational efficiency, mobile telephones are being used for purposes other than just dialing and receiving calls. Advances in mobile technology have led to enhanced features, such as built-in cameras, games and texting on phones. Furthermore, researchers have employed mobile technologies in a variety of tools ranging in applications from personal health and wellness to biological research to emergency response [2, 5, 12, 27]. Our research focuses on employing mobile technology for dietary assessment.
Given the mounting concerns of childhood and adult obesity [18, 19], advanced tools for keeping personal dietary records are needed as a means for accurately and effectively monitoring energy and nutrient intakes. Such records provide researchers with information for hypothesis generation and assessment regarding health conditions and nutrient imbalances. In light of these issues, research has focused on a means to utilize mobile technology for dietary assessment (e.g., [9, 13, 20, 25]). Previously, [16] we presented a dietary record assessment system focused on creating a server-client architecture in which the client mobile device was used to capture a pair of images (before and after) of meals and snacks. In our system design, the images are sent to the server where image analysis and volume estimation calculations are performed and the results are returned to nutrition researchers (or dietitians). In this paper, we discuss the design and development of the mobile interface for our client-server system [29]. The development of the mobile user interface of our dietary assessment system has been a collaboration with researchers in the Department of Foods and Nutrition. We intersperse our discussion with lessons learned based on user feedback, providing guidelines for the development of such applications. Compared to our previous papers, this is the first time our mobile application is described in depth. Contributions of this paper include:
Field specific design considerations and strategies: We describe design considerations for our mobile user interface for dietary assessment and development strategies based on user evaluation.
Improved user interface: From the point of view of an integrated system, we present details of the data that is created in the mobile application and describe the communication protocol between the mobile client to the server.
Flexible eating patterns: We extend a previous design for recording food images to support flexible eating patterns such as portion refills so that each eating occasion can include not only a pair but also a series of food images.
Minimal data exposure and user interaction: Through filtering eating occasions, we display only some of the images containing information that needs user confirmation. Such a process is used to minimize user interaction, thus reducing system burden
This paper is organized as follows: Section 2 discusses the related research. Section 3 presents our image-based mobile dietary assessment system and the design considerations of a mobile user interface. Section 4 presents the framework and functionality of our mobile dietary assessment tools. Finally, Section 6 presents conclusions and discussion.
2. RELATED WORK
Many systems incorporating mobile devices (e.g., PDAs, cell phones) for data collection and management, have been proposed in various fields [6, 11, 13, 26, 27]. Denning et al. [8] proposed a wellness management system using mobile phones and a mobile sensing platform unit. In this system, users manually input food consumption information with a mobile telephone. The mobile sensing unit computes the user’s energy expenditure and transfers this data to the mobile telephone. Arsand et al. [3, 4] studied how to design easily usable mobile self-monitoring tools for diabetes.
Other dietary assessment systems also make use of mobile phones. Wang et al. [25] describes the evaluation of personal dietary intake using mobile devices with a camera. Users took food images and sent them to dietitians by a mobile telephone. Reddy et al. [22] introduced the Diet-Sense architecture that consists of mobile phones, a data repository, data analysis tools, and data collection protocol management tools. Mobile phones with a GPS receiver were used to capture food images as well as relevant context, such as audio, time and location. The food images were collected into a data repository to be analyzed by dietitians. Donald et al. [9] discussed the effect of mobile phones in dietary assessment by performing a user study with adolescent patients with diabetes. In their work, users were asked to complete food diaries and to capture images of all food and drink by using mobile phones. Then, food images were downloaded to a computer and a dietitian estimated portion sizes from the diaries and images.
In first developing our mobile user interface, we looked at research which focused on general guidelines and requirements for mobile interface design. Nilsson [17] presented user interface patterns for mobile applications and discussed a series of challenges regarding user interface design on mobile devices and design patterns. [SUNGYE, expand on what the challenges were] Tarasewich et al. [24] discussed design requirements for mobile user interfaces compared to those for the desktop environment and proposed 17 guidelines for mobile interface design. [SungYe, give a few examples of these guidelines] Chong et al. [7] focused on designing a touch screen based user interface. In this work, they proposed several key guidelines influencing a good user interface including; simplicity, aesthetics, productivity, and customizability.
We also examined research [3, 4, 14] focusing specifically on design concepts for self-health monitoring tools utilizing the capability of mobile devices. Designing field specific interfaces requires careful consideration and even field back-ground knowledge [15]. Based on our initial system prototype and user feedback, we adopted design concepts proposed by Arsand et al. [?, Arsand2008] Our system design was done in conjunction with interactive feedback from nutrition researchers. Our system was developed to provide researchers with an automated analysis for the estimation of daily food intake.. The dietary assessment tool uses a built-in camera on a mobile telephone to capture food images, and the user interactions of taking meal images and verifying the assessment demands careful design considerations in terms of usability and flexibility in order to reflect various situations in daily life. Specifically, we incorporate an automatic data transfer scheme (hiding the data transfer paradigm from the users) and an easy data entry scheme through the use of the mobile telephone camera.
3. SYSTEM DESIGN
The focus of our dietary assessment system is to better capture meal patterns of users using automated food and portion analysis. Our dietary assessment system utilizes a server-client configuration.
3.1 System Overview
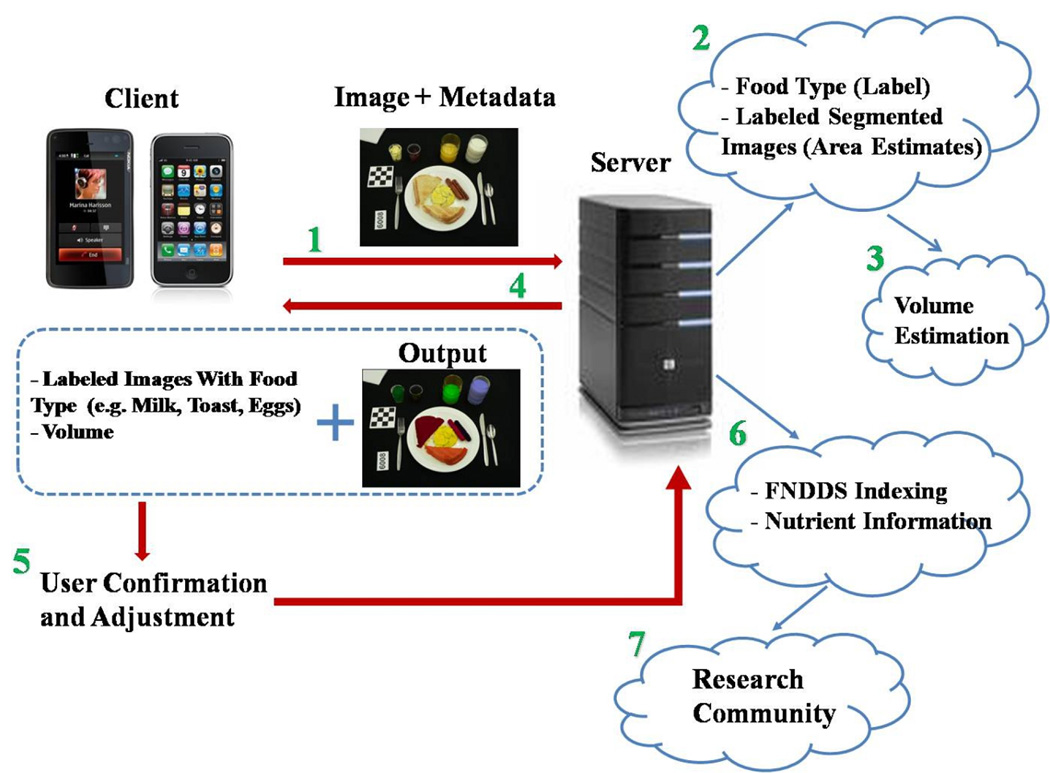
In the record method, food images are captured using a built-in camera on a mobile device and the corresponding management data for food images is generated. The captured food images are transferred to a server for analysis where the various types of food in the images are identified and the portion sizes (volumes) of food are estimated to compute the amount of food consumed by the user. This analysis part is broken into two sub parts; food identification [29] and volume estimation [28]. These results (food type and volume) are returned to the user for review. In the review method, the user confirms or adjusts the results produced in the server. Figure 1 shows the overview of our image-based dietary assessment system. Additionally, an alternate method is considered for cases where the user cannot capture food images.
Figure 1.
Overview of an image-based dietary assessment system in a server-client architecture.
The record and review methods and the alternate method are deployed on client mobile phones. The analysis components run on the server to minimize the burden of computation on the mobile telephone. This paper focuses on the client side of the system and we present the design and development of the mobile user interfaces for an image-based dietary assessment system. For details of the analysis components, see Zhu et al. [29] and Woo et al. [28].
3.2 Design Considerations for Mobile Dietary Assessment Tools
Based on design discussions with our nutrition research partners and analysis of various eating patterns in real life, we derived several design considerations for our mobile dietary assessment tools.
Easy and fast collection of daily food images: Capturing food images by using a mobile telephone with a builtin camera provides users with easier, faster and potentially a more accurate ways to record meals in comparison to methods of remembering or noting what they ate [] [SUNGYE, reference to written record system]. Thus, we chose to utilize the built-in cameras on mobile phones as a data collection tool.
Minimum user interaction: Since users of a dietary assessment system are as various as users of mobile phones, we need to consider a wide range of users from adolescents to senior citizens. Hence, the user interface should be easy to use and the interaction needed to record or review eating occasions should be minimal.
Flexible eating patterns: The system should be flexible enough so that various eating patterns in real life, such as multiple eating occasions per day and the addition of foods during an eating occasion, can be collected and managed in the system.
Protection of personal data: Users’ food images and additional private data should be kept private. Hence, food images on the mobile telephone should be hidden from other people.
Automatic data processing: A server-client architecture reduces the burden of analysis and computation on the mobile telephone and increases the overall system performance. While employing this, the data transfer between a mobile telephone and a server should be hidden from the users. Moreover, users do not need to know details of server processing.
Exceptional situations: Additional methods should provide users with tools to manually save or modify eating occasions. For instance, in cases that users cannot capture food images due to situational or environmental conditions, users should be able to create their eating occasion data without food images. Moreover, if the results from the analysis components contain errors, users should also be able to correct them and update the server.
4. MOBILE USER INTERFACE FOR IMAGE-BASED DIETARY ASSESSMENT SYSTEM
Based on the design considerations in Section 3.2, we describe the framework of our mobile dietary assessment tool. In this section, we describe our system tools and implementations. Furthermore, we discuss lessons learned and present qualitative user feedback on each of the deployed components. User studies have included 117 adolescents (10–18 years) and 57 adults (21–65 years).
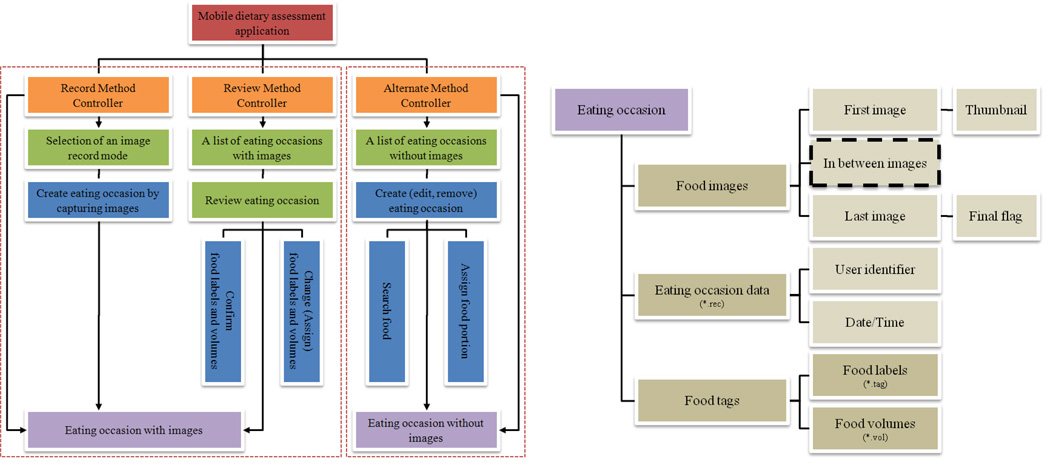
Figure 2 shows the framework for our mobile interface and the basic structure of an eating occasion. As shown in Figure 2 (left), our mobile tool includes three main methods; the record, review and alternate method. The record and review methods share eating occasion data with food images, whereas the alternate method supports users in creating eating occasions even when they cannot capture food images. Each eating occasion may contain several food images, eating occasion data created by the record method, and food tags including food labels as shown in Figure 2 (right).
Figure 2.
(Left) the framework of our mobile dietary assessment tool and (right) an eating occasion structure consisting of a series of food images, eating occasion data and food tags. The framework is broken into two tracks; one uses eating occasions with food images and the other deals with eating occasions without food images. Each food tag includes food labels and volumes. Note the dashed structure in the eating occasion diagram. This was part of our initial concept framework and was later removed based on user feedback. Please see Section 4.1 for a detailed discussion of the design concept and lessons learned.
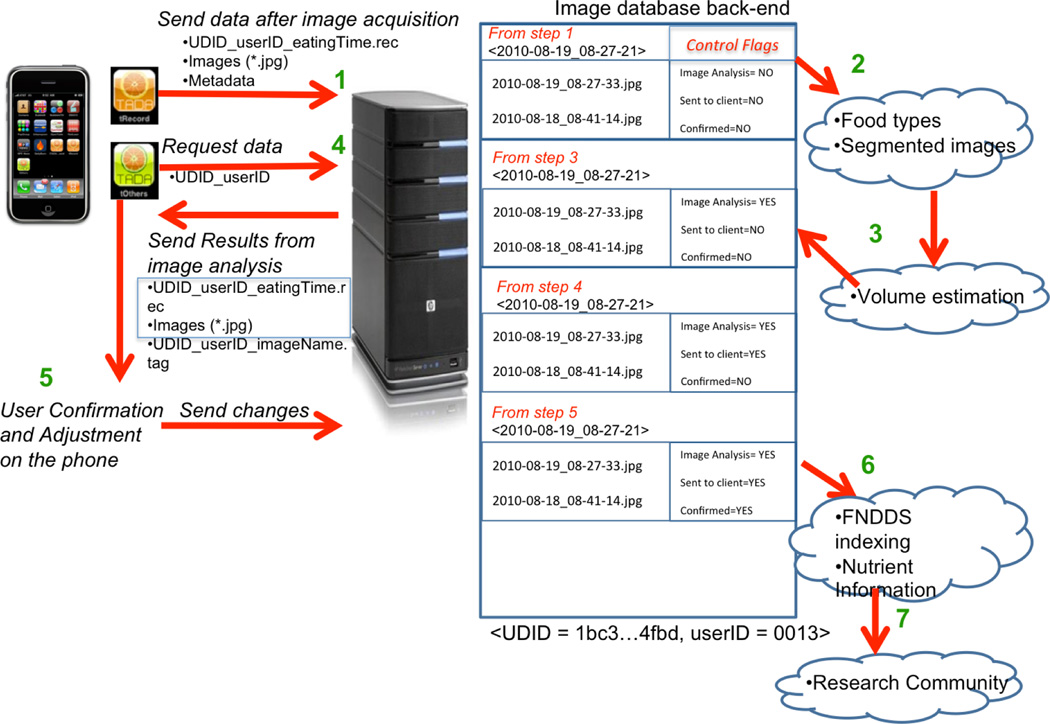
Due to earlier programming constraints with iPhone OS 3.0 application development, we separated the record and review methods into two different applications. Eating occasion data is created in the record method in one application and transferred to the server. The review method in the other application receives the eating occasion data from the server after completing the analysis on the server. User feedback indicated that such a separation was sub-optimal. Fortunately, the new OS 4.0 version will allow us to combine the two different applications into one master application. Figure 3 shows a diagram for data communication between the server and the separated two record and review applications and an example database on the server. In the following sections, we present the detailed functionality, development, lessons learned and user feedback of each method for our mobile dietary assessment.
Figure 3.
Data communication between a server and mobile applications (record and review) based on Figure 1. In this figure, step 5 occurs from users’ interaction, and the other steps are automatically processed. On the right side, an example database on the server is presented.
4.1 Recording the Eating Occasion
By utilizing the record method, the user captures food images with the built-in camera on the mobile device. While recording food images, the eating occasion data for the food images (*.rec) (see Figure 2 (right)) is generated for each eating occasion containing the device ID, user ID, date/time and file names of all food images. The date and time represent when the first image was captured. All food images and eating occasion data are transferred to the server (step 1 in Figure 3). The guide lines denoting the tope and bottom of the image, superimposed on the camera view were key to helping users fit foods into the screen. More importantly, the top and bottom notation insured correct orientation. Prior to implementing this feature, images were captured in a variety of orientations, confounding image segmentation and volume estimation.
Handling various eating patterns
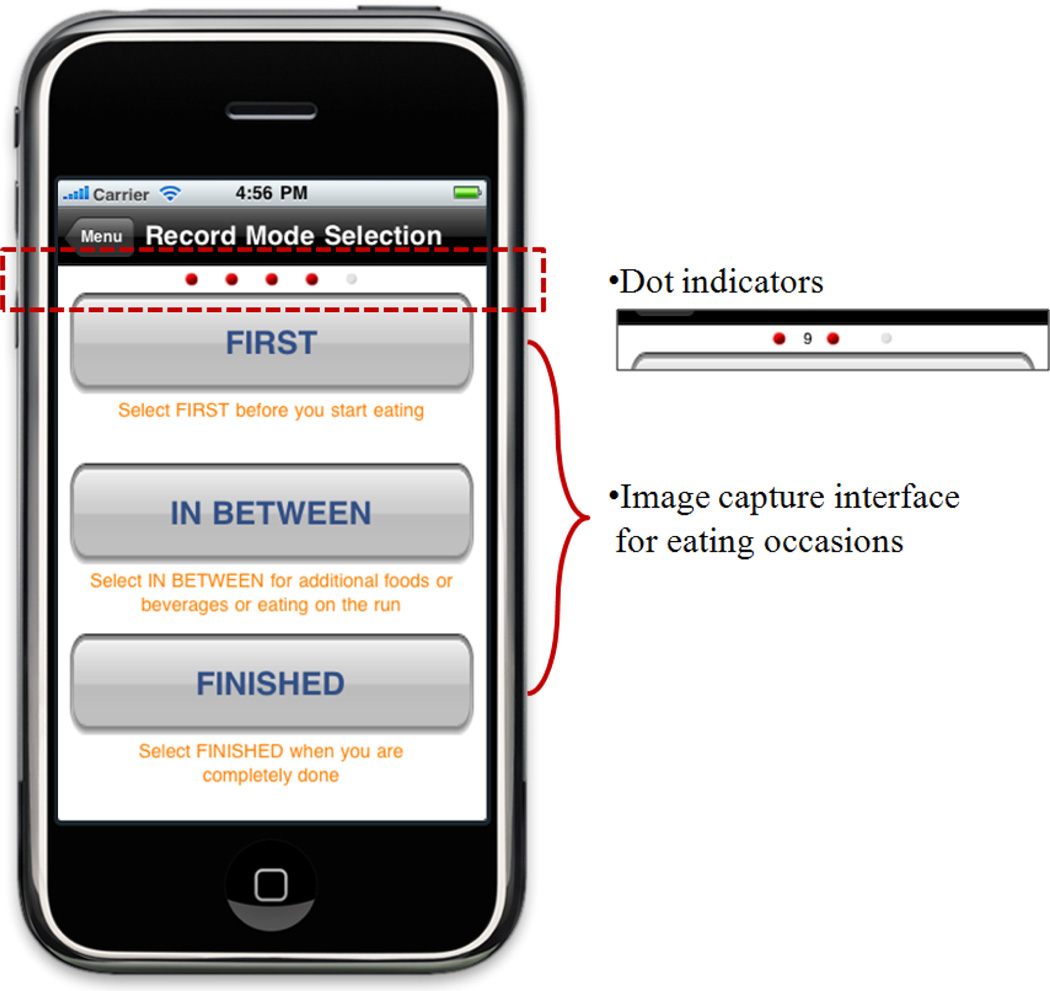
To record and manage multiple helpings (portion refills), we allowed users to capture a series of images for a given eating occasion. Each image in the sequence was a before or after image except for the first image (which can only be a before image) and the last image (which can only be an after image). All these images were then saved in the order of their capture time to reflect the time progression of the eating occasion. Figure 4 shows the food image recording interface that was composed of three buttons. Capturing the first image created a new eating occasion and capturing the last image sent the current eating occasion to the server for analysis.
Figure 4.
User interface for the record method. The dot indicators are used to remind users of which image has been taken. In this figure, four red dots indicate that the first image and three in between images have been taken. When ten images are taken (the first image and nine in between images), the number of in between images is displayed on the side of a dot as shown in the right image. The rightmost grey dot among the dots shows that the last image has yet to be taken.
To implement this concept, we included three buttons: First, In-Between, Last (Figure 2 - Right). Adolescent users found the In-Between button to be confusing. Many users interperted it to mean they should take an image mid-way through their meals. Therefore, the button was disabled and a series of First/Last images were used to accomodate portion refills and multiple courses. This sequencing was well received.
Recommendations for training and recording
The user interface development and available technology can provide many solutions to aid in the automated analysis. However, some issues must be addressed through user training. Suggestions to the users for improved training and recording include:
Full image acquisition: Foods should be captured large enough and around the center area in the images so that they can easily be recognized during analysis.
Highlight and shadow condition: Highlights and shadows hinder the automatic analysis by making the recognition of food areas difficult.
Spatial consistency: When several foods exist in the images, keeping them at the same position helps the analysis part to automatically recognize foods in different images of the same meal equation.
Camera setup: Significant perspective distortion can occur in the image according to the distance and the angle of view. We experimentally found angles between 30~45 ° to be satisfactory.
4.2 Reviewing the Eating Occasion
After recording eating occasions, the users review the analyzed results from the server to either confirm or change food types (food names) and volumes (the amount of intake for each food). As shown in Figure 1, the analysis is automatically decided by the food identification and saved into food label data (*.tag), and the food volume is algorithmically estimated in the volume estimation and saved into food volume data (*.vol) to be returned to the users. The purpose of this review method is to provide user interfaces on mobile phones for reviewing the data transferred from the server. When the user starts the review method (at a time convenient to him/her), he/she requests the eating occasion data of food images generated in the record method and analysis results to the server (steps 4-1 and 4-2 in Figure 3).
Filtering eating occasions
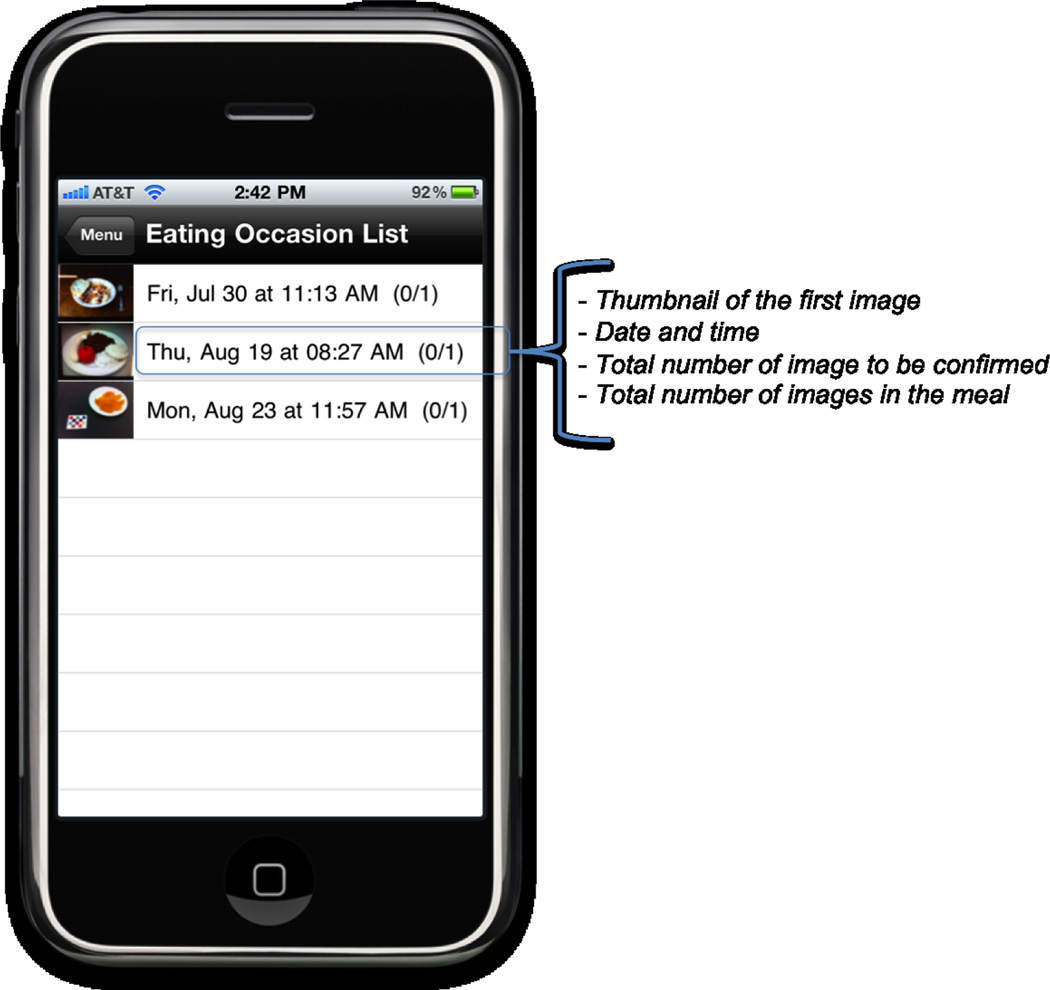
First, a list of eating occasions are displayed so that the users can select one eating occasion to review as shown in Figure 5. At this moment, we delay loading the food images and related context information (i.e., food tag data) on the memory of the mobile device until the user selects one to review among the eating occasions. This lazy loading [10] strategy is applied to all the other methods to reduce the memory consumption on the mobile device. Conceptually, users view images they recorded so that they can review them and make adjustments or corrections as necessary to the foods’ type or volume.
Figure 5.
A list of eating occasions in the review method with a thumbnail, date, time, the number of food images with food tags and the number of confirmed images in each eating occasion.
If the list of eating occasions displayed includes all eating occasions recorded in the record method, it could be extremely long after continuous usage. Although performance issues of handling long lists could be averted with efficient coding of the application, the concern is that the users would have to scroll through the long list of eating occasions in order to look for a specific one. Hence, we filter eating occasions to display on the review method using three strategies:
When all the food tags in an image have been confirmed by the user, the corresponding image should be hidden from the eating occasion.
When all the images in the eating occasion have been confirmed by the user, the corresponding eating occasion is hidden from the user. (The eating occasion is not displayed on the list anymore.)
Eating occasions whose images are yet to be processed by the server are not displayed on the list.
Displaying food tags
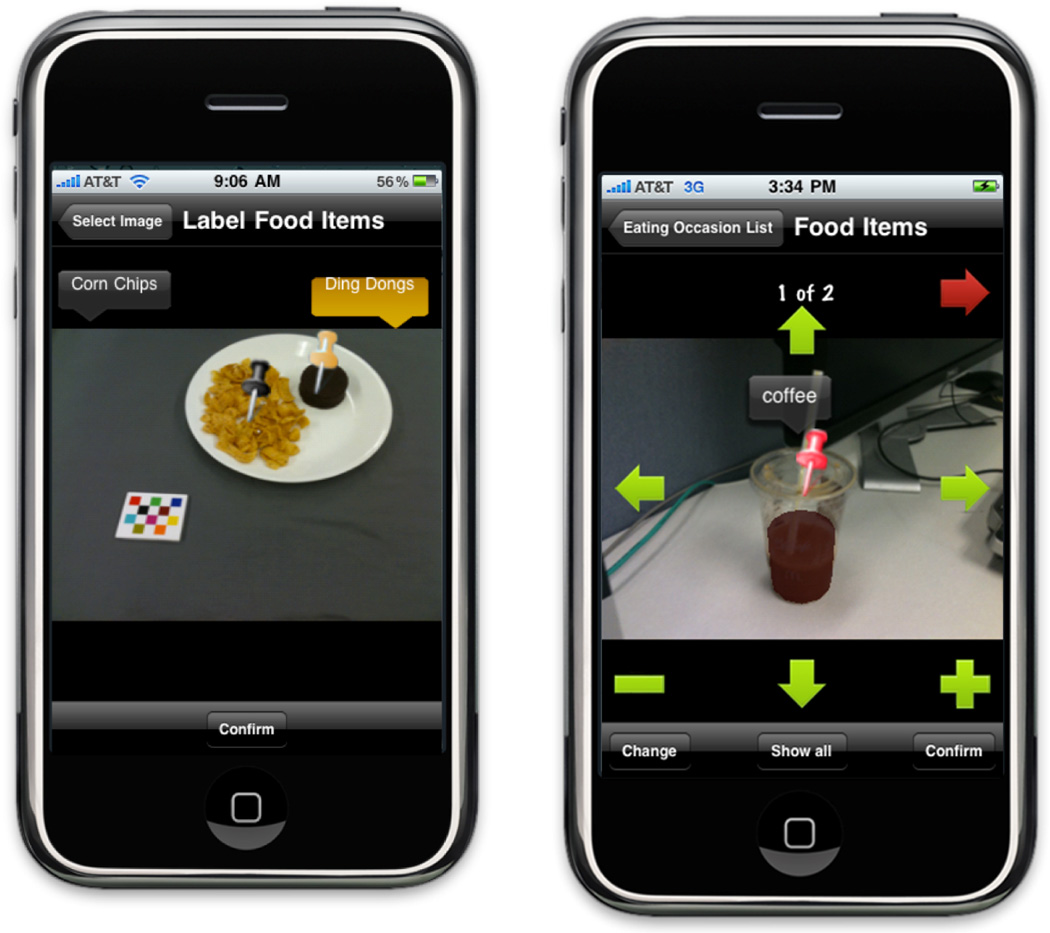
Once the user selects an eating occasion, food images with food tags (food labels) are displayed in order. Figure 6 (left) shows the image with food labels. Each label is transparent to reduce occluding food areas and is matched to the food where the pin icon with the same color is placed. In the case that there are several food labels, the positions of the labels are rearranged to minimize cluttering. Furthermore, we found that approximately 15 characters (maximum) were appropriate for each food label. Initially, the names of 130 common foods were modified and tested among adolescents. After observing that adolescents comprehended these shortened food names, we then modified data labels to create appropriately shortened food names for approximately 7000 entries in the database.
Figure 6.
Displaying food tags. (Left) food labels on an image and (right) a 3D food volume shape. The 3D shape of food volume and corresponding user interfaces for translating (green arrows) and scaling (green minus and plus) are displayed when the user selected a specific food tag.
User confirmation and adjustment
In the case that the analysis results from the server contain errors, we engage the confirmation and adjustment of the food tags by the users (step 5 in Figure 3). The confirmation reports to the server that all food tags in the image are correct and updates the server when food tags are changed (step 5-1 in Figure 3), and the adjustment allows users to locally make changes to food labels and volumes (step 5-2 in Figure 3).
To correct wrong food labels in the food tags, we employ the stemming algorithm [21] for keyword search, simplified for the Food and Nutrient Database for Dietary Studies (FNDDS) 3.0 [1]. Another potential way to search foods is to use a set of predefined keywords. Keywords have been defined with help from our nutrition colleagues, and future versions will utilize an advanced search algorithm based on these keywords.
4.3 Alternate Method
The main concept of our dietary assessment system is to utilize food images recorded by the users during eating occasions. However, it may, at times, be impossible for users to take food images. For instance, the user may not have had his or her mobile telephone or may have forgotten to take food images. To support such situations, we also provide an alternate method that is based on user interaction and a manual food search.
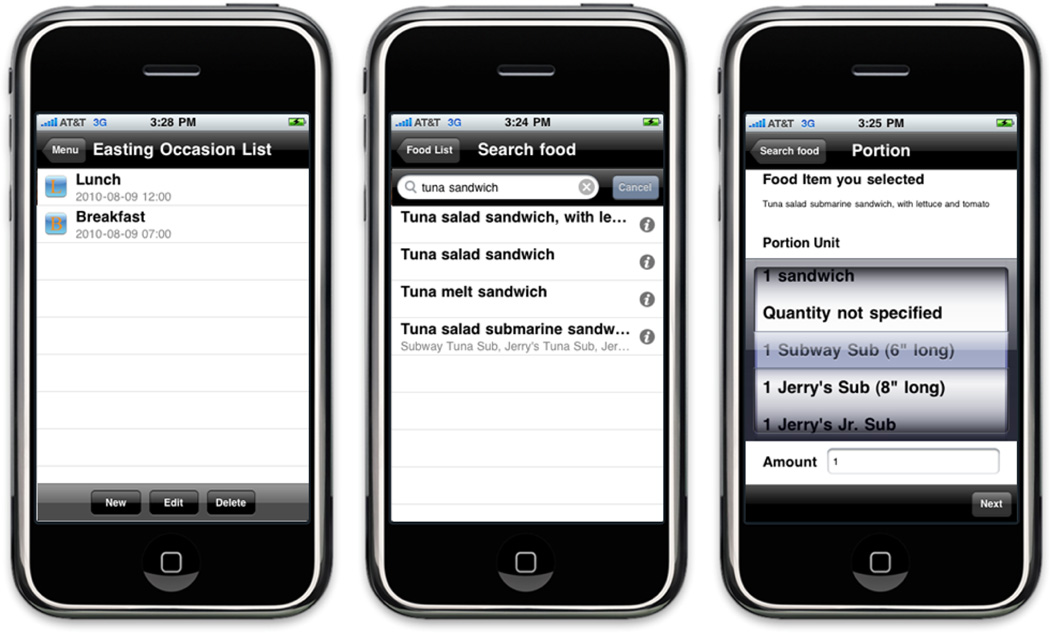
This alternate method is developed as an independent track in the framework of the client side as shown in Figure 2 (left) and provides users with tools for creating eating occasions containing (Figure 7 (left)) enough information for nutrient analysis, including date and time, food name, measure description and the amount of intake. In this method, food names are searched (Figure 7 (middle)) by using the same method employed for the user confirmation in the review method (Figure 7 (right)). The portion units for the amount consumed depends on the food that the user selects. [BOUSHEY, user feedback on alternate method?]
Figure 7.
An alternate method. (Left) a list of eating occasions without food images, (middle) food search results, and (right) the settings of food portion unit and the amount of food consumed.
5. FUTURE IMPLEMENTATION DIRECTIONS
The current user interface design considerations are used to handle capturing meal images and reporting mistakes during the automatic food classification. We have begun work on implementing user controls for also adjusting errors in the volume estimation. Figure ?? shows our prototype user interface to manually create 3D volume shapes on food images. As an initial idea, we are currently proposing a system that will provide primitive template shapes and interactions for translating, rotating and scaling the overlayed volumes..
Figure 6 (right) shows the image with food volume. A 3D shape is superimposed on the food area to provide users with tools to either confirm or adjust the food volumes estimated on the server. User interfaces for translating and scaling the 3D shape are only displayed when the user selected a specific food tag in order to minimize cluttering the screen. We also provides users with user interface to adjust the position and size of food volume shapes. For adjusting the food volumes, the users make use of a transparent 3D shape overlaid onto the food area and user interfaces for translating and scaling it as shown in Figure 6 (right). [SUNGYE, discuss more?]
6. CONCLUSION AND DISCUSSION
We have described the design and development of a mobile user interface for an interactive, image-based dietary assessment system using mobile devices. As a self-monitoring system for dietary assessment, our system uses food images captured using a built-in camera on mobile devices and analyzes them on the server in order to automatically label foods and estimate the amount of food consumed. For flexibility, our system also considers an alternate method based on user interaction and food search instead of food images. Hence, our mobile client system using mobile phones is composed of the record, review and alternate methods.
While designing and developing our mobile user interface, we consulted with researchers in the Department of Foods and Nutrition to collect feedback on the interaction design through several user studies [23]. Based on the feedback, we tailored the user interface of our client mobile system for improving usability as well as system flexibility. To demonstrate, we developed and deployed our client mobile tools on the iPhone 3GS devices running iOS 4.0.
ACKNOWLEDGMENTS
We would like to thank our collaborators and colleagues, Bethany Six and Deb Kerr of the Department of Foods and Nutrition for feedback about mobile user interfaces through user studies, Insoo Woo, JungHoon Chae, Fengqing Zhu of the School of Electrical and Computer Engineering for their work in developing food volume estimation and food image analysis on the server and Ahmad M. Razip of the School of Electrical and Computer Engineering for his help in revising the user interface. Support for this work comes from the National Cancer Institute (1U01CA130784-01) and the National Institute of Diabetes, Digestive, and Kidney Disorders (1R01-DK073711-01A1). More information about our project can be found at www.tadaproject.org.
Contributor Information
SungYe Kim, Email: inside@purdue.edu.
TusaRebecca Schap, Email: tschap@purdue.edu.
Marc Bosch, Email: mboschru@purdue.edu.
Ross Maciejewski, Email: rmacieje@purdue.edu.
Edward J. Delp, Email: ace@purdue.edu.
David S. Ebert, Email: ebertd@purdue.edu.
Carol J. Boushey, Email: boushey@purdue.edu.
REFERENCES
- 1.The Food and Nutrient Database for Dietary Studies. [accessed 10 August 2010]; http://www.ars.usda.gov/services/docs.htm?docid=7673.
- 2.Ahtinen A, Isomursu M, Mukhtar M, Mäntyjärvi J, Häkkilä J, Blom J. Designing social features for mobile and ubiquitous wellness applications. MUM ’09: Proceedings of the 8th International Conference on Mobile and Ubiquitous Multimedia; ACM; 2009; New York, NY, USA. pp. 1–10. [Google Scholar]
- 3.Arsand E, Tufano JT, Ralston JD, Hjortdahl P. Designing mobile dietary management support technologies for people with diabetes. Journal of Telemedicine and Telecare. 2008 Jul;volume 14:329–332. doi: 10.1258/jtt.2008.007001. [DOI] [PubMed] [Google Scholar]
- 4.Arsand E, Varmedal R, Hartvigsen G. Usability of a mobile self-help tool for people with diabetes: the easy health diary; Automation Science and Engineering, 2007. CASE 2007. IEEE International Conference on; 2007. Sept. pp. 863–868. [Google Scholar]
- 5.Baecker O, Ippisch T, Michahelles F, Roth S, Fleisch E. Mobile claims assistance. MUM ’09: Proceedings of the 8th International Conference on Mobile and Ubiquitous Multimedia; ACM; 2009; New York, NY, USA. pp. 1–9. [Google Scholar]
- 6.Baumgart DC. Personal digital assistants in health care: experienced clinicians in the palm of your hand. Lancet. 2005 Oct.volume 366:1210–1222. doi: 10.1016/S0140-6736(05)67484-3. [DOI] [PubMed] [Google Scholar]
- 7.Chong P, So P, Shum P, Li X, Goyal D. Design and implementation of user interface for mobile devices. Consumer Electronics, IEEE Transactions on. 2004 Nov.50(4):1156–1161. [Google Scholar]
- 8.Denning T, Andrew A, Chaudhri R, Hartung C, Lester J, Borriello G, Duncan G. Balance: towards a usable pervasive wellness application with accurate activity inference; HotMobile’09: Proceedings of the 10th workshop on Mobile Computing Systems and Applications; 2009. pp. 1–6. [DOI] [PMC free article] [PubMed] [Google Scholar]
- 9.Donald H, Franklin V, Greene S. The use of mobile phones in dietary assessment in young people with type 1 diabetes. Journal of Human Nutrition and Dietetics. 2009 Jun;volume 22:256–257. [Google Scholar]
- 10.Fowler M. Patterns of Enterprise Application Architecture. Addison-Wesley; 2002. [Google Scholar]
- 11.Gammon D, rsand E, Walseth OA, Andersson N, Jenssen M, Taylor T. Parent-child interaction using a mobile and wireless system for blood glucose monitoring. Journal of Medical Internet Research. 2005 Nov.volume 7:e57. doi: 10.2196/jmir.7.5.e57. [DOI] [PMC free article] [PubMed] [Google Scholar]
- 12.Kim S, Maciejewski R, Ostmo K, Delp EJ, Collins TF, Ebert DS. Mobile analytics for emergency response and training. Information Visualization. 2008;7(1):77–88. [Google Scholar]
- 13.Kretsch MJ, Blanton CA, Baer D, Staples R, Horn WF, Keim NL. Measuring energy expenditure with simple low cost tools. Journal of the American Dietetic Association. 2004 Aug.volume 104:13. [Google Scholar]
- 14.Lee T-H, Kwon H-J, Kim D-J, Hong K-S. Design and implementation of mobile self-care system using voice and facial images. ICOST ’09: Proceedings of the 7th International Conference on Smart Homes and Health Telematics; Springer-Verlag; 2009; Berlin, Heidelberg. pp. 249–252. [Google Scholar]
- 15.Lumsden J. Handbook of Research on User Interface Design and Evaluation for Mobile Technology (2-Volume Set) Information Science Reference. (1 edition) 2008 Jan; [Google Scholar]
- 16.Mariappan A, Ruiz MB, Zhu F, Boushey CJ, Kerr DA, Ebert DS, Delp EJ. Personal dietary assessment using mobile devices. Proceedings of the IS&T/SPIE Conference on Computational Imaging VII. 2009 Jan.volume 7246 doi: 10.1117/12.813556. 72460Z–72460Z–12. [DOI] [PMC free article] [PubMed] [Google Scholar]
- 17.Nilsson EG. Design patterns for user interface for mobile applications. Advances in Engineering Software. 2009 Dec;volume 40:1318–1328. [Google Scholar]
- 18.Ogden CL, Carroll MD, Curtin LR, McDowell MA, Tabak CJ, Flegal KM. Prevalence of overweight and obesity in the united states, 1999–2004. JAMA: the journal of the American Medical Association. 2006 Apr.volume 295:1549–1555. doi: 10.1001/jama.295.13.1549. [DOI] [PubMed] [Google Scholar]
- 19.Ogden CL, Carroll MD, Flegal KM. High body mass index for age among us children and adolescents, 2003–2006. JAMA: the journal of the American Medical Association. 2008 May;volume 299:2401–2405. doi: 10.1001/jama.299.20.2401. [DOI] [PubMed] [Google Scholar]
- 20.Patrick K, Griswold WG, Raab F, Intille SS. Health and the mobile phone. American Journal of Preventive Medicine. 2008;volume 35:177–181. doi: 10.1016/j.amepre.2008.05.001. [DOI] [PMC free article] [PubMed] [Google Scholar]
- 21.Porter MF. An algorithm for suffix stripping. 1997:313–316. [Google Scholar]
- 22.Reddy S, Parker A, Hyman J, Burke J, Estrin D, Hansen M. Image browsing, processing, and clustering for participatory sensing: lessons from a dietsense prototype. EmNets ’07: Proceedings of the 4th workshop on Embedded networked sensors. 2007:13–17. [Google Scholar]
- 23.Six BL, Schap TE, Zhu FM, Mariappan A, Bosch M, Delp EJ, Ebert DS, Kerr DA, Boushey CJ. Evidence-based development of a mobile telephone food record. 2010;110(1):74–79. doi: 10.1016/j.jada.2009.10.010. [DOI] [PMC free article] [PubMed] [Google Scholar]
- 24.Tarasewich P, Gong J. Interface design for handheld mobile devices; In Proceedings of the Americas Conference on Information Systems (AMCIS) 2007; 2007. [Google Scholar]
- 25.Wang DH, Kogashiwa M, Kira S. Development of a new instrument for evaluating individuals’ dietary intakes. Journal of the American Dietetic Association. 2006:1588–1593. doi: 10.1016/j.jada.2006.07.004. [DOI] [PubMed] [Google Scholar]
- 26.Wang DH, Kogashiwa M, Ohta S, Kira S. Validity and reliability of a dietary assessment method: the application of a digital camera with a mobile phone card attachment. Journal of Nutritional Science and Vitaminology. 2002 Dec.volume 48:498–504. doi: 10.3177/jnsv.48.498. [DOI] [PubMed] [Google Scholar]
- 27.White SM, Marino D, Feiner S. Designing a mobile user interface for automated species identification. CHI ’07: Proceedings of the SIGCHI conference on Human factors in computing systems; ACM; 2007; New York, NY, USA. pp. 291–294. [Google Scholar]
- 28.Woo I, Ostmo K, Kim S, Ebert DS, Delp EJ, Boushey CJ. Automatic portion estimation and visual refinement in mobile dietary assessment. Proceedings of the IS&T/SPIE Conference on Computational Imaging VIII. 2010 Jan;volume 7533 doi: 10.1117/12.849051. 75330O–75330O–10. [DOI] [PMC free article] [PubMed] [Google Scholar]
- 29.Zhu F, Bosch M, Woo I, Kim S, Boushey CJ, Ebert DS, Delp EJ. The use of mobile devices in aiding dietary assessment and evaluation. Selected Topics in Signal Processing, IEEE Journal of. 2010 Aug.4(4):756–766. doi: 10.1109/JSTSP.2010.2051471. [DOI] [PMC free article] [PubMed] [Google Scholar]


