Abstract
A homologous series of Au-coated iron oxide nanoparticles, with hydrodynamic diameters smaller than 60 nm was synthesized with very low Auto-iron mass ratios as low as 0.15. The hydrodynamic diameter was determined by dynamic light scattering and the composition by atomic absorption spectroscopy and energy dispersive x-ray spectroscopy (EDS). Unusually low Au precursor supersaturation levels were utilized to nucleate and grow Au coatings on iron oxide relative to formation of pure Au nanoparticles. This approach produced unusually thin coatings, by lowering autocatalytic growth of Au on Au, as shown by transmission electron microscopy (TEM). Nearly all of the nanoparticles were attracted by a magnet indicating a minimal amount of pure Au particles The coatings were sufficiently thin to shift the surface plasmon resonance (SPR) to the near infrared (NIR), with large extinction coefficients., despite the small particle hydrodynamic diameters, observed from dynamic light scattering to be less than 60 nm.
Introduction
Small nanoparticles (<100 nm) with a thin metal coating on a low surface energy metal oxide core are of interest in numerous applications including imaging agents in nanomedicine,[1, 2] catalysis and electrocatalysis[3, 4] and sensors.[5, 6] For optical diagnostic imaging and therapy, the Au shells on magnetic cores are often too thick to shift the absorbance to the NIR where blood is the most transparent.[7–9] To understand these metal shells, it is instructive to first consider synthesis of pure Au (and other metal) nanoparticles by autocatalytic growth on Au seeds nucleated from soluble precursors[10, 11] or on pre-existing seeds.[12–14] Fine control of the size may be achieved by separating the nucleation and growth stages.[15–19] Unlike Au spheres, highly asymmetric Au particles exhibit NIR absorbance, for example, nanocages,[20] nanorods,[21–25], nanotriangles,[26] branched nanoparticles,[27–29] nanostars,[30–32] urchin-shaped particles,[33] and nanoflowers.[34] The growth of Au shells on metal oxide cores is challenging given the high surface energy of Au and a mismatch in the lattice spacings.[18, 35–39] Thus high supersaturation concentrations of Au are required to drive nucleation of Au seeds on iron oxide surfaces, for example, Au3+/Fe mass ratios on the order of 10.[7, 40, 41] During nucleation of the seeds, competitive autocatalytic growth of Au on Au often produces Au coatings with thicknesses greater than 10 nm.
The growth of a Au coating on an iron oxide core may be partially passivated with low molecular weight ligands, for example, citrate or thiols.[7, 40–43] The ligands must not inhibit the nucleation of the Au seeds too strongly, and simultaneously, must provide steric or electrostatic stabilization. A judicious balance of these factors has been utilized to produce thin Au coatings on small iron oxide cores (<10 nm).[40, 41, 44] However, for larger cores (20–60 nm), polymeric steric stabilizers are often required to counteract attractive van der Waals (VDW) forces between the particles.[2, 45] For a uniform Au shell on a 45 nm Fe3O4 spherical core, a shell thickness of 2.5 nm would require a Au3+/Fe mass ratio of 5:1 assuming 100% coating yield of Au. Here, autocatalytic growth has been found to produce very thick coatings on a fraction of the iron oxide cores,[7] as further examined in this study. To date, reported thickness of Au coatings by direct growth of precursors on an iron oxide nanoparticle substrate typically ranges from 10 to 30 nm[7–9,46, 47]
An alternative is to deposit previously made Au seeds as small as 2 nm in diameter on a nanoparticle substrate, and fill the spaces between the seeds by reduction of Au3+ precursors to form Au shells,[48–52] as first demonstrated on silica.[53] Whereas in principle, the shells may be only slightly larger than the seeds, excessive autocatalytic growth produces coatings with a thickness on the order of 10 nm.[37, 45, 48, 50, 51] In view of the complexities of poor wetting by Au and excessive autocatalytic growth, novel approaches are needed for synthesizing thin metal coatings and controlling their textures.
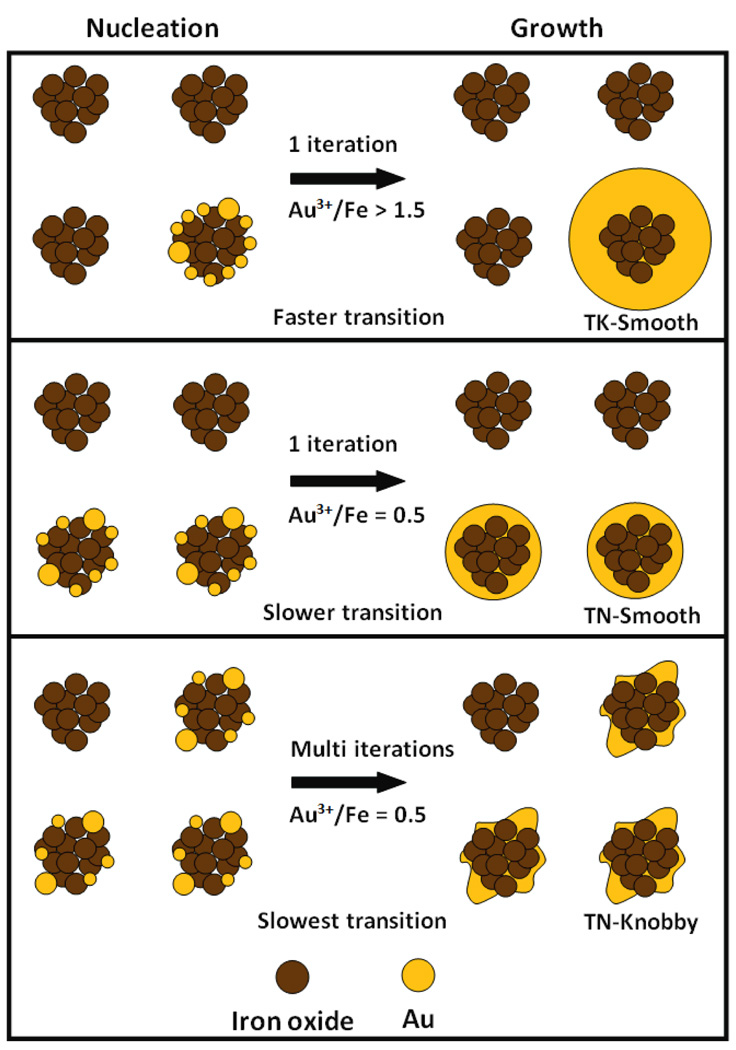
Herein, very thin coatings of Au are grown on iron oxide substrates to achieve extremely small Au/Fe mass ratios, as low as 0.15 by limiting autocatalytic growth of Au. The mechanism is based in part on the seeded autocatalytic growth mechanism for the synthesis of pure metal nanoparticles.[12, 14] The thickness and texture of the thin (< 5 nm) Au coatings are controlled by tuning the separation between nucleation of Au seeds on the iron oxide surface and the autocatalytic growth of the seeds. The Au coatings on the particles are fairly smooth (and relatively spherical) or have knobby protrusions, as shown for a series of morphologies in Scheme 1. Extremely low Au3+/Fe mass ratios of 0.125–0.50 are investigated to limit excessive autocatalytic growth. These low supersaturation levels also inhibit nucleation of Au seeds in the bulk solution such that most of the Au domains are associated with the iron oxide particles as coatings, with various degrees of conformity. The Au3+/Fe ratio profile is varied during the reaction via a number of successive iterations or continuous addition of Au3+ precursor. After reaction, the Au coated particles (and any potential pure gold particles) are separated by centrifugation from relatively uncoated iron oxide nanoclusters. Thiol terminated methoxy-polyethylene glycol (mPEG-SH, Mw = 20,000) is used for steric stabilization,[54] while simultaneously providing sufficient passivation of Au growth. The nanoparticles are characterized by transmission electron microscopy (TEM), and dynamic light scattering (DLS) to determine the morphology and hydrodynamic diameter, respectively, and by atomic absorbance spectrometry (AAS) and TEM energy dispersive x –ray spectroscopy (TEM-EDS) to determine the Au/Fe mass ratio.
Scheme 1.
Homologous Series of Au Coatings on Iron Oxide Nanoclusters with Increasing Au3+ to Fe ratio
A secondary objective is to relate the surface plasmon resonance (SPR) of the nanoparticles to asymmetries in the coating or more generally the gold domain geometry. Asymmetries alter the interactions between plasmon modes and red-shift the SPR peak from 530 nm observed for symmetric systems, such as very thick uniform shells, to the NIR region.[48, 49, 55, 56] For a peak maximum of 700 nm, according to Mie theory, Rtotal/ Rcore < 1.25 is required for a Au shell on a spherical Fe3O4 core with a permittivity of ~ 6.[57–59] Thus, for cores on the order of 40 nm, the requisite shell thickness is expected to be thinner than 5 nm. Such thin coatings have rarely been demonstrated previously.[2] The non-spherical shape of the nanocluster core with either smooth or knobby surfaces (Scheme 1) contributes to a highly asymmetric geometry for the Au coatings. Related types of asymmetry have been demonstrated for Au nanorods,[21] nanocages,[18] nanorice,[49] nanoeggs (asymmetric egg white shells),[55] smooth particles with faceted or tetracubic cores,[48] nanostars,[30–32] urchin-shaped particles,[33] and nanoflowers.[34] The high degree of functionality with a thin metal coating on relatively small nanoparticles is desirable for optical,[60, 61] magnetic or multimodal imaging and therapy[62, 63] with effective permeation of biological barriers.[2, 64, 65]
Results
Au Nucleation and Growth Kinetics on Iron Oxide Substrates with a Single Iteration
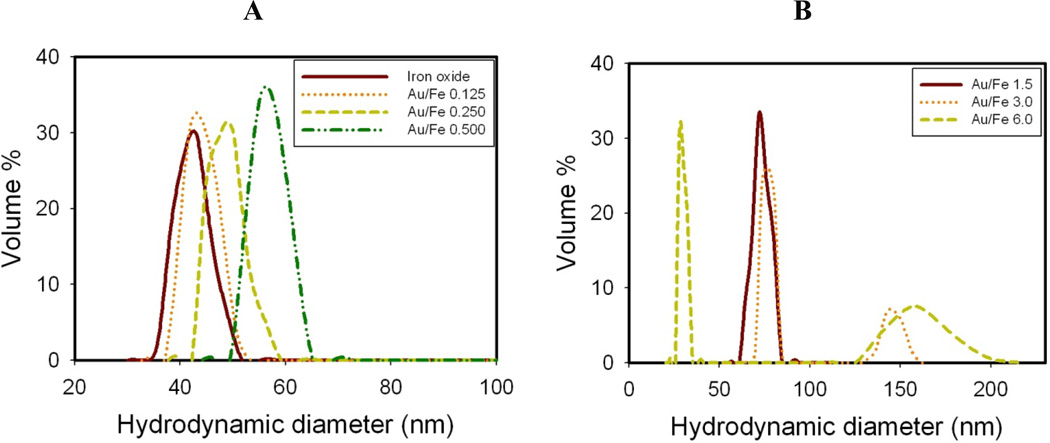
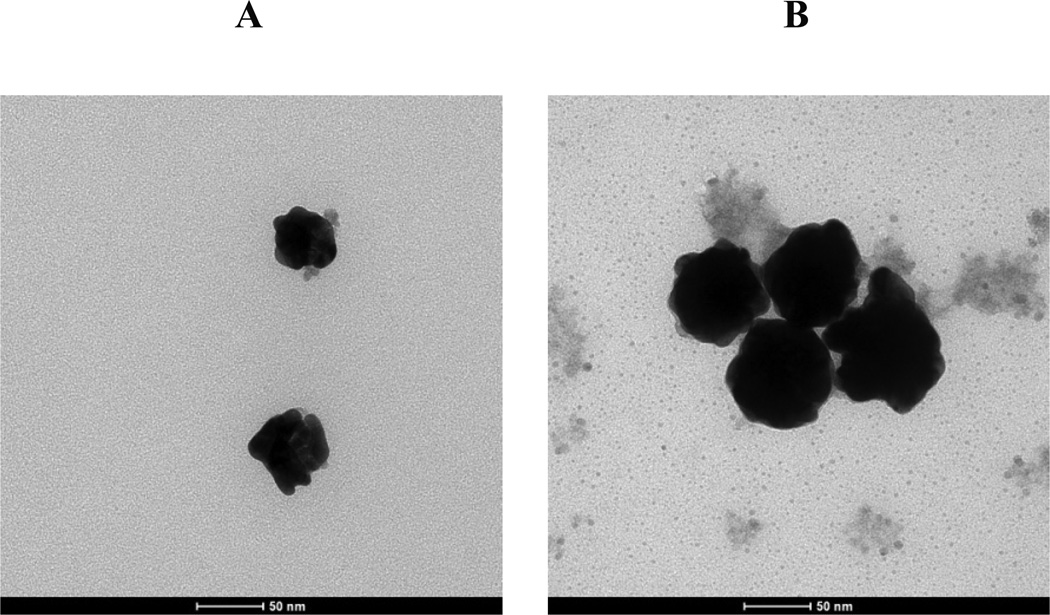
The diameter of the starting citrate stabilized iron oxide nanoclusters without any added Au3+ was ~40 nm as shown by DLS (Fig. 1A). The feed Au3+/Fe ratio used to produce the iron oxide-gold coated nanocomposite particles was varied as shown in Figs 1 and 2. The mPEG-SH stabilizer in the initial mixture bonds to the growing Au surfaces. To form a complete monolayer of mPEG-SH on a 50 nm diameter Au nanoparticle surface, the estimated mPEG-SH/Au mole ratio was 0.006.A higher mPEG-SH/Au3+ feed mole ratio of 0.08 was chosen for all experiments. The darker Au domains seen in Figs 2A and 2B are a consequence of the higher electron density for Au. Therefore once gold deposits on iron oxide, the iron oxide is masked by the gold and is not visible in the TEM images. As the feed Au3+/Fe mass ratio increased progressively to 1.5, size of particles with thick relatively smooth Au domains (with very small knobby protrusions) increased in diameter to 80 nm (TK-Smooth, Scheme 1).
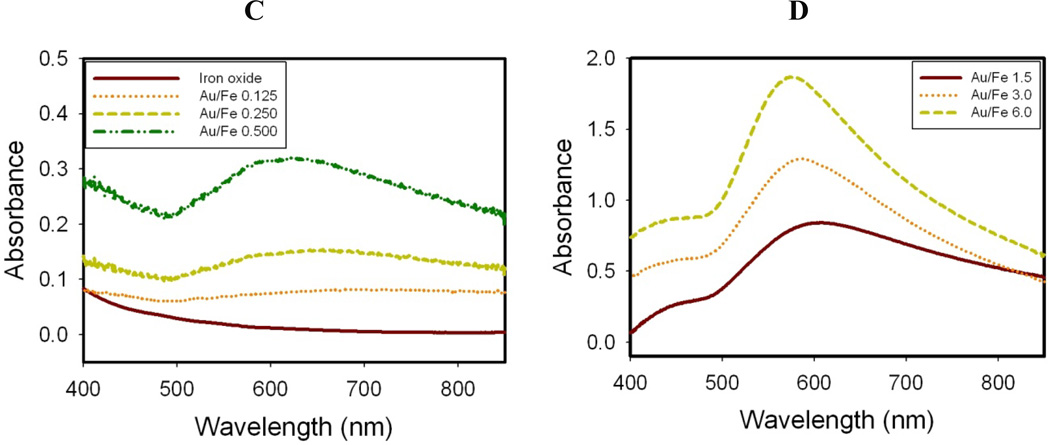
Figure 1. Effect of Au3+/Fe ratio on hydrodynamic diameter and absorption spectrum for nanocluster dispersions formed by a single iteration without centrifugation.
A, B. Hydrodynamic diameter by DLS. C, D. Absorbance spectra after subtraction of iron oxide baseline.
Figure 2. Au-iron oxide nanocluster morphology.
TEM images of Au-iron oxide nanoclusters for different Au3+/Fe mass ratios for a single precursor iteration. A, Au3+/Fe = 0.5. B, Au3+/Fe = 1.5.
The hydrodynamic diameters obtained by DLS for the Au coated nanoclusters in the dispersion without centrifugation are shown in Fig. 1 and Table S1. The variances for hydrodynamic diameters were quite small (Fig. 1 and Table S1). The hydrodynamic diameters are in the same range as the diameters estimated from the TEM images, although the numbers of particles in the TEM images were too small for statistically significant determination of particle size. According to both the TEM images and DLS, the gold domain size increases monotonically with the Au3+/Fe ratio. As the Au3+/Fe ratio increased to 0.5 (TN-Smooth), the measured mean hydrodynamic diameter increased to 57 nm. Much larger particles were formed at higher Au3+/Fe ratios, with the hydrodynamic diameter reaching 159 nm at a Au3+/Fe mass ratio of 6 (TK-Smooth). At this high ratio, 30 nm diameter pure Au nanoparticles were also present, as shown in Fig. 1B by DLS.
The spectra of Au coated nanoparticles shown in Fig. 1C have been corrected by subtraction of the initial iron oxide spectra. All the absorbance values reported in this study are absolute and therefore have no units. At a feed Au3+/Fe ratio of 0.125 (TN-Partial), the absorbance in the visible and NIR regions from 500 to 850 nm was broad, even with the extremely low amount of Au. For feed Au3+/Fe ratios of 0.25–0.5 in Fig. 1C (TN-Smooth), the absorbance peaked in the visible region. For feed Au3+/Fe ratios from 1 to 6, the SPR peaks were blue shifted as the gold domains became smoother and, for coated particles, the gold domains became larger (TK-Smooth). This trend follows previously reported results wherein SPR peak maxima of about 600 nm have been observed for thick Au shells on iron oxide.15,28,36,38,40,41
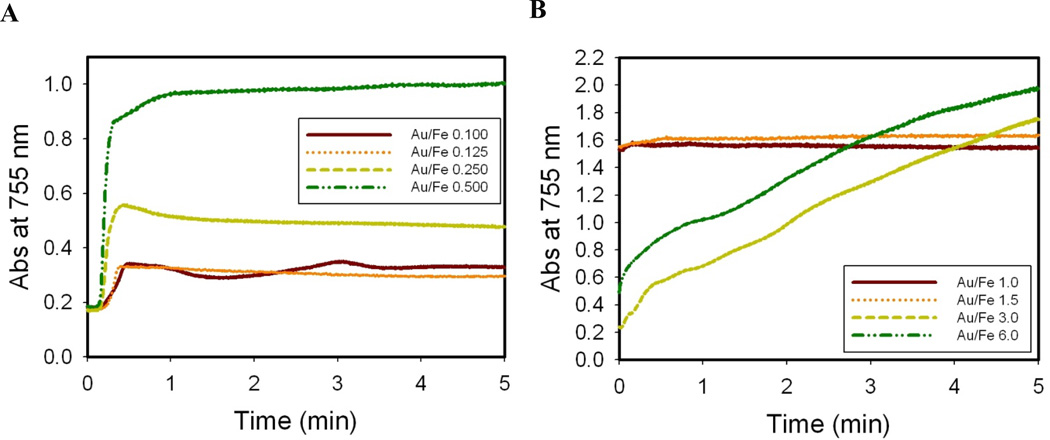
To better understand the mechanism, the kinetics of Au nucleation and growth were monitored in situ by UV-Vis spectrometry at 755 nm. The wavelength was chosen to minimize interference from the possible formation of spherical gold (absorbance peak at ~530 nm) as the coated gold which was of primary interest absorbed at higher wavelength. As can be seen in Fig. 3A, the absorbance of Au-iron oxide nanoclusters for a Au3+/Fe mass ratio 0.125–0.5 reached a plateau within the first 20–25s. For control experiments without iron oxide in the reaction mixture (data not shown) the spectral change was observed to start at about 100–120s and end at about 5 minutes as pure Au nanoparticles were formed. The plateau height increased with the Au3+/Fe ratio suggesting a greater degree of nucleation and growth, as is consistent with thicker coatings in TEM images (Figs 1 and 2). When the Au3+/Fe ratio was raised higher to 1.0 or 1.5, the kinetic rate increased and the plateau height further increased as shown in Fig. 3B. These results suggest that the large heterogeneous surface area of iron oxide was sufficient to achieve rapid nucleation. However, for Au3+/Fe ratios of 3.0 and 6.0, the absorbance increased continuously for 5 min without reaching a plateau indicating that there was a change in the mechanism at high supersaturations of Au precursor.
Figure 3. Heterogeneous Au nucleation.
Au nucleation and growth kinetics monitored in situ by absolute absorbance of Au on iron oxide at 755 nm for single precursor iterations. A, Low Au3+/Fe mass ratios (0.1 to 0.5); B, high Au3+/Fe mass ratios (1 to 6).
Au Nucleation and Growth Kinetics on Iron Oxide Substrates with Multiple Iterations
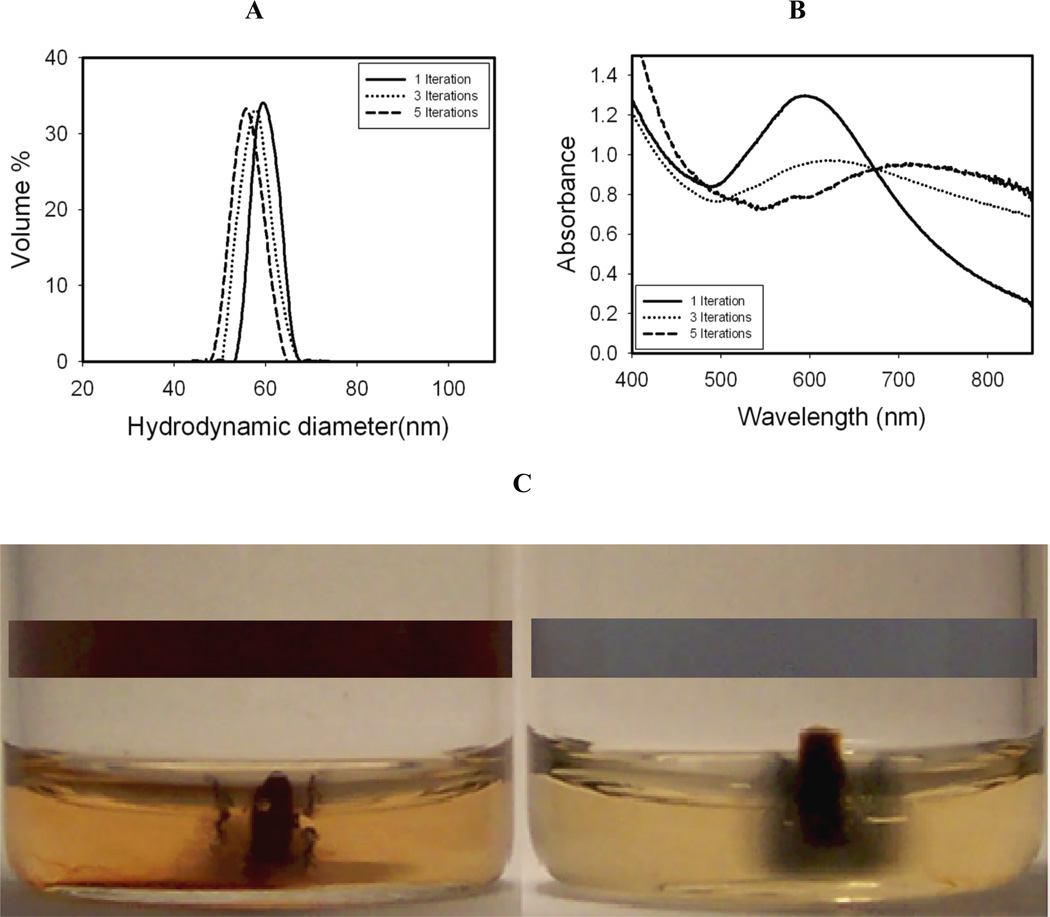
The number of iterations of added Au3+ precursor was varied for a total feed Au3+/Fe ratio of 0.5 to control the morphology. Smooth, relatively round (TN-Smooth), Au coated particles are shown in Fig. 4A formed using a single iteration, similar to the TEM image in Fig. 1A. For 3 equal iterations, the Au domains were smaller with knobby protuberances present on the surface of the clusters (Fig. 4B, TN-Knobby). The trend of smaller domains with ever more knobby protrusions continued as the number of iterations was increased from 3 to 5. The iron oxide in the clusters can be clearly seen in the TEM images in Figs 4B and 4C. Also TEM–EDS measurements for the particles made with 1 iteration of Au shown in Fig. S2 demonstrate that the nanoparticles were composed of both gold and iron oxide (Au/Fe ratio of ~ 4). As the number of iterations increased from 1 to 5 as shown in Fig. 5A and Table 1, the mean hydrodynamic diameters (Dh) of Au and iron oxide coated nanoparticles decreased from 61 nm to 57 nm. This decrease in size was also evident in the TEM images (Fig. 4), although the number of particles in these images is not statistically significant. Furthermore, the Au/Fe ratio from AAS decreased by a factor of approximately 3 with this decrease in hydrodynamic diameter indicating that there was probably a higher fraction of iron oxide clusters coated with gold, Therefore, more clusters were recovered by centrifugation, and a decrease in the Au domain size was observed for the composite particles (Table 2).
Figure 4. Nanocluster morphology with different iterations.
TEM images of Au coated iron oxide nanoparticles for a total Au3+/Fe mass ratio of 0.50 with varying numbers of precursor iterations. All samples were separated by centrifugation at 6,000 rpm for 6 mins. A, Single iteration. B, Three iterations.C, Five iterations.
Figure 5. Characterization of Au-iron oxide.
A, Hydrodynamic diameters Au coated iron oxide nanoclusters for a total Au3+/Fe mass ratio of 0.50 with varying numbers of precursor iterations. B, Absorbance spectra of the same nanoclusters as in A. C, Images of diluted pure iron oxide nanoclusters (left vial) and Au coated iron oxide nanoclusters from A and B formed with five iterations of Au (right vial) before (see colored rectangular bar insets) and after exposure to a permanent magnet for 24 hours;
Table 1.
Mean size and standard deviation measured by DLS of textured thin Au coated iron oxide nanoparticles for total Au3+/Fe mass ratio of 0.5, with varying numbers of precursor iterations
| Number of iterations |
Mean (nm) | Standard deviation (nm) | Standard deviation (%) |
|---|---|---|---|
| 1 | 61 | 2.6 | 4.3 |
| 3 | 59 | 3.0 | 5.1 |
| 5 | 57 | 3.2 | 5.6 |
Table 2.
Final Au/Fe ratio by AAS of Au coated iron oxide nanoparticles for a total Au3+/Fe mass ratio of 0.50 with different numbers of precursor iterations
| Number of iterations | Au/Fe | Extinction coefficient at 755 nm (cm2/µg Au) |
|---|---|---|
| 1 | 2.40 | 0.040 |
| 3 | 1.30 | 0.043 |
| 5 | 0.84 | 0.050 |
UV-vis absorbance spectra for the samples after centrifugation are shown in Fig. 5B. For particles with one iteration of Au, the absorbance spectrum was similar to that in Fig. 2C (which was not centrifuged), hinting at small relatively smooth domains (TN-Smooth). However, for addition in 3 or 5 iterations, the absorbance shifted progressively into the NIR region and became broader and flatter as the Au domains in the coatings became smaller and the knobby protrusions of gold on the surface became larger (TN-Knobby, Scheme 1). To determine if any non-magnetic relatively pure Au particles were present without any iron oxide, a permanent magnet was placed next to the dispersions as shown in Fig. 5C. The insets show the color of the dispersions before the magnet was applied. The Au coated nanoclusters (right vial) were blue and the color was less intense than for the iron oxide nanocluster (left vial) as a result of the lower concentration. In each case, the magnet attracted most of the nanoclusters. In the right panel the nanoclusters are seen as a blue pellet near the magnet, and away from the magnet the blue color for Au coated particles is not present. Thus, the concentration of any free Au particles without magnetic iron oxide was very low.
Au Nucleation and Growth Kinetics on Iron Oxide Substrates with Continuous Precursor Addition
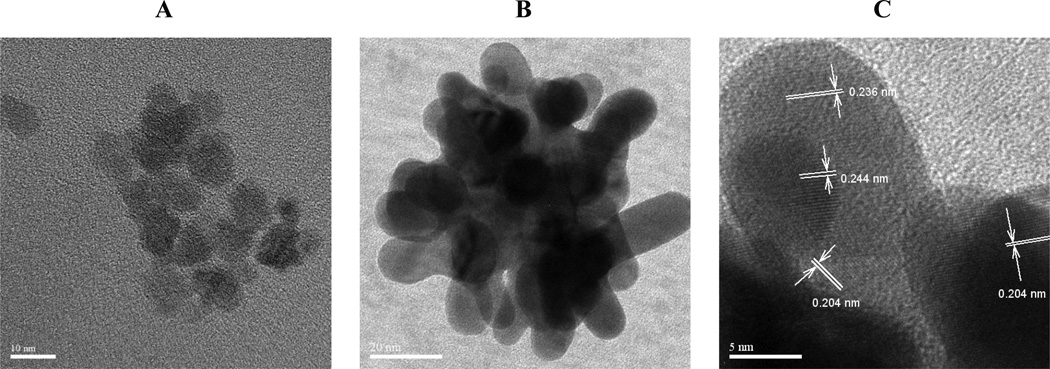
The number of iterations of Au addition was raised to infinity by adding the Au3+ precursor continuously to an iron oxide dispersion. Here Au precursor (0.5 mg Au3+/ml) was injected with a syringe pump at a rate of 0.1 ml/s for 2 minutes. For the uncoated iron oxide nanoclusters on the order of 40 nm, the primary particle size was 8 nm (Fig. 6A). For a total Au3+/Fe mass ratio of 0.5, high resolution TEM images (Figs 6B and 6C) after centrifugation reveal lattice fringes from Au and Fe3O4 crystalline domains. The lattice spacing of 0.244 nm in the interior of the cluster from an 8 nm primary spherical particle agreed with the (3 1 1) plane of Fe3O4 in Fig. 6C, which is quite different from any other Fe3O4 or Au lattice planes. Two Au crystalline facets for the (1 1 1) and (2 0 0) orientations correspond to 0.236 nm and 0.204 nm d-spacings, respectively for Au. In the TEM image shown in Fig. 6C, these Au coatings on the exterior of the cluster are only a few nm thick and are highly curved with a shape matched to the curvature of the surfaces of the iron oxide primary particles in the core. There may however be pure gold particles in the dispersion adjacent to iron oxide clusters.
Figure 6. Morphology of Au coatings on iron oxide by high resolution TEM.
A, Image of an iron oxide nanocluster. B, Au coated iron oxide nanocluster with feed Au3+/Fe = 0.5. C, A magnified image of the upper tip from B indicating thin Au coating on Fe3O4 nanocluster.
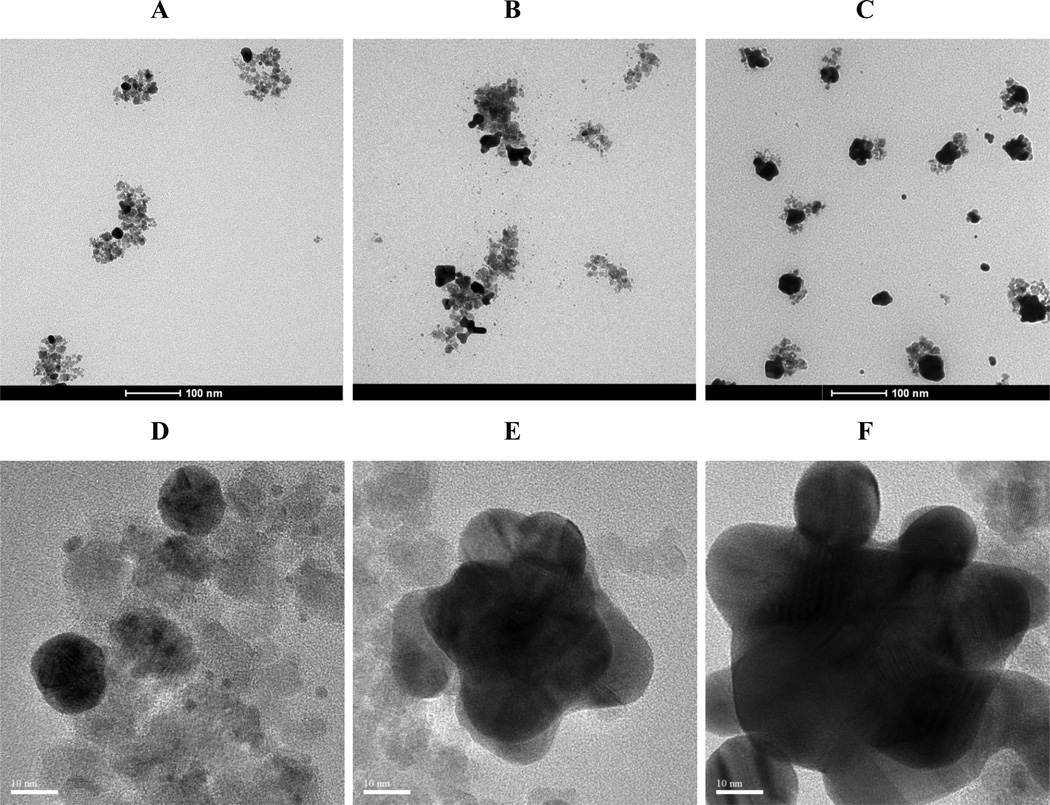
The total feed Au3+/Fe ratio (at a Fe concentration of 0.1 mg/ml) was varied to attempt manipulation of the coating thickness for the coated particles along with the shape of the Au domains, as shown in the TEM images in Fig. 7. At an Au3+/Fe ratio of 0.125, a few spherical 12–15 nm darker spots are evident on the lighter iron oxide nanoclusters in Figs 7A and 7D (TN-Partial), indicating that the gold is associated with iron oxide clusters. In addition, extremely small 1 nm Au particles, which may be considered Au embryos or seeds, may be observed on the surface of the iron oxide clusters (Fig. 7D). The mean hydrodynamic diameter by DLS of these nanoclusters was 51 nm (Table 3). At a higher Au3+/Fe ratio of 0.25, the number and size of Au domains on the iron clusters both increased as observed by TEM (Figs 7B and 7E). Consistent with these larger domains, the hydrodynamic diameter increased to 54 nm (Table 3). At the highest Au3+/Fe ratio of 0.5, the domains became progressively larger and closer to having complete surface coverage and the mean hydrodynamic diameter increased to 61 nm (Table 3, TN-Knobby). According to AAS, the final Au/Fe ratio increased monotonically as expected with the added Au3+/Fe ratio, consistent with the TEM and DLS results.
Figure 7. Growth of Au domains on iron oxide nanoclusters.
TEM images of the morphology evolution of thin Au coatings on iron oxide substrates for continuous addition of precursor as a function of the total Au3+/Fe mass ratio. A-C are low res TEM images while D-F are high resolution TEM images with different Au3+/Fe. A, Au3+/Fe = 0.125. B, Au3+/Fe = 0. 25. C, Au3+/Fe = 0.5. D, Au3+/Fe = 0.125. E, Au3+/Fe = 0. 25. F, Au3+/Fe = 0.5.
Table 3.
Mean Hydrodynamic Diameter (Dh) and Standard Deviation by DLS of Textured Thin Au Coated Iron Oxide Nanoparticles for Feed Mass Ratio of Au3+/Fe ranging from 0 to 0.5 with Continuous Addition of Au3+ Precursor.
| Au3+/Fe ratio | Mean Dh (nm) |
Standard Deviation (nm) | Standard deviation (%) |
|---|---|---|---|
| 0 (Iron oxide) | 42 | 3.2 | 7.5 |
| 0.125 | 51 | 3.4 | 6.8 |
| 0.25 | 54 | 3.1 | 5.7 |
| 0.5 | 61 | 3.0 | 4.8 |
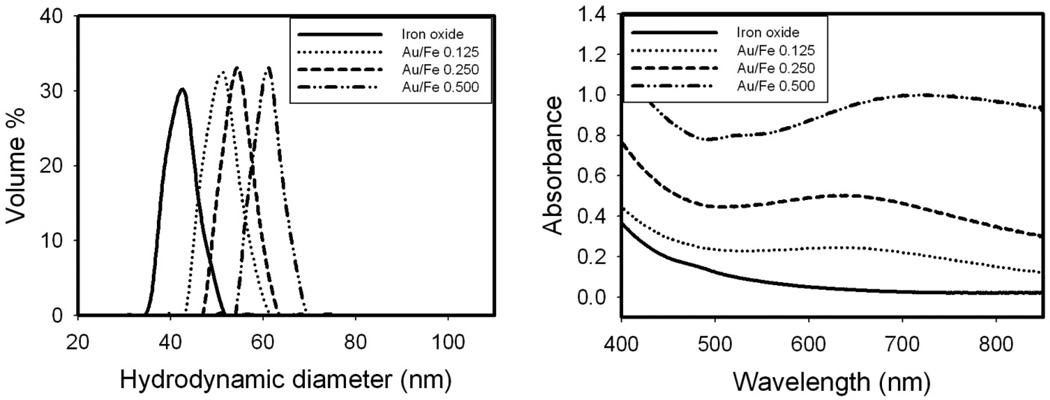
The hydrodynamic diameters for these nanoclusters are shown in Fig. 8A corresponding to the statistics in Table 3. The hydrodynamic diameter increased from 42 nm for the iron oxide to 60 nm for the Au coated iron oxide nanoclusters with Au3+/Fe = 0.5.The absorbance spectra may be correlated with the morphologies observed by TEM and the hydrodynamic diameters by DLS. In Fig. 8B, the absorbance intensity increased over the entire spectral range as the feed Au3+/Fe ratio increased. At an Au3+/Fe ratio of 0.5, the maximum in SPR was above 700 nm for the particles with knobby surfaces according to TEM images in Fig. 7 (TN-Knobby, Scheme 1). The extinction coefficient per weight of gold at 755 nm was observed to decrease as the added Au3+/Fe ratio increased as can be seen in Table 4.
Figure 8. Properties of nanoclusters produced by continuous Au3+ addition.
A, Evolution of hydrodynamic diameter of the Au-iron oxide nanoclusters with the addition of Au3+ precursor continuously at Au/Fe ratios ranging from 0 to 0.5. B, Absorbance spectra of the same nanoclusters as a as a function of the Au3+/Fe mass ratio.
Table 4.
Elemental analysis of textured thin Au coated iron oxide 0nanoparticles by AAS for a total Au3+/Fe mass ratio from 0.125 to 0.5, for continuous addition of Au3+ precursor
| Au3+/Fe ratio |
Final Au/Fe ratio |
Fe yield % |
Au yield % |
Estimated total diameter (nm) |
Extinction coefficient at 755 nm (cm2/µg Au) |
|---|---|---|---|---|---|
| 0.125 | 0.145 | 3.8 | 4.6 | 42.3 | 0.061 |
| 0.250 | 0.281 | 4.0 | 5.3 | 42.5 | 0.051 |
| 0.500 | 0.691 | 4.6 | 7.2 | 43.2 | 0.050 |
Separation of Au Coated Nanoclusters from Iron Oxide Nanoclusters by Centrifugation
The densities of Au coated versus uncoated iron oxide can be very different given the bulk densities of 19.3 and 5.2 g/cm3 for Au and Fe3O4, respectively. The predictions of the model in Table S3 indicate that a centrifugation speed on the order of 5,000–6,000 rpm is sufficient to move the Au coated clusters to the bottom of the centrifuge tube in approximately 6 minutes. However, at this speed the sedimentation of the uncoated clusters is relatively low, and thus it should be possible to concentrate the coated clusters in the precipitate.
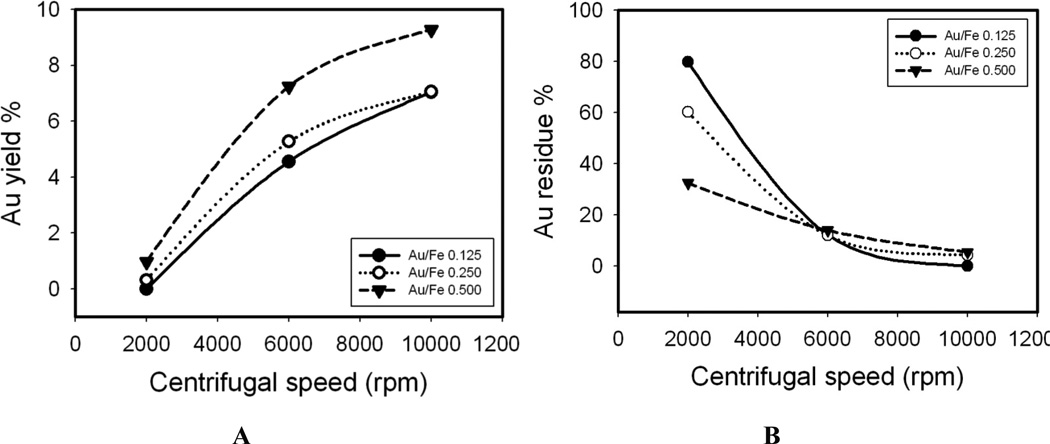
Based on the theoretical predictions, the centrifugation speed was varied for 6 min centrifugation runs for the case of the particles produced in 5 iterations according to Fig. 9. For each Au3+/Fe ratio, the Au yield in the precipitate increased significantly for an increase in speed from 2,000 to 10,000 rpm, and the yield decreased in the supernatant. The Au yields in the precipitate were higher for the higher initial Au3+/Fe ratios, which produced thicker coatings as expected. Thus, these changes in yields were observed in regions of centrifugation speeds as expected from the theoretical predictions of the sedimentation coefficient, based on the Au coatings. The detailed elemental analysis data for Au and Fe before and after centrifugation are shown in Table S4. After centrifugation under all conditions, the Fe yield in the precipitates was less than 10% of the total in the nanoclusters prior to separation. For some practical applications, the uncoated iron oxide may be recycled. All the gold is not accounted for in this case as there was some loss to the beaker and centrifuge tube walls and the stir bars.
Figure 9. Centrifugal separation of Au coated nanoclusters.
Au yield in precipitate A and Au residue B in supernatant after centrifugation at different speeds for 6 mins. The Au3+ precursor was added by 5 iterations.
Discussion
To explain the range of experimental morphologies illustrated in Scheme 1, a general mechanism is presented to describe thin autocatalytic growth on a substrate (TAGS). The mechanism explains nucleation and growth by reduction of Au3+ on Au surfaces or on an iron oxide surface to form the thin Au coatings. To serve as a background, a brief summary of the seeded autocatalytic growth mechanism is presented to describe formation of pure Au nanoparticles. The discussion concludes by relating SPR absorption spectra for the Au coated nanoclusters to particle morphology.
Autocatalytic Nucleation and Growth of Pure Au Nanoparticles
A mechanism of homogenous nucleation to produce Au seeds followed by growth on the seeds has been widely used to guide the synthesis of nanoparticles of controlled size with narrow polydispersity. Homogenous nucleation to form Au seeds
| (1) |
may compete with growth on the Au seeds
| (2) |
where n is the number of Au atoms in one Au seed. The growth reaction is autocatalytic in that the Au surface in the product is also a reactant and hence the reaction speeds up as more Au is deposited.
The resulting rate expressions are[10,19]
| (3) |
| (4) |
| (5) |
where k1 and k2 are rate constants for nucleation and growth, respectively, and [Au3+]0 is the initial concentration of precursor. The values of k2 will be relatively large given the much greater thermodynamic driving force for reduction of Au on a Au surface than for homogeneous nucleation. The initial rate of formation of Au by homogeneous nucleation will be slow, given the growth (second term) in eq. (5) will be zero. As Au increases, contribution of the second term in eq. (5) will become dominant. Eventually, when Au in solution is sufficiently depleted, the growth reaction rate slows progressively, resulting in the well-known sigmoidal-shaped kinetics curve.[10,14] For a decrease in [Au3+]0, the relative contribution of the growth step becomes smaller in eq. (7) relative to nucleation. For example, after half of [Au3+]0 reacts, the rate is proportional to k1 + k2[Au3+]0/2. For a given nucleation rate, a decrease in the growth rate will lead to more nuclei, and thus a larger number of smaller final particles. Thus, a delay in autocatalytic growth provides greater separation between nucleation and growth, leading to smaller particles and lower polydispersity in the seeded growth mechanism.[15]
Heterogeneous Nucleation and Growth of Au Coatings on Substrates for a Single Iteration at a Relatively Low Au3+/Fe Ratio
The fraction of iron oxide substrates that become covered with seeds during the nucleation phase and how this influences subsequent growth is an important additional degree of freedom. Furthermore, the energy barrier for formation of Au seeds is lowered by the heterogeneous iron oxide substrate and by the adsorbed hydroxylamine on the iron oxide surfaces.[7] The heterogeneous nucleation of Au on the iron oxide nanoparticles is supported by the large acceleration in the rate of gold reduction in the presence of iron oxide over that in the absence of iron oxide. Furthermore, the motion of the nanoclusters in the magnetic field shown in Fig. 5C indicated that nearly all of the particles contained iron oxide and few were pure Au.
A mechanism for thin autocatalytic growth on substrates (TAGS) is shown in Scheme 2 for three levels of separation of nucleation and growth. The substrate (core) may be a nanocluster (brown), or another geometric shape, for example, a sphere (not shown).
Scheme 2.
Nucleation and Growth of Au Coatings on Iron Oxide Substrates by Varying Precursor Addition Profile
The scenario for a Au3+/Fe ratio of 1.5 added in one iteration is given in the top panel in Scheme 2 and the first column in Table 5. In the experiments in Fig. 1–Fig. 3, a Au3+/Fe ratio of 1.5 provided nucleation of Au seeds on a very limited number of iron oxide nanoparticles, as indicated by TEM and hydrodynamic diameter. Given the high [Au3+]0, for an Au3+/Fe ratio above 1.5,[7] the autocatalytic growth rate is relatively high as given by the second term of eq. (5). Therefore, the time for nucleation to produce Au seeds is short after which the autocatalytic growth on the seeds becomes dominant. Given this short nucleation time, Au seeds are deposited on a small fraction of the substrate particles (indicated schematically in Scheme 2). Rapid growth on a small number of substrates, or equivalently, relatively small separation between nucleation and growth, results in relatively thick coatings as shown in Fig. 1B and top panel of Scheme 2. These TK-Smooth (Scheme 1) Au coatings (~ 10 nm) are commonly observed when Au3+/Fe mass ratios are typically greater than 1.5.[7, 37, 45, 48, 50, 51]
Table 5.
Effects of Au3+ precursor addition profiles on separation of nucleation and growth to control particle morphology
| Property | faster growth on Au seeds | slower growth on Au seeds |
|---|---|---|
| initial Au3+/Fe ratio (supersaturation) | higher | lower |
| autocatalytic growth rate in early stage | faster (less time for seed nucleation) | slower (more time for seed nucleation) |
| transition from nucleation to growth | sooner (less separation between nucleation and growth) | later (more separation between nucleation and growth) |
| coating thickness | thicker (e.g. rounder coatings) | thinner (e.g. knobby coatings) |
| role of polymer | less time to adsorb and less restriction on growth | more time to adsorb and more restriction on growth (favors new nucleation) |
| Au yield in precipitate after centrifugation | larger | smaller |
The middle panel in Scheme 2 describes the behavior at a lower Au3+/Fe ratio of 0.125–0.5 and a single iteration of precursor addition. The second column in Table 5 describes this slower growth relative to the higher Au3+/Fe ratios in the top panel. For slower autocatalytic growth at a lower Au3+/Fe ratio, the transition time from nucleation to growth is longer. The longer nucleation time allows deposition of Au seeds on a larger fraction of substrate particles. For a given amount of Au on a large number of iron oxide particles, thinner coatings or smaller domains are produced as shown experimentally in Figs 1A, 4A and Scheme 2. In summary, greater separation between nucleation to form Au seeds on the substrate and autocatalytic growth at lower Au3+/Fe ratios, and consequently lower supersaturation, produces the extremely small Au domains. Although TN-Smooth (Scheme 1) Au coatings have been achieved on small iron oxide substrates (~10 nm diameter)[40, 41, 44, 66–68] with low MW ligands, they have not been reported for substrates larger than 20 nm as growth has been excessive..
Heterogeneous Nucleation and Growth of Au Domains on Substrates with Iterative or Continuous Au3+ Addition
To further separate nucleation and growth, Au3+ may be fed to the system in multiple iterations or continuously instead of a single shot.[7] In this case, the middle panel and the bottom panel in scheme 2 correspond to the first column and the second column in Table 5 respectively. For the first iteration [Au3+] values are extremely low so that Au seeds may be nucleated on iron oxide substrates with minimal growth and homogeneous nucleation, as shown in Fig. 7D, and the bottom panel in Scheme 2. In control experiments without iron oxide (data not shown), no reaction occurred until the Au3+ concentration exceeded the concentration corresponding to an Au3+/Fe ratio of 0.15 in separate experiments where iron oxide was present (data in paper). After the first iteration, little Au0 surface is present. Thus, each subsequent iteration will nucleate more seeds predominantly on the iron oxide surface, with limited autocatalytic growth (eq. 5) as shown in the bottom panel of Scheme 2 and in high resolution TEM in Fig. 7 for low Au3+/Fe ratios. With delayed autocatalytic growth, the Au seeds are deposited on a larger fraction of iron oxide nanoclusters compared to that for a single iteration (middle panel) with fewer Au seeds deposited per particle (Fig. 7A versus Fig. 4A). For a constant overall Au3+/Fe ratio of 0.5, the coatings became thinner and the final Au/Fe ratios decreased with increased number of iterations as shown in Table 2. This sequence is shown experimentally in Figs 7A, 7B and 7C with high resolution TEM for continuous addition.
In addition to tuning Au/Fe ratio with multiple iterations or continuous Au3+ addition, the final shape may also be controlled, as shown experimentally in Fig. 4 and in the bottom panel of Scheme 2. The shape is controlled by the spatial distribution of nuclei deposited on each substrate particle. The relatively large number of Au seeds nucleated on each seeded substrate particle in the middle panel (relative to the lower panel) led to smoother domains (Fig. 4A). For the same total Au3+/Fe ratio of 0.5, under continuous Au3+ addition, the seeds are spread over a larger number of substrate particles. Consequently, the smaller number of seeds on each substrate (Fig. 7A), grew to produce more asymmetric domains. Subsequent asymmetric growth led to formation of knobby protrusions on a thin coating, as shown schematically in the bottom panel of Scheme 2 and the final particle morphology illustrated in Figs 7C and 7F. With less growth of Au per particle and more time for surface passivation by the ligands, the tendency of knobby shapes to be smoothed out or filled-in to minimize interfacial area is lower than in the case of a single iteration, where autocatalytic growth is more prevalent.
A bimodal distribution of Au containing and pure iron oxide particles is produced intentionally. The uncoated iron oxide substrates serve as a reservoir for nucleation of Au seeds at low Au3+/Fe ratios to limit the autocatalytic growth of Au to prevent formation of large domains or thick coatings and limit the formation of pure gold particles. After reaction, Au containing nanoclusters are separated from the iron oxide particles by centrifugation. The polydispersity in hydrodynamic diameter of these coated particles was relatively low (Table 1 and Table 3), indicating good separation between nucleation and growth, and prevention of aggregation by the polymer coatings.,
Passivation and Steric Stabilization with mPEG-thiol
Once the fraction of Au on the substrates becomes significant, the much stronger VDW forces for the Au versus iron oxide often would cause aggregation.[45] In a recent study, 30 nm Au coated iron oxide nanoclusters with approximately 83% Au have been stabilized with physisorbed dextran (MW 10,000) on the surface.[2] The chemically bound stabilizer mPEG-SH[54] with an end-to-end distance of 12 nm was found to be sufficient to provide particle stabilization. mPEG-SH does not bind significantly to Fe3O4, which otherwise could inhibit nucleation of Au seeds on the surface. During growth, the polymer binds to the growing Au surfaces and provides passivation to prevent excessive growth. Thus passivation by polymer may further accentuate the maintenance of a low Au/Fe ratio as a function of the transition time from nucleation to growth.
SPR Spectra for Various Particle Morphologies
Various types of asymmetry for non-spherical Au nanoparticles produce hybridization between dipoles, quadrupoles and higher-order modes resulting in spectral shifts to the NIR region.[48, 56] For example, consider the case of a spherical silica core with a permittivity of 2.0 and a continuous Au shell. Here, for a peak maximum of 700 nm, Rtotal/Rcore must be < 1.2.[54] For an Fe3O4 core with a permittivity in the range of 5.5 – 6.1,[48] Rtotal/Rcore must be < 1.25, on the basis of calculations and experiments for a Au2S core with a similar permittivity at 5.4.[57–59] For 2–3 nm Au shells on small iron oxide cores (< 10 nm diameter) Rtotal/ Rcore is already too large for significant NIR absorbance.[40, 41, 44, 66–68] Likewise, for relatively thin 5 nm Au shells on 18 nm iron oxide cores, where Rtotal/ Rcore = 1.56, the SPR peak maximum was 590 nm.[52] As mentioned earlier, in nearly all previous studies for cores in the range of 10 to 60 nm, autocatalytic growth led to coatings such that Rtotal/ Rcore> 1.25, leading to limited absorbance in the NIR region.
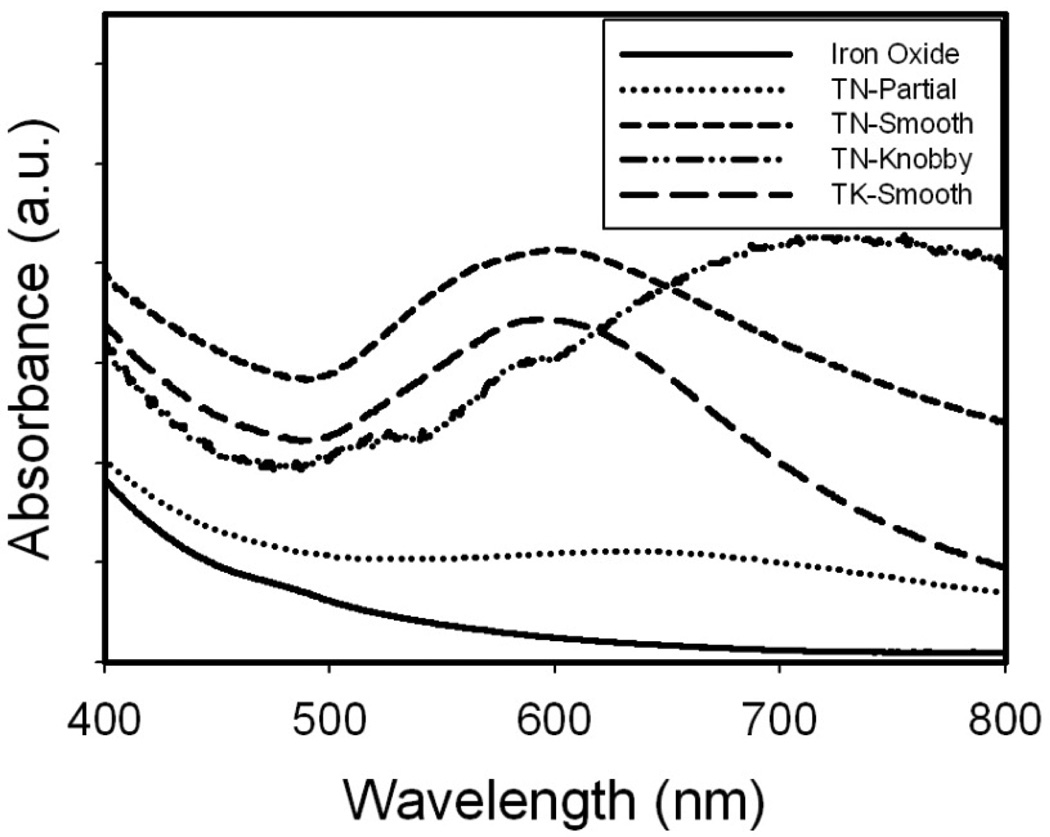
Particles with highly asymmetric cores and smooth shells may provide significant absorbance in the NIR. Such behavior was observed for > 8.5 nm thick Au coatings on relatively large non-spherical iron oxide substrates (50–60 nm faceted or cubic).[48, 50] For our smooth Au coatings on relatively large 42 nm iron oxide nanocluster cores (Rtotal/ Rcore = 1.33 by DLS assuming a uniform spherical shell) (TN-Smooth in Scheme 1, Figs 1A and 4A, summarized in Table 6), the broad SPR peak shifted to 600 nm with significant absorbance in the NIR region (Fig. 10). The extremely knobby highly asymmetric Au domains on the iron oxide nanocluster cores in Fig. 6B produced the strongest absorbance per mass of gold in the NIR region (Scheme 1, Fig. 10, and Table 6. The combined effect of all of these asymmetries produced the very broad NIR absorbance in contrast with sharper peaks for a single mode such as Au nanorods.[21] Furthermore, the extinction coefficients were large for all of the Au morphologies presented in Table 6.[2] Related spectral behavior was observed for recently reported asymmetric Au coatings on iron oxide clusters,[2] however, only for a single particle morphology.
Table 6.
Particle properties for different morphologies of Au coatings
| TN-Partial Fig. 7A |
TN- Knobby Fig. 4C |
TN-Smooth Fig. 4A |
TK- Smooth Fig. 1B |
|
|---|---|---|---|---|
| initial Au3+/Fe mass ratio | 0.125 | 0.5 | 0.5 | 1.5 |
| Au3+ iterations | 1 | 5 | 1 | 1 |
| final Au/Fe mass ratio | 0.15 | 0.84 | 2.40 | 5.09 |
| extinction coefficient at 755 nm (cm2/µg Au) | 0.061 | 0.050 | 0.040 | 0.029 |
| hydrodynamic diameter (nm) | 51 | 57 | 61 | 73 |
| absorbance peak max (nm) | Flat | 730 | 620 | 600 |
Figure 10. Spectral and morphological classes of Au-iron oxide nanoclusters.
Evolution of absorbance spectra from uncoated iron oxide nanoclusters to Au coated particles with different coating thickness and geometry. Arbitrary absorbance units were chosen to illustrate the spectral changes of the 4 particle classes shown in Scheme 1 and Table 6.
Conclusions
High feed Au3+/Fe ratios (greater than 5:1) that are typically used to drive growth of Au shells on iron oxide surfaces produce thick coatings (10–30 nm) with large Au/Fe ratios (10:1 to 20:1).. Herein, low total Au3+/Fe ratios (0.125–0.50) were utilized to coat thin smooth or knobby Au domains (<5 nm) on small 42 nm iron oxide cores. At these low supersaturation values, the slower autocatalytic growth relative to nucleation of Au seeds, results in Au coatings on a larger fraction of the iron oxide substrate particles. Consequently, the Au domains were found to be very thin. In essence, the lower supersaturation provides greater separation between nucleation of seeds on the iron oxide surfaces and subsequent growth, particularly for multiple iterations or continuous addition of Au3+ precursor. Composite nanoclusters, containing Au and iron oxide with relatively monodisperse hydrodynamic diameter distributions, were separated efficiently from uncoated particles by centrifugation.. A covalently bonded polymer, mPEG-SH, passivated the growth of Au and also provided steric stabilization. The asymmetry in shape of the small Au domains altered the interactions between plasmon modes and shifted the SPR peak to the NIR region, with high cross sections, despite the small overall nanoparticle size. The low Au/Fe ratios resulted in strong NIR cross sections per mass of Au, as well as a high magnetization per total mass. The optical and magnetic bifunctionality in particles smaller than 60 nm is desirable for optical, magnetic or multimodal imaging and therapy, with effective permeation of biological barriers.[1, 2, 8, 9, 46, 60–63, 70, 71]
Methods
Materials
All reagents used were analytical grade. Ferrous chloride, ammonium hydroxide, hydroxylamine hydrochloride and sodium hydroxide were purchased from Fisher Chemicals (Fairlawn, NJ). Ferric chloride was purchased from Acros Organics (Morris Plains, NJ), and citric acid from EM Science (Gibbstown, NJ). Tetrachloroauric acid trihydrate (HAuCl4 ·3H2O) was purchased from MP Biomedicals LLC (Solon, OH) and mPEG-SH (MW 20,000) from Nanocs Inc. (New York, NY).
Kinetics of Nucleation and Growth of Au on Iron Oxide
Iron oxide nanoclusters coated with citrate were synthesized by hydrolysis of iron chlorides by modification of the method of Sahoo et al.[72] as described in the Supporting Information. The iron oxide nanoclusters were dispersed in 100 ml of deionized (DI) water at a concentration of 0.1 mg Fe/ml with rigorous stirring. 300 µL ammonium hydroxide (7 %) was added to adjust the pH to 9.3. 2.0 ml of 1 % (w/v) hydroxylamine hydrochloride was added as the reducing agent for the Au precursor along with 10 ml of 4 mg/ml mPEG-SH. 1 ml of the solution was transferred to a cuvette with a 1 cm path length, which was inserted into a Cary Varian 3E UV-Vis spectrophotometer. To start the reaction, the desired amount of Au chloride solution (2.5 mg Au/ml) was injected into the cuvette and mixed well. Then the absorbance of the solution at 755 nm was measured at intervals of 0.0016 seconds for 5 minutes. After the absorbance reached a plateau, the absorbance spectrum was measured between 400 and 850 nm.
Coating Au on Iron Oxide Nanoclusters with Addition of Precursor in Iterations or Continuously
The exact above procedure was carried out in a 200 ml beaker with rigorous stirring. The HAuCl4 solution (2.5 mg Au/ml) was divided equally into multiple aliquots for sequential iterations. Each iteration was separated by a 5 minute interval. After the last iteration, the stirred solution was allowed to stand for 30 min to allow for mPEG-SH to coat the Au surfaces. The reaction products were centrifuged at 6,000 rpm for 6 min. The supernatant was decanted and the precipitate was re-dispersed in a dilute mPEG-SH solution (0.2 mg/ml) and bath sonicated for 5 minutes to produce a stable colloidal suspension. For the continuous addition experiments, HAuCl4 at a concentration of 0.5 mg Au/ml was added into the reaction mixture using a syringe pump at a rate of 0.1 ml/s.
Materials Characterization
Dynamic light scattering (DLS) measurements were performed in triplicate on a custom made Brookhaven Instruments ZetaPlus apparatus at a scattering angle of 90° and temperature of 25°C.[73] The concentrations of nanoparticle dispersions were adjusted with DI water to give a signal count rate between 300–400 kcps. Prior to DLS measurements, the samples were bath sonicated for 2 minutes. The autocorrelation functions were analyzed with a non-negative least-squares (NNLS) method to determine distributions by volume.
Low resolution TEM was performed on a FEI Tecnai Spirit BioTwin at an accelerating voltage of 80 kV. High resolution TEM was performed on a field emission JEOL2010F at 200 kV accelerating voltage. The dispersion of particles was diluted 40 times and then a drop of it was put on a 400 mesh ultrathin carbon-coated copper TEM grid. Excess liquid was wicked off using a tissue and the grid was allowed to dry in air.
The Au and iron oxide concentrations in the nanoparticle dispersions were obtained with a GBC 908AA flame atomic absorption spectrometer (GBC Scientific Equipment Pty Ltd) equipped with an air-acetylene flame furnace. The signal from Au was recorded at 242.8 nm and iron at 248.3 nm. The instrument was calibrated to measure concentration using Au3+ or Fe3+ standard concentration solutions before every set of measurements. All the measurements were carried on diluted samples so that the concentration of iron or Au in the diluted sample was between 1 and 5 µg/ml.
Thermogravimetric analysis (TGA) was performed using a Perkin–Elmer TGA 7 under nitrogen atmosphere at a gas flow rate of 20 ml/min. Nanoparticle samples were dried to a powder in an oven at 100°C. Then samples were heated up to and held at 100°C in the TGA instrument for 20 minutes to remove any moisture. The samples were heated continuously from 100°C to 800°C at a constant rate of 20°C/min, and then held at 800°C for 30 minutes. Magnetization at 300 K was measured using a superconducting quantum interference device (SQUID) magnetometer (Quantum Design MPMS). The loss in mass due to adsorbed ligand from TGA was taken into account for normalization to the mass of iron oxide.
Supplementary Material
Acknowledgement
This work is supported in part by the STC Program of the National Science Foundation under Agreement CHE-9876674, Welch Foundation (F-1319), NIH RO1 EB008821-01, NIH RO1 CA 143663, NSF CBET-0968038, and Veterans Hospital Administration Merit Grant. Dr. Li Leo Ma acknowledges the partial support from National Natural Science Foundation of China (81000113).
Footnotes
Supporting Information Available
Iron oxide nanocluster synthesis; statistics for the hydrodynamic diameter distributions by DLS; Au-iron oxide nanocluster properties at intermediate stages during iterations; TEM-EDS data for determining the Au/Fe ratio in the coated nanoclusters; Control experiments for Au reduction in the absence of iron oxide; the estimation of centrifugation speed for particle sedimentation; detailed elemental analysis results of Fe and Au before and after centrifugation.
References
- 1.Hirsch LR, Stafford RJ, Bankson JA, Sershen SR, Rivera B, Price RE, Hazle JD, Halas NJ, West JL. Nanoshell-mediated near-infrared thermal therapy of tumors under magnetic resonance guidance. Proc. Nat. Acad. Sci. 2003;100:13549–13554. doi: 10.1073/pnas.2232479100. [DOI] [PMC free article] [PubMed] [Google Scholar]
- 2.Ma LL, Feldman MD, Tam JM, Paranjape AS, Cheruku KK, Larson TA, Tam JO, Ingram DR, Paramita V, Villard JW, Jenkins JT, Wang T, Clarke GD, Asmis R, Sokolov K, Chandrasekar B, Milner TE, Johnston KP. Small Multifunctional Nanoclusters (Nanoroses) for Targeted Cellular Imaging and Therapy. Acs Nano. 2009;3:2686–2696. doi: 10.1021/nn900440e. [DOI] [PMC free article] [PubMed] [Google Scholar]
- 3.Mazumder V, Chi MF, More KL, Sun SH. Core/Shell Pd/FePt Nanoparticles as an Active and Durable Catalyst for the Oxygen Reduction Reaction. Journal of the American Chemical Society. 2010;132:7848–7849. doi: 10.1021/ja1024436. [DOI] [PubMed] [Google Scholar]
- 4.Zhang J, Sasaki K, Sutter E, Adzic RR. Stabilization of platinum oxygen-reduction electrocatalysts using gold clusters. Science. 2007;315:220–222. doi: 10.1126/science.1134569. [DOI] [PubMed] [Google Scholar]
- 5.Anker JN, Hall WP, Lyandres O, Shah NC, Zhao J, Van Duyne RP. Biosensing with plasmonic nanosensors. Nat. Mater. 2008;7:442–453. doi: 10.1038/nmat2162. [DOI] [PubMed] [Google Scholar]
- 6.Stewart ME, Anderton CR, Thompson LB, Maria J, Gray SK, Rogers JA, Nuzzo RG. Nanostructured plasmonic sensors. Chem. Rev. 2008;108:494–521. doi: 10.1021/cr068126n. [DOI] [PubMed] [Google Scholar]
- 7.Lyon JL, Fleming DA, Stone MB, Schiffer P, Williams ME. Synthesis of Fe Oxide Core/Au Shell Nanoparticles by Iterative Hydroxylamine Seeding. Nano Lett. 2004;4:719–723. [Google Scholar]
- 8.Larson TA, Bankson J, Aaron J, Sokolov K. Hybrid plasmonic magnetic nanoparticles as molecular specific agents for MRI/optical imaging and photothermal therapy of cancer cells. Nanotechnology. 2007;18 325101/1-/8. [Google Scholar]
- 9.Aaron JS, Oh J, Larson TA, Kumar S, Milner TE, Sokolov KV. Increased optical contrast in imaging of epidermal growth factor receptor using magnetically actuated hybrid gold/iron oxide nanoparticles. Optics Express. 2006;14:12930–12943. doi: 10.1364/oe.14.012930. [DOI] [PubMed] [Google Scholar]
- 10.Watzky MA, Finke RG. Transition metal nanocluster formation kinetic and mechanistic studies. A new mechanism when hydrogen is the reductant: Slow, continuous nucleation and fast autocatalytic surface growth. Journal of the American Chemical Society. 1997;119:10382–10400. [Google Scholar]
- 11.Ji X, Song X, Li J, Bai Y, Yang W, Peng X. Size Control of Gold Nanocrystals in Citrate Reduction: The Third Role of Citrate. J Am Chem Soc. 2007;129:13939–13948. doi: 10.1021/ja074447k. [DOI] [PubMed] [Google Scholar]
- 12.Brown KR, Natan MJ. Hydroxylamine Seeding of Colloidal Au Nanoparticles in Solution and on Surfaces. Langmuir. 1998;14:726–728. [Google Scholar]
- 13.Brown KR, Walter DG, Natan MJ. Seeding of colloidal Au nanoparticle solutions. 2. Improved control of particle size and shape. Chem Mater. 2000;12:306–313. [Google Scholar]
- 14.Jana NR, Gearheart L, Murphy CJ. Evidence for seed-mediated nucleation in the chemical reduction of gold salts to gold nanoparticles. Chem. Mat. 2001;13:2313–2322. [Google Scholar]
- 15.Yin Y, Alivisatos AP. Colloidal nanocrystal synthesis and the organic-inorganic interface. Nature (London, United Kingdom) 2005;437:664–670. doi: 10.1038/nature04165. [DOI] [PubMed] [Google Scholar]
- 16.Talapin DV, Rogach AL, Haase M, Weller H. Evolution of an ensemble of nanoparticles in a colloidal solution: Theoretical study. J. Phys. Chem. B. 2001;105:12278–12285. [Google Scholar]
- 17.Park J, Joo J, Kwon SG, Jang Y, Hyeon T. Synthesis of monodisperse spherical nanocrystals. Angew Chem Int Edit. 2007;46:4630–4660. doi: 10.1002/anie.200603148. [DOI] [PubMed] [Google Scholar]
- 18.Xia Y, Xiong YJ, Lim B, Skrabalak SE. Shape-Controlled Synthesis of Metal Nanocrystals: Simple Chemistry Meets Complex Physics? Angew Chem Int Edit. 2009;48:60–103. doi: 10.1002/anie.200802248. [DOI] [PMC free article] [PubMed] [Google Scholar]
- 19.Finney EE, Finke RG. Nanocluster nucleation and growth kinetic and mechanistic studies: A review emphasizing transition-metal nanoclusters. J Colloid Interf Sci. 2008;317:351–374. doi: 10.1016/j.jcis.2007.05.092. [DOI] [PubMed] [Google Scholar]
- 20.Skrabalak SE, Chen J, Au L, Lu X, Li X, Xia Y. Gold nanocages for biomedical applications. Adv. Mater. 2007;19:3177–3184. doi: 10.1002/adma.200701972. [DOI] [PMC free article] [PubMed] [Google Scholar]
- 21.Huang X, El-Sayed IH, Qian W, El-Sayed MA. Cancer Cell Imaging and Photothermal Therapy in the Near-Infrared Region by Using Gold Nanorods. Journal of the American Chemical Society. 2006;128:2115–2120. doi: 10.1021/ja057254a. [DOI] [PubMed] [Google Scholar]
- 22.Durr NJ, Larson T, Smith DK, Korgel BA, Sokolov K, Ben-Yakar A. Two-photon luminescence imaging of cancer cells using molecularly targeted gold nanorods. Nano Letters. 2007;7:941–945. doi: 10.1021/nl062962v. [DOI] [PMC free article] [PubMed] [Google Scholar]
- 23.Pissuwan D, Valenzuela SM, Killingsworth MC, Xu XD, Cortie MB. Targeted destruction of murine macrophage cells with bioconjugated gold nanorods. J. Nanopart. Res. 2007;9:1109–1124. [Google Scholar]
- 24.Qiu L, Larson TA, Smith DK, Vitkin E, Zhang SH, Modell MD, Itzkan I, Hanlon EB, Korgel BA, Sokolov KV, Perelman LT. Single gold nanorod detection using confocal light absorption and scattering spectroscopy. Ieee Journal of Selected Topics in Quantum Electronics. 2007;13:1730–1738. [Google Scholar]
- 25.Zhu J, Yong KT, Roy I, Hu R, Ding H, Zhao LL, Swihart MT, He GS, Cui YP, Prasad PN. Additive controlled synthesis of gold nanorods (GNRs) for two-photon luminescence imaging of cancer cells. Nanotechnology. 2010;21 doi: 10.1088/0957-4484/21/28/285106. [DOI] [PubMed] [Google Scholar]
- 26.Shankar SS, Rai A, Ankamwar B, Singh A, Ahmad A, Sastry M. Biological synthesis of triangular gold nanoprisms. Nat Mater. 2004;3:482–488. doi: 10.1038/nmat1152. [DOI] [PubMed] [Google Scholar]
- 27.Kuo CH, Huang MH. Synthesis of branched gold nanocrystals by a seeding growth approach. Langmuir. 2005;21:2012–2016. doi: 10.1021/la0476332. [DOI] [PubMed] [Google Scholar]
- 28.Van de Broek B, Frederix F, Bonroy K, Jans H, Jans K, Borghs G, Maes G. Shape-controlled synthesis of NIR absorbing branched gold nanoparticles and morphology stabilization with alkanethiols. Nanotechnology. 2011;22 doi: 10.1088/0957-4484/22/1/015601. [DOI] [PubMed] [Google Scholar]
- 29.Zou XQ, Ying EB, Dong SJ. Seed-mediated synthesis of branched gold nanoparticles with the assistance of citrate and their surface-enhanced Raman scattering properties. Nanotechnology. 2006;17:4758–4764. doi: 10.1088/0957-4484/17/18/038. [DOI] [PubMed] [Google Scholar]
- 30.Barbosa S, Agrawal A, Rodriguez-Lorenzo L, Pastoriza-Santos I, Alvarez-Puebla RA, Kornowski A, Weller H, Liz-Marzan LM. Tuning Size and Sensing Properties in Colloidal Gold Nanostars. Langmuir. 2010;26:14943–14950. doi: 10.1021/la102559e. [DOI] [PubMed] [Google Scholar]
- 31.Nehl CL, Liao HW, Hafner JH. Optical properties of star-shaped gold nanoparticles. Nano Letters. 2006;6:683–688. doi: 10.1021/nl052409y. [DOI] [PubMed] [Google Scholar]
- 32.Senapati D, Singh AK, Ray PC. Real time monitoring of the shape evolution of branched gold nanostructure. Chemical Physics Letters. 2010;487:88–91. [Google Scholar]
- 33.Lu LH, Ai K, Ozaki Y. Environmentally friendly synthesis of highly monodisperse biocompatible gold nanoparticles with urchin-like shape. Langmuir. 2008;24:1058–1063. doi: 10.1021/la702886q. [DOI] [PubMed] [Google Scholar]
- 34.Wang ZD, Zhang JQ, Ekman JM, Kenis PJA, Lu Y. DNA-Mediated Control of Metal Nanoparticle Shape: One-Pot Synthesis and Cellular Uptake of Highly Stable and Functional Gold Nanoflowers. Nano Letters. 2010;10:1886–1891. doi: 10.1021/nl100675p. [DOI] [PubMed] [Google Scholar]
- 35.Jeong U, Teng X, Wang Y, Yang H, Xia Y. Superparamagnetic colloids: controlled synthesis and niche applications. Advanced Materials (Weinheim, Germany) 2007;19:33–60. [Google Scholar]
- 36.Zeng H, Sun S. Syntheses, Properties, and Potential Applications of Multicomponent Magnetic Nanoparticles. Advanced Functional Materials. 2008;18:391–400. [Google Scholar]
- 37.Lim J, Tilton RD, Eggeman A, Majetich SA. Design and synthesis of plasmonic magnetic nanoparticles. Journal of Magnetism and Magnetic Materials. 2007;311:78–83. [Google Scholar]
- 38.Yu H, Chen M, Rice PM, Wang SX, White RL, Sun SH. Dumbbell-like bifunctional Au-Fe3O4 nanoparticles. Nano Lett. 2005;5:379–382. doi: 10.1021/nl047955q. [DOI] [PubMed] [Google Scholar]
- 39.Shevchenko EV, Bodnarchuk MI, Kovalenko MV, Talapin DV, Smith RK, Aloni S, Heiss W, Alivisatos AP. Gold/iron oxide core/hollow-shell nanoparticles. Advanced Materials (Weinheim, Germany) 2008;20:4323–4329. [Google Scholar]
- 40.Park H-Y, Schadt MJ, Wang L, Lim IIS, Njoki PN, Kim SH, Jang M-Y, Luo J, Zhong C-J. Fabrication of Magnetic Core@Shell Fe Oxide@Au Nanoparticles for Interfacial Bioactivity and Bio-separation. Langmuir. 2007;23:9050–9056. doi: 10.1021/la701305f. [DOI] [PubMed] [Google Scholar]
- 41.Xu Z, Hou Y, Sun S. Magnetic Core/Shell Fe3O4/Au and Fe3O4/Au/Ag Nanoparticles with Tunable Plasmonic Properties. J Am Chem Soc. 2007;129:8698–8699. doi: 10.1021/ja073057v. [DOI] [PubMed] [Google Scholar]
- 42.Hostetler MJ, Wingate JE, Zhong CJ, Harris JE, Vachet RW, Clark MR, Londono JD, Green SJ, Stokes JJ, Wignall GD, Glish GL, Porter MD, Evans ND, Murray RW. Alkanethiolate gold cluster molecules with core diameters from 1.5 to 5.2 nm: Core and monolayer properties as a function of core size. Langmuir. 1998;14:17–30. [Google Scholar]
- 43.Leff DV, Ohara PC, Heath JR, Gelbart WM. Thermodynamic Control of Gold Nanocrystal Size - Experiment and Theory. J Phys Chem-Us. 1995;99:7036–7041. [Google Scholar]
- 44.Wang L, Luo J, Fan Q, Suzuki M, Suzuki IS, Engelhard MH, Lin Y, Kim N, Wang JQ, Zhong C-J. Monodispersed Core-Shell Fe3O4@Au Nanoparticles. J Phys Chem B. 2005;109:21593–21601. doi: 10.1021/jp0543429. [DOI] [PubMed] [Google Scholar]
- 45.Rasch MR, Sokolov KV, Korgel BA. Limitations on the Optical Tunability of Small Diameter Gold Nanoshells. Langmuir. 2009;25:11777–11785. doi: 10.1021/la901249j. [DOI] [PMC free article] [PubMed] [Google Scholar]
- 46.Oh J, Feldman MD, Kim J, Condit C, Emelianov S, Milner TE. Detection of magnetic nanoparticles in tissue using magneto-motive ultrasound. Nanotechnology. 2006;17:4183–4190. doi: 10.1088/0957-4484/17/16/031. [DOI] [PubMed] [Google Scholar]
- 47.Bhana S, Rai BK, Mishra SR, Wang Y, Huang X. Synthesis and properties of near infrared-absorbing magnetic-optical nanopins. Nanoscale. 2012;4:4939–4942. doi: 10.1039/c2nr31291c. [DOI] [PubMed] [Google Scholar]
- 48.Levin CS, Hofmann C, Ali TA, Kelly AT, Morosan E, Nordlander P, Whitmire KH, Halas NJ. Magnetic-Plasmonic Core-Shell Nanoparticles. Acs Nano. 2009;3:1379–1388. doi: 10.1021/nn900118a. [DOI] [PMC free article] [PubMed] [Google Scholar]
- 49.Wang H, Brandl DW, Le F, Nordlander P, Halas NJ. Nanorice: A Hybrid Plasmonic Nanostructure. Nano Lett. 2006;6:827–832. doi: 10.1021/nl060209w. [DOI] [PubMed] [Google Scholar]
- 50.Goon IY, Lai LMH, Lim M, Munroe P, Gooding JJ, Amal R. Fabrication and Dispersion of Gold-Shell-Protected Magnetite Nanoparticles: Systematic Control Using Polyethyleneimine. Chem Mater. 2009;21:673–681. [Google Scholar]
- 51.Lim JK, Majetich SA, Tilton RD. Stabilization of Superparamagnetic Iron Oxide Core-Gold Shell Nanoparticles in High Ionic Strength Media. Langmuir. 2009;25:13384–13393. doi: 10.1021/la9019734. [DOI] [PubMed] [Google Scholar]
- 52.Lim J, Eggeman A, Lanni F, Tilton RD, Majetich SA. Synthesis and single-particle optical detection of low-polydispersity plasmonic-superparamagnetic nanoparticles. Adv Mater. 2008;20:1721–1726. [Google Scholar]
- 53.Oldenburg SJ, Averitt RD, Westcott SL, Halas NJ. Nanoengineering of optical resonances. Chem. Phys. Lett. 1998;288:243–247. [Google Scholar]
- 54.Kumar S, Aaron J, Sokolov K. Directional conjugation of antibodies to nanoparticles for synthesis of multiplexed optical contrast agents with both delivery and targeting moieties. Nat. Protocols. 2008;3:314–320. doi: 10.1038/nprot.2008.1. [DOI] [PubMed] [Google Scholar]
- 55.Knight MW, Halas NJ. Nanoshells to nanoeggs to nanocups: optical properties of reduced symmetry core-shell nanoparticles beyond the quasistatic limit. New Journal of Physics. 2008;10 [Google Scholar]
- 56.Hu Y, Noelck SJ, Drezek RA. Symmetry Breaking in Gold-Silica-Gold Multilayer Nanoshells. Acs Nano. 2010;4:1521–1528. doi: 10.1021/nn901743m. [DOI] [PubMed] [Google Scholar]
- 57.Averitt RD, Westcott SL, Halas NJ. Linear optical properties of gold nanoshells. J Opt Soc Am B. 1999;16:1824–1832. [Google Scholar]
- 58.Wu DJ, Xu XD, Liu XJ. Influence of dielectric core, embedding medium and size on the optical properties of gold nanoshells. Solid State Communications. 2008;146:7–11. [Google Scholar]
- 59.Prodan E, Nordlander P, Halas NJ. Electronic structure and optical properties of gold nanoshells. Nano Lett. 2003;3:1411–1415. [Google Scholar]
- 60.Shah J, Park S, Aglyamov S, Larson T, Ma L, Sokolov K, Johnston K, Milner T, Emelianov Stanislav Y. Photoacoustic imaging and temperature measurement for photothermal cancer therapy. J. Biomed. Opt. 2008;13:034024. doi: 10.1117/1.294036. [DOI] [PMC free article] [PubMed] [Google Scholar]
- 61.Paranjape AS, Kuranov R, Baranov S, Ma LL, Villard JW, Wang T, Konstantin S, Feldman MD, Johnston KP, Milner TE. Depth resolved photothermal OCT detection of macrophages in tissue using nanorose. Biomedical Optics Express. 2010;1:2–16. doi: 10.1364/BOE.1.000002. [DOI] [PMC free article] [PubMed] [Google Scholar]
- 62.Mehrmohammadi M, Oh J, Ma L, Yantsen E, Larson T, Mallidi S, Park S, Johnston KP, Sokolov K, Milner T, Emelianov S Ieee. 2007 Ieee Ultrasonics Symposium Proceedings. Vols 1–6. New York: Ieee; 2007. pp. 652–655. [Google Scholar]
- 63.Qu M, Mallidi S, Mehrmohammadi M, Ma LL, Johnston KP, Sokolov K, Emelianov S. Combined photoacoustic and magneto-acoustic imaging. Conf Proc IEEE Eng Med Biol Soc. 2009;2009:4763–4766. doi: 10.1109/IEMBS.2009.5334217. [DOI] [PubMed] [Google Scholar]
- 64.Ferrari M. Beyond drug delivery. Nature Nanotechnology. 2008;3:131–132. doi: 10.1038/nnano.2008.46. [DOI] [PubMed] [Google Scholar]
- 65.Jiang W, Kim BYS, Rutka JT, Chan WCW. Nanoparticle-mediated cellular response is size-dependent. Nature Nanotechnology. 2008;3:145–150. doi: 10.1038/nnano.2008.30. [DOI] [PubMed] [Google Scholar]
- 66.Caruntu D, Cushing BL, Caruntu G, O'Connor CJ. Attachment of Gold Nanograins onto Colloidal Magnetite Nanocrystals. Chem Mater. 2005;17:3398–3402. [Google Scholar]
- 67.Lo CK, Xiao D, Choi MMF. Homocysteine-protected gold-coated magnetic nanoparticles: synthesis and characterization. Journal of Materials Chemistry. 2007;17:2418–2427. [Google Scholar]
- 68.Mandal M, Kundu S, Ghosh SK, Panigrahi S, Sau TK, Yusuf SM, Pal T. Magnetite nanoparticles with tunable gold or silver shell. J Colloid Interf Sci. 2005;286:187–194. doi: 10.1016/j.jcis.2005.01.013. [DOI] [PubMed] [Google Scholar]
- 69.Hiemenz PC, Rajagopalan R. Principles of Colloid and Surface Chemistry. New York: Marcel Dekker, Inc; 1997. [Google Scholar]
- 70.Weissleder R. Molecular Imaging in Cancer. Science. 2006;312:1168–1171. doi: 10.1126/science.1125949. [DOI] [PubMed] [Google Scholar]
- 71.Josephson L, Kircher MF, Mahmood U, Tang Y, Weissleder R. Near-Infrared Fluorescent Nanoparticles as Combined MR/Optical Imaging Probes. Bioconjugate Chemistry. 2002;13:554–560. doi: 10.1021/bc015555d. [DOI] [PubMed] [Google Scholar]
- 72.Sahoo Y, Goodarzi A, Swihart MT, Ohulchanskyy TY, Kaur N, Furlani EP, Prasad PN. Aqueous Ferrofluid of Magnetite Nanoparticles: Fluorescence Labeling and Magnetophoretic Control. J Phys Chem B. 2005;109:3879–3885. doi: 10.1021/jp045402y. [DOI] [PubMed] [Google Scholar]
- 73.Ryoo W, Webber SE, Johnston KP. Water-in-Carbon Dioxide Microemulsions with Methylated Branched Hydrocarbon Surfactants. Industrial & Engineering Chemistry Research. 2003;42:6348–6358. [Google Scholar]
Associated Data
This section collects any data citations, data availability statements, or supplementary materials included in this article.


