

Abstract
Alemtuzumab is a humanized monoclonal antibody specific for the CD52 protein present at high levels on the surface of B and T lymphocytes. In clinical trials, alemtuzumab has shown a clinical benefit superior to that of interferon-β in relapsing–remitting multiple sclerosis patients. Treatment with alemtuzumab leads to the depletion of circulating lymphocytes followed by a repopulation process characterized by alterations in the number, proportions and properties of lymphocyte subsets. Of particular interest, an increase in the percentage of T cells with a regulatory phenotype (Treg cells) has been observed in multiple sclerosis patients after alemtuzumab. Since Treg cells play an important role in the control of autoimmune responses, the effect of alemtuzumab on Treg cells was further studied in vitro. Alemtuzumab effectively mediated complement-dependent cytolysis of human T lymphocytes and the remaining population was enriched in T cells with a regulatory phenotype. The alemtuzumab-exposed T cells displayed functional regulatory characteristics including anergy to stimulation with allogeneic dendritic cells and ability to suppress the allogeneic response of autologous T cells. Consistent with the observed increase in Treg cell frequency, the CD25hi T-cell population was necessary for the suppressive activity of alemtuzumab-exposed T cells. The mechanism of this suppression was found to be dependent on both cell–cell contact and interleukin-2 consumption. These findings suggest that an alemtuzumab-mediated increase in the proportion of Treg cells may play a role in promoting the long-term efficacy of alemtuzumab in patients with multiple sclerosis.
Keywords: alemtuzumab, immune regulation, multiple sclerosis, regulatory T cells
Introduction
Alemtuzumab is a humanized monoclonal antibody specific for human CD52,1 a 12-amino-acid glycoprotein tethered to the outer layer of the cell membrane via a glycosylphosphatidylinositol anchor.2 The C-terminal portion of the protein and part of the glycosylphosphatidylinositol anchor comprise the epitope recognized by alemtuzumab.3 CD52 is expressed at high levels on the surface of T and B lymphocytes and at lower levels on natural killer cells, monocytes and macrophages.4,5 There is little or no CD52 on neutrophils, plasma cells or bone marrow stem cells.4–11 The exact biological function of CD52 remains unclear but reports have suggested that CD52 may play a role in cell–cell interactions as well as in T-cell migration or co-stimulation.12–14 Treatment with alemtuzumab results in the depletion of lymphocytes through several mechanisms including cellular and complement-mediated cytolysis and induction of apoptosis.15–19
Recent phase 3 clinical trials in relapsing–remitting multiple sclerosis (MS) have indicated that alemtuzumab administered as two annual courses of treatment (12 mg intravenous on 5 consecutive days at study start and 3 days a year later) provided a greater clinical benefit than interferon-β1a (IFN-β1a) administered three times per week (44 μg subcutaneously) in both treatment-naive patients20 and in patients who relapsed on previous therapy.21 In addition, long-term follow up of patients from a phase 2 study (CAMMS223) suggested that the impact of alemtuzumab is long-lasting as it lowered the risk of sustained accumulation of disability by 72% and the rate of relapse by 69% compared with IFN-β1a for up to 4 years after the last treatment.22 The mechanism by which alemtuzumab exerts its therapeutic effect in MS is not fully understood but may involve rebalancing of the immune system through the depletion and repopulation of lymphocytes. In clinical studies, the administration of alemtuzumab results in rapid depletion of lymphocytes from the circulation, which may reduce the inflammatory processes associated with MS.23 This is followed by a distinctive pattern of lymphocyte repopulation with B cells returning to baseline levels within 6 months and T-cell counts rising more slowly, generally approaching the lower limit of normal levels by 12 months post-treatment.24 Clinical research findings suggest that alemtuzumab alters the number, proportions and properties of lymphocyte subsets during the repopulation process including an enrichment in regulatory T (Treg) cells25–29 and a shift in T-cell cytokine profile characterized by a decrease in the production of the pro-inflammatory cytokines IFN-γ and interleukin-17 (IL-17) and an increase in the anti-inflammatory cytokines IL-4, IL-10 and transforming growth factor-β (TGF-β).26,29 Such changes may lead to a rebalancing of the immune system that persists long after clearance of the antibody and which may contribute to the observed therapeutic benefit in MS patients.
The increase in the percentage of T cells with a regulatory phenotype observed post-alemtuzumab is of particular interest as Treg cells are considered to be important regulators of the immune system.30 Treg cells are anergic and function by suppressing T-cell responses in a dose-dependent manner31 suggesting a potential impact of changes in the ratio of Treg cells to effector T cells. Initially identified by high expression of the IL-2 receptor (CD25) on the cell surface, Treg cells are also characterized by expression of the nuclear transcription factor Forkhead box protein 3 (Foxp3). Foxp3 expression correlates with suppressive activity32 and mutations in Foxp3 result in severe autoimmune disease in both humans and mice.33–36 Importantly, several clinical studies have described a Treg cell deficit in MS patients in terms of frequency or function.37–41 Studies in animal models of experimentally induced MS also support the importance of Treg cells in central nervous system inflammation (reviewed in ref. 42).
Since observations so far have been limited to phenotypic profiling of Treg cell surface markers post-alemtuzumab, in vitro functional studies with human T cells were conducted to determine whether T cells treated with alemtuzumab and complement display regulatory activity. Enrichment in T cells with a regulatory phenotype was also observed in vitro and the cells displayed the functional characteristics of Treg cells such as anergy to allogeneic stimulation and ability to suppress autologous T cells through both contact-dependent and contact-independent mechanisms.
Materials and methods
Cell preparations
Peripheral blood mononuclear cells (PBMCs) from consenting normal donors were isolated by Ficoll density centrifugation from peripheral blood. T cells were enriched from PBMCs by negative selection with the Easysep T-cell enrichment kit (Stemcell Technologies,Vancouver, Canada). Stimulator dendritic cells (DCs) from a different donor were prepared as previously described,43 and stored frozen. For consistency in stimulation, the same batch of DCs was used throughout the study.
Complement-dependent cytolysis assay
Enriched T cells were incubated for 1 hr at 37° with 10 μg/ml alemtuzumab or control human IgG (Jackson ImmunoResearch, West Grove, PA) and 10% (volume/volume) normal human complement (Quidel, San Diego, CA) at 2·5 x 106 cells/ml in complete AIM-V medium (AIM-V supplemented with 10% fetal bovine serum, 100 units/ml penicillin-streptomycin, 2 mM glutamine and 50 μm β-mercaptoethanol; Life Technologies, Grand Island, NY). At the end of the incubation period, the cells were washed and resuspended in complete AIM-V medium for flow cytometry analysis or functional assays.
Flow cytometry analysis
Samples were stained on ice with an antibody cocktail to cell surface markers (CD3, CD4, CD8, CD127 and CD25) (eBioscience, San Diego, CA) in PBS with 5% fetal bovine serum, then washed in phosphate-buffered saline (PBS) and resuspended in protein-free PBS containing live/dead fixable blue dead cell staining dye (Life Technologies). Intracellular Foxp3 staining was performed following manufacturer's instructions (eBioscience). Samples were acquired using an LSRII flow cytometer (BD Biosciences, San Jose, CA) and data were analysed using flowjo software v.7·6·5 (Tree Star, Ashland, OR). The live gate was used to select the cells for analysis (the same gate was used in both control IgG and alemtuzumab-treated samples).
Cell sorting experiments
Enriched T cells from normal donors were labelled with fluorescent dye-conjugated antibodies to CD25 and CD3. As regulatory T cells express high levels of CD25, the top 10–12% of the CD3 cells that stained for CD25, were removed by sorting on a FACSAria II, and the remaining enriched CD25lo population (CD25−) was collected. CD25− cells or unsorted T cells were treated with alemtuzumab or control IgG and complement as described above and used as suppressors in mixed lymphocyte reaction (MLR) assays or analysed by flow cytometry to determine purity (on average 0·6% of the CD4 T cells in the CD25− group expressed Foxp3).
Mixed lymphocyte reaction
An MLR was used to evaluate the ability of alemtuzumab-exposed T cells to respond to allogeneic stimulation or to inhibit the response of autologous T cells to allogeneic DC stimulation. Allogeneic DCs were irradiated and used as stimulators at a 1 : 10 ratio to the total number of cells in the well. Untreated T cells or T cells exposed to complement and alemtuzumab or control IgG were plated at 50 000 viable cells per well. In suppression MLR assays, alemtuzumab or control IgG-exposed T cells (suppressors) were added to autologous untreated T cells (responders) at an equal ratio. To account for the number of dead cells present along with the live alemtuzumab-exposed cells, total cell numbers in the wells of the control groups were normalized by supplementing with irradiated autologous donor PBMCs. The irradiated cells alone did not proliferate significantly in response to allogeneic stimulation – typically ∼ 1000 counts/minute (cpm). Cultures were incubated in complete AIM-V medium in 96-well plates for 5 days. In some experiments, 100 μg/ml anti-human TGF-β (GC-1008 Fab, Genzyme, Cambridge, MA) or 50 IU/ml recombinant human IL-2 (eBioscience) was added to the suppression assays at initiation and after 72 hr. To evaluate the cell–cell contact dependency of suppression, some MLR assays were performed in 0·4 μm Corning HTS transwell plates (Sigma, St Louis, MO). In these assays, 50 000 live responder T cells were cultured in the lower wells together with stimulator allogeneic DCs while alemtuzumab or control IgG-exposed suppressors were incubated with allogeneic DCs in the transwell insert. In mixed culture controls, all cells were incubated in the lower wells. In all MLR assays, proliferation was measured after 5 days of culture by addition of 0·5–1 μCi [3H]thymidine (Perkin Elmer, Waltham, MA) to the bottom wells for 8–18 hr. Cells were then harvested onto filter plates and incorporated [3H]thymidine was measured with a Wallac microbeta counter (Perkin Elmer). Values of cpm were exported into Excel and analysed in graphpad prism software v5 (GraphPad Software Inc., San Diego, CA).
Statistical analysis
Data analysis was performed using graphpad prism software v5 (GraphPad Software Inc.), and data are presented as mean ± SEM cpm. Unpaired t-tests were used to determine the P value (P ≤ 0·05 was considered statistically significant).
Results
Complement-dependent cytolysis by alemtuzumab in vitro results in an increase in the percentage of CD4 T cells with a FoxP3+ regulatory phenotype
Treatment of MS patients and human CD52 transgenic mice with alemtuzumab results in an increase in the percentage of T cells with a regulatory phenotype (Treg cells).16,26 To study this phenomenon in vitro, purified human T cells were exposed to alemtuzumab or control human IgG in the presence of complement to induce complement-dependent cytolysis, one of the mechanisms involved in lymphocyte depletion by alemtuzumab.4,44 The cultures were then analysed by flow cytometry to assess the frequency of CD4+ T cells expressing Foxp3+. Results obtained with 11 separate donors indicated that, while exposure to alemtuzumab and complement resulted in a marked overall depletion of CD4+ T cells, the frequency of Foxp3-expressing cells in the remaining live CD4+ T-cell population was significantly increased compared with that observed with control IgG (Fig. 1) (P < 0·0001). The mean percentage of Foxp3+ CD4+ T cells was 46·5 ± 3·9% in the alemtuzumab-exposed group compared with 3·8 ± 0·4% in the control IgG group, amounting to an average 13-fold increase in the frequency of T cells with a regulatory phenotype. The CD4+ FoxP3+ T-cell population was also evaluated for additional Treg cell markers including CD25 and CD127. As expected, these cells also expressed high levels of CD25 and low levels of CD127, consistent with a Treg cell phenotype (data not shown). These results indicate that the increased ratio of CD4+ Treg cells observed post-alemtuzumab in vivo can be reproduced in vitro.
Figure 1.
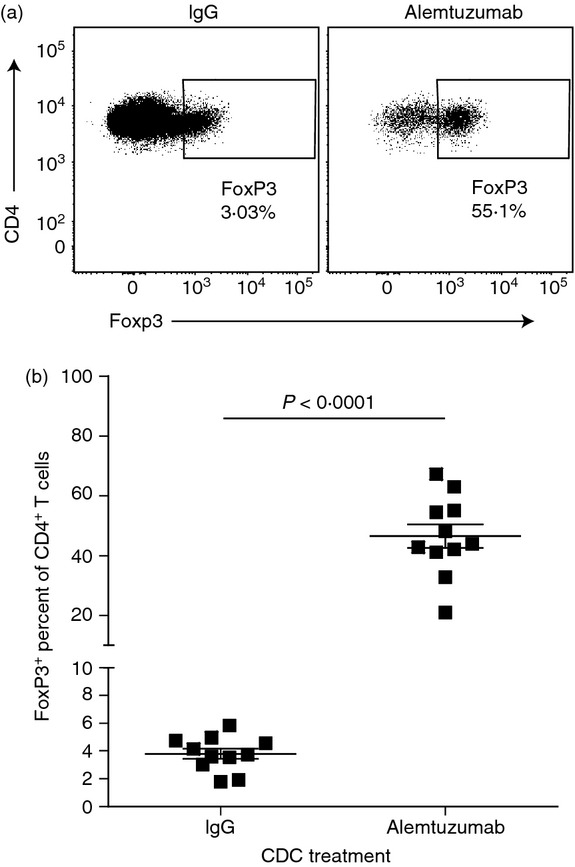
Alemtuzumab and complement treatment results in the enhanced frequency of Foxp3+ cells in the live CD4 T-cell population. Enriched human T cells were exposed in vitro to complement and 10 μg/ml alemtuzumab or control IgG and then stained for cell surface markers, live dead exclusion dye and Foxp3. (a) Representative dot plots of the frequency of Foxp3+ cells in the live CD4 T-cell population of control IgG or alemtuzumab -exposed T cells. (b) Graph representing the frequency of Foxp3+ cells in the live CD4 T-cell population of control IgG or alemtuzumab-exposed T cells (n = 11 donors).
Alemtuzumab-exposed T cells display functional Treg cell characteristics
To determine whether the observed increase in T cells with a regulatory phenotype also correlated with an increase in Treg cell function, the activity of alemtuzumab-exposed T cells was tested in standard Treg cell assays (n = 6 donors). First, equal numbers of live cells from cultures exposed to alemtuzumab or control human IgG and complement, as well as untreated T cells, were compared for their ability to respond to stimulation with allogeneic DCs in a MLR. The proliferative response was measured by [3H]thymidine incorporation after 5 days of culture. As expected, control IgG-exposed T cells and untreated T cells proliferated strongly in response to stimulation with allogeneic DCs (64 327 ± 6748 and 63 678 ± 6575 cpm, respectively) (Fig 2a). In contrast, alemtuzumab-exposed T cells showed background levels of proliferation when stimulated with allogeneic DCs (1278 ± 327 cpm). These results indicate that alemtuzumab-exposed CD4+ T cells are largely anergic to allogeneic stimulation.
Figure 2.
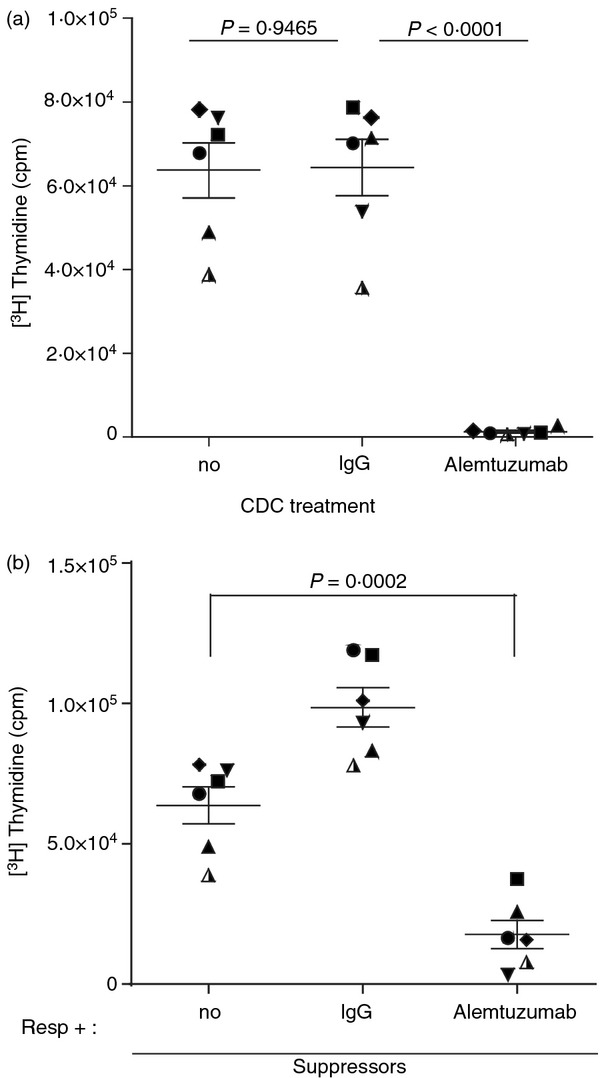
Alemtuzumab-exposed T cells are characterized by anergy and suppression of responses of autologous T cells to allogeneic dendritic cells (DCs). Purified T cells exposed to alemtuzumab or IgG and complement were incubated with allogeneic DCs in a mixed lymphocyte reaction (a), or co-cultured with allogeneic DCs and autologous T cells at 1 : 1 ratio to assess their suppressive activity (b). Proliferation was determined by [3H]thymidine incorporation after 5 days of culture. Symbols represent the mean counts/min (cpm) of triplicate wells from each individual donor, and lines represent the mean ± SEM of six donors.
Next, the suppressive activity of alemtuzumab-exposed T cells was also tested in mixed lymphocyte cultures. In these studies, alemtuzumab- or control IgG-exposed T cells were incubated with autologous responder T cells at a ratio of 1 : 1 and the cultures were stimulated with allogeneic DCs. Cultures of responder T cells alone were also stimulated with allogeneic DCs as an additional control. Proliferation was measured after 5 days of incubation. As shown in Fig. 2(b), responder T cells cultured with autologous alemtuzumab-exposed T cells showed significantly reduced levels of proliferation in response to allogeneic stimulation when compared with responder T cells incubated alone (17 734 ± 5041 versus 63 678 ± 6575 cpm, respectively; P = 0·0002). By comparison, co-cultures of responder T cells and control IgG-exposed T cells actually displayed greater levels of proliferation compared with responder T cells alone (98 530 ± 6986 cpm) reflecting the combined proliferative response of both cell populations. These results indicate that T-cell cultures exposed to alemtuzumab not only show an increase in the percentage of cells with a Treg phenotype (FoxP3+) but also display regulatory activity as evidenced by their anergy to allogeneic stimulation and ability to suppress the response of autologous T cells.
CD25hi T cells are required for suppression
Enriched T-cell cultures exposed to alemtuzumab and complement display an average of 46·5% T cells with a regulatory phenotype (Fig 1) and therefore contain other cell types that could potentially contribute to the suppressive activity of the cultures. To confirm the contribution of Treg cells, CD3+ CD25hi T cells (Treg population) were removed by cell sorting before exposure to alemtuzumab or control IgG and complement. The resulting CD25hi-depleted (CD25−) cell population was then compared with an unsorted population for its ability to suppress an MLR as described (Fig. 3a). As observed previously, alemtuzumab-exposed T cells mediated significant inhibition of responses compared with the IgG control (Fig 3b; P = 0·0006, n = 3). In contrast, alemtuzumab-exposed T cells depleted of CD3+ CD25hi T cells lost their suppressive activity and behaved in a similar way to control IgG-exposed T cells (Fig. 3b; P = 0·9716, n = 3). These results confirm that the suppressive activity of T-cell cultures exposed to alemtuzumab resides primarily in the Treg cell population. As expected, there was no statistically significant difference in the proliferation obtained with the control IgG-exposed CD25− T suppressor group compared with the unfractionated IgG-exposed T suppressor group (P = 0·131).
Figure 3.
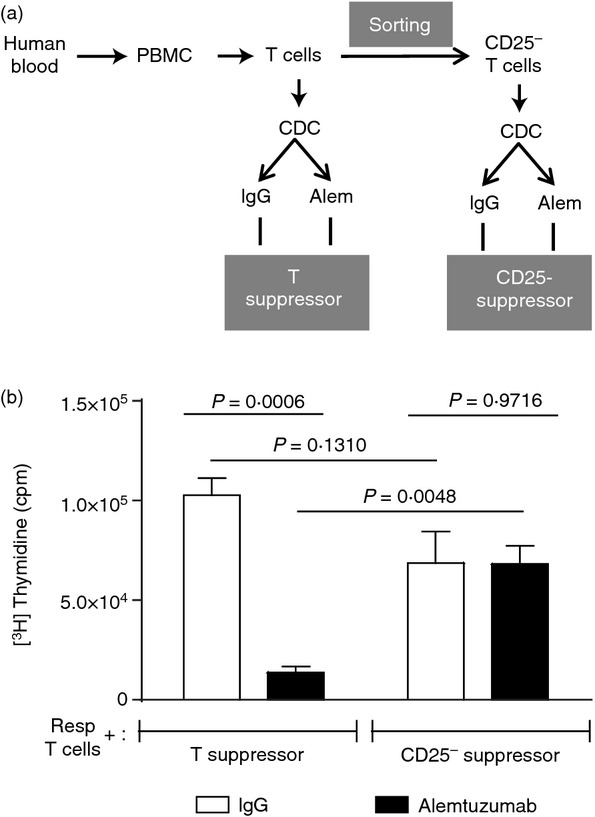
CD25hi T cells are required for suppression. CD25− sorted T cells and total T cells were exposed to alemtuzumab or control IgG + complement and were then incubated at a 1 : 1 ratio with autologous T cells in mixed lymphocyte reaction assays to assess suppressive activity. Proliferation was measured by [3H]thymidine incorporation after 5 days of culture. (a) Schematic representation of the generation of T cells used in the suppressor assay, (b) Bar graphs represent the mean cpm ± SEM of three individual donors.
Suppression by alemtuzumab-exposed T cells is mediated by both contact-dependent and contact-independent mechanisms
Next, we sought to characterize the mechanism by which alemtuzumab-exposed T cells mediate their suppressive activity. Treg cells have been reported to exert their suppressive function through both contact-dependent mechanisms and through soluble factors.45,46 In a first set of studies, the contact dependence of the suppression was investigated using a transwell system whereby responder T cells and stimulatory allogeneic DCs were either cultured in direct contact with alemtuzumab-exposed T cells or were separated by a transwell membrane. As shown in Fig 4(a), there was strong suppression of the proliferation of responder T cells cultured in direct contact with alemtuzumab-exposed T cells (7906 ± 1256 cpm). The suppression was only partially relieved when the cells were separated by a transmembrane (15 714 ± 2515 cpm) and the response did not reach the level of proliferation observed with responder T cells similarly separated from control IgG-exposed T cells (35 517 ± 7876 cpm). As observed previously, direct co-culture of responder T cells and control IgG-exposed T cells resulted in higher levels of proliferation (83 105 ± 3938 cpm), reflecting the ability of both populations to respond to allogeneic stimulation. These results suggest that the suppressive activity of alemtuzumab-exposed T cells is only partially mediated by cell-to-cell contact and that other mechanisms are involved.
Figure 4.
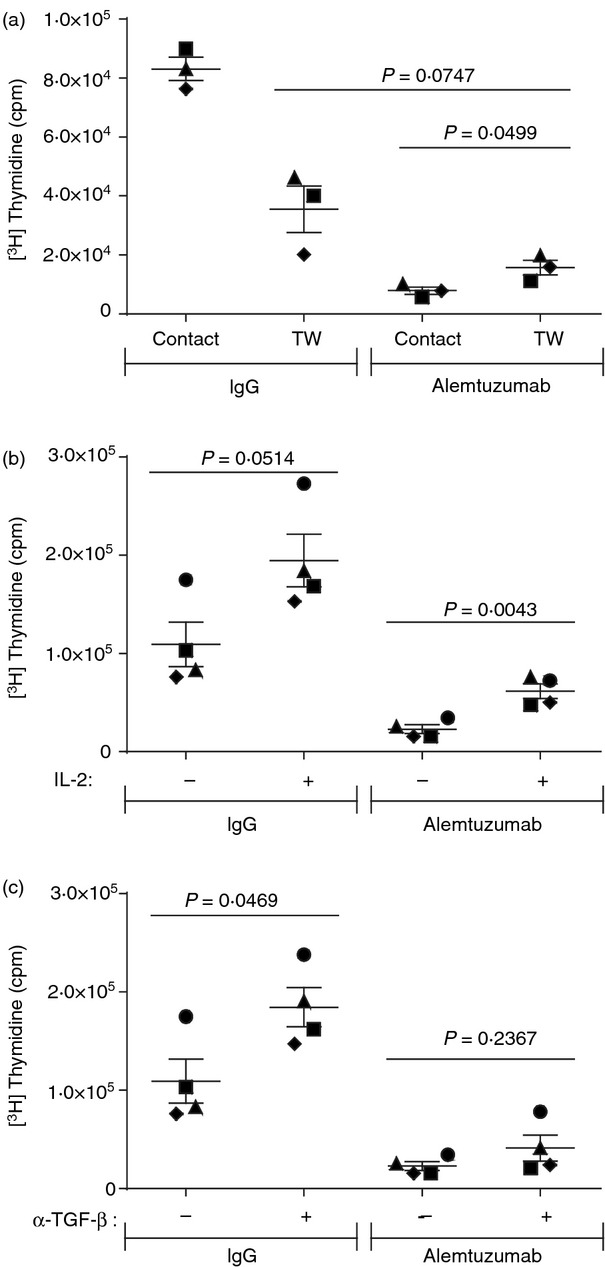
Suppression by alemtuzumab-exposed T cells is mediated by both contact-dependent and contact-independent mechanisms. T cells exposed to alemtuzumab or control IgG and complement were incubated at 1 : 1 ratio with autologous T cells in mixed lymphocyte reaction assays to assess suppressive activity. (a) Contact dependency was tested in transwell plates where responders and suppressors were separated by a transwell membrane (TW) or were mixed together in the lower wells (contact). The contribution of soluble factors was tested in suppression assays with (+) or without (−) addition of 50 IU/ml recombinant human interleukin-2 (IL-2) (b) or 100 μg/ml anti-human transforming growth factor β (TGF-β) Fab (c). Symbols represent the mean counts/min (cpm) value of triplicate wells from individual donors, and the lines represent the mean ± SEM of three or four donors.
Several contact-independent mechanisms have been implicated in the activity of Treg cells, including IL-2 consumption as well as production of anti-inflammatory TGF-β.47 Regulatory T cells express high levels of the IL-2 receptor (CD25hi) such that consumption of IL-2 required for T-cell proliferation can contribute to their suppressive activity.48 The ability of recombinant human IL-2 to reverse the suppression exerted by alemtuzumab-exposed T cells was therefore tested to assess the potential contribution of IL-2 deprivation (Figure 4b). The addition of IL-2 to co-cultures of responder T cells and alemtuzumab-exposed T cells resulted in a statistically significant increase in proliferation compared with non-supplemented control cultures (61 473 ± 7404 versus 22 841 ± 4546 cpm, respectively; P = 0·0043; n = 4). This observation suggests that IL-2 deprivation may play at least a partial role in the suppressive activity of alemtuzumab-exposed T cells. The addition of IL-2 also mediated an increase, although not statistically significant, in the proliferation of co-cultures of responder T cells and control IgG-exposed T cells (194 543 ± 26 884 cpm with IL-2 versus 109 296 ± 22 608 cpm without IL-2; P = 0·0514; n = 4).
Production of TGF-β by Treg cells has also been reported to contribute to their suppressive activity, and we therefore evaluated the impact of TGF-β neutralization on the suppressive activity of alemtuzumab-exposed T cells. The addition of an antibody capable of neutralizing all three isotypes of TGF-β49 to co-cultures of responder T cells and alemtuzumab-exposed T cells failed to significantly increase the level of proliferation (41 099 ± 13 124 cpm with antibody versus 22 841 ± 4546 cpm without antibody; P = 0·2367; n = 4). These results suggest that secretion of TGF-β does not play a significant role in the suppressive activity of alemtuzumab-exposed T cells in this assay. Interestingly, neutralization of TGF-β in co-cultures of responder T cells and control IgG-exposed T cells resulted in a statistically significant increase in proliferation (P = 0·0469; 109 296 ± 22 608 cpm without antibody versus 184 482 ± 19 935 cpm with antibody) suggesting that endogenous production of TGF-β in these cultures limited the magnitude of the proliferative response.
Discussion
Recent clinical studies in MS patients suggest that alemtuzumab can provide a durable clinical benefit extending for several years after the last course of treatment.20–22 While the immediate lymphocyte depletion exerted by alemtuzumab probably contributes to its mechanism of action, disease control is maintained in the face of lymphocyte repopulation, suggesting that fundamental changes are taking place during the repopulation process leading to a potential ‘rebalancing’ of the immune system. Indeed, several alterations in the proportions and properties of lymphocyte subsets have been described in MS patients post-alemtuzumab, which may contribute to its long-term effect. For example, changes in the T-cell cytokine profile from a pro-inflammatory to a less inflammatory pattern, increases in the percentage of T cells with a regulatory phenotype26 and the development of T cells producing neurotrophic factors50 have all been reported and have been hypothesized to play a potential role in the mechanism of action of alemtuzumab. On the other hand, a significant proportion of MS patients treated with alemtuzumab (∼ 30%) have been found to develop secondary autoimmune conditions (primarily thyroid-related) even while experiencing an MS clinical benefit, indicating that individuals do not respond in a homogeneous fashion. In a recent report, soluble CD52 ‘shed’ by activated T cells was described to play an immune suppressive role by binding to Siglec 10 on effector T cells and the authors suggested that depletion of CD52high T cells by alemtuzumab may represent a potential mechanism for the development of secondary autoimmunity in MS patients.51 However, under clinical conditions, treatment with alemtuzumab results in the simultaneous depletion of both CD52high T cells as well as CD52+ effectors of autoimmunity, along with an increase in the percentage of conventional regulatory T cells.26 The biological significance of these in vitro findings therefore remains to be determined.
In this study, we have focused on the observed impact of alemtuzumab treatment on the percentage of Treg cells as they are known to play an important role in the control of autoimmunity and Treg cell defects have been reported in MS patients.37–41 In MS clinical trials, T-cell depletion associated with a significant increase in the percentage of Treg cells has been observed by several investigators lasting up to approximately 6 months post-alemtuzumab and generally returning to baseline levels by 9 months.26,28 The same pattern of increase in Treg cell frequency followed by a gradual return to baseline was also observed after a second course of alemtuzumab at 12 months.28 Interestingly, similar increases in Treg cell frequency lasting up to 2 years have also been reported in the context of kidney transplantation when alemtuzumab was used as a conditioning agent.25 It has been postulated that such changes in the ratio of Treg to T effector (Teff) cells may restore the balance between pathogenic and regulatory T cells and potentially contribute to the long-term control of disease.
To date, profiling of Treg cells in MS patients treated with alemtuzumab has been limited to flow cytometry and staining for characteristic markers. We therefore conducted in vitro studies to assess the functionality of these cells. Treatment of purified human T lymphocytes with alemtuzumab and complement resulted in robust overall lysis of T cells via complement-dependent cytolysis, one of the principal mechanisms of lymphocyte depletion by alemtuzumab.4,44 Interestingly, FoxP3+ CD4 T cells were depleted to a lesser extent than other CD4 T cells in the culture, leading to a relative increase in the percentage of Treg cells. This phenomenon mirrors in vivo clinical observations and was reproduced with 11 donors (Fig. 1). A similar increase in the percentage of Treg cells at the nadir of lymphocyte depletion (3 days post-alemtuzumab) was observed in human CD52 transgenic mice, also suggesting that a relative sparing of Treg cells may be occurring.16 In MS clinical studies, patient samples were generally collected 1 month or longer after alemtuzumab exposure, such that the observed increase in the percentage of Treg cells could also result from preferential expansion or de novo generation of these cells in the repopulating immune cells.26,29 The reason for the differential susceptibility of Treg cells to depletion by alemtuzumab in vitro remains unclear. Treg cells appear to express levels of CD52 comparable to those of other T cells.25 Likewise, the expression pattern of the complement inhibitory proteins CD46, CD55 and CD59 on Treg cells did not suggest enhanced protection by these proteins against the complement lysis pathway (unpublished results). In fact, isolated Treg cells (CD127lo/neg) exposed to alemtuzumab and complement were capable of undergoing complete lysis when cultured alone, indicating that they are not intrinsically resistant to complement-dependent cytolysis (results not shown). It is possible that other factors, such as the potentially reduced antibody exposure of this low-frequency population within PBMCs, may play a role. Interestingly, a similar sparing of Treg cells has also been reported in vivo in mice treated with anti-CD3 antibody via an as yet undefined mechanism.52,53
We next determined whether the increased phenotypic ratio of CD4+ Treg cells post-alemtuzumab correlated with an increase in Treg cell function. Treg cells characteristically display anergy to allogeneic stimulation along with the ability to suppress the proliferative response of other T cells in an MLR.31,54,55 The results indicated that alemtuzumab-exposed T cells, in contrast to control IgG-exposed T cells, were in fact anergic and did not proliferate in response to stimulation with allogeneic DCs (Fig 2a). The observed anergy was not a result of a loss of viability and the cells were able to proliferate in response to polyclonal stimulation with anti-CD3 (data not shown). Nor could the lack of response to allogeneic DCs be attributed to the presence of residual alemtuzumab in the assay, because direct addition of alemtuzumab to normal T-cell cultures (in the absence of complement) did not affect proliferation.56 Finally, alemtuzumab-exposed T cells were also found to suppress the proliferation of autologous T cells to allogeneic stimulation in mixed lymphocyte cultures consistent with the properties of Treg cells (Fig. 2b). Taken together, these results indicate that the observed increase in the percentage of T cells with a regulatory phenotype post-alemtuzumab is also accompanied by increased regulatory activity. Removal of CD25hi cells from the T-cell population before alemtuzumab treatment resulted in a loss of suppressive activity, confirming that Treg cells are in fact the mediators of suppression in these cultures (Fig 3).
Treg cells can mediate suppression through several mechanisms, including contact-dependent and contact-independent mechanisms such as competition for growth factors and production of inhibitory cytokines.45–47 As reported in previous studies of Treg cells,57,58 the suppressive activity of alemtuzumab-exposed T cells appeared to be in part mediated through cell–cell contact as it was partially reversed when responder cells were separated by a transwell membrane (Fig. 4a). The incomplete reversal of suppression suggested that other contact-independent mechanisms were also involved. Treg cell competition for IL-2, which is required for proliferation of conventional T cells,48,54,59,60 appeared to be a factor as the addition of IL-2 to co-cultures of alemtuzumab-exposed T cells and responder T cells partially relieved suppression and increased proliferation (Fig. 4b). Production of the inhibitory factors TGF-β and IL-10 has also been reported to play a role in the suppressive activity of Treg cells in vivo.45,61 However, in our in vitro setting, antibody neutralization of TGF-β failed to restore proliferation of responder cells cultured with alemtuzumab-exposed T cells. Interestingly, there was a significant increase in proliferation in co-cultures of responder T cells and IgG control-exposed T cells, suggesting that endogenous production TGF-β in these cultures was limiting the potential for proliferation and confirming the neutralizing activity of the antibody. We were unable to detect the presence of IL-10 in our cultures and it is therefore unlikely that this cytokine played a role in suppression (data not shown). While it is possible that other untested pathways may also contribute to the regulatory activity of alemtuzumab-exposed T cells, our results suggest that both contact-dependent and contact-independent mechanisms are involved.
Several immunological changes have been observed to take place during the lymphocyte repopulation process that follows alemtuzumab treatment. Although the biological significance of an increase in the percentage of functionally active Treg cells post-alemtuzumab remains to be determined, the importance of Treg cells in controlling autoimmunity is well-described. An increase in the Treg/Teff ratio at a crucial time during lymphocyte repopulation could conceivably play a role in promoting the long-term control of disease in MS patients.
Acknowledgments
The authors would like to thank Jose Sancho and Jacqueline Saleh for help with flow cytometry, and Rhonda Doll for preparing the dendritic cells used in in vitro assays.
Author contributions
EH and JCR conducted experiments, EH, MJT, SS, THN, BR, WS and JMK contributed to study design, data analysis and interpretation. EH and JMK wrote the manuscript.
Conflicts of interest
Authors are all employees of Genzyme, a Sanofi company.
References
- 1.Flynn JM, Byrd JC. Campath-1H monoclonal antibody therapy. Curr Opin Oncol. 2000;12:574–81. doi: 10.1097/00001622-200011000-00010. [DOI] [PubMed] [Google Scholar]
- 2.Xia MQ, Hale G, Lifely MR, Ferguson MA, Campbell D, Packman L, Waldmann H. Structure of the CAMPATH-1 antigen, a glycosylphosphatidylinositol-anchored glycoprotein which is an exceptionally good target for complement lysis. Biochem J. 1993;293(Pt 3):633–40. doi: 10.1042/bj2930633. [DOI] [PMC free article] [PubMed] [Google Scholar]
- 3.Hale G. Synthetic peptide mimotope of the CAMPATH-1 (CD52) antigen, a small glycosylphosphatidylinositol-anchored glycoprotein. Immunotechnology. 1995;1:175–87. doi: 10.1016/1380-2933(95)00017-8. [DOI] [PubMed] [Google Scholar]
- 4.Rao SP, Sancho J, Campos-Rivera J, et al. Human peripheral blood mononuclear cells exhibit heterogeneous CD52 expression levels and show differential sensitivity to alemtuzumab mediated cytolysis. PLoS ONE. 2012;7:e39416. doi: 10.1371/journal.pone.0039416. [DOI] [PMC free article] [PubMed] [Google Scholar]
- 5.Hale G, Xia MQ, Tighe HP, Dyer MJ, Waldmann H. The CAMPATH-1 antigen (CDw52) Tissue Antigens. 1990;35:118–27. doi: 10.1111/j.1399-0039.1990.tb01767.x. [DOI] [PubMed] [Google Scholar]
- 6.Gilleece MH, Dexter TM. Effect of Campath-1H antibody on human hematopoietic progenitors in vitro. Blood. 1993;82:807–12. [PubMed] [Google Scholar]
- 7.Hale G, Swirsky DM, Hayhoe FG, Waldmann H. Effects of monoclonal anti-lymphocyte antibodies in vivo in monkeys and humans. Mol Biol Med. 1983;1:321–34. [PubMed] [Google Scholar]
- 8.Ginaldi L, De Martinis M, Matutes E, Farahat N, Morilla R, Dyer MJ, Catovsky D. Levels of expression of CD52 in normal and leukemic B and T cells: correlation with in vivo therapeutic responses to Campath-1H. Leuk Res. 1998;22:185–91. doi: 10.1016/s0145-2126(97)00158-6. [DOI] [PubMed] [Google Scholar]
- 9.Klabusay M, Sukova V, Coupek P, Brychtova Y, Mayer J. Different levels of CD52 antigen expression evaluated by quantitative fluorescence cytometry are detected on B-lymphocytes, CD34+ cells and tumor cells of patients with chronic B-cell lymphoproliferative diseases. Cytometry B Clin Cytom. 2007;72:363–70. doi: 10.1002/cyto.b.20181. [DOI] [PubMed] [Google Scholar]
- 10.Jiang L, Yuan CM, Hubacheck J, Janik JE, Wilson W, Morris JC, Jasper GA, Stetler-Stevenson M. Variable CD52 expression in mature T cell and NK cell malignancies: implications for alemtuzumab therapy. Br J Haematol. 2009;145:173–9. doi: 10.1111/j.1365-2141.2009.07606.x. [DOI] [PMC free article] [PubMed] [Google Scholar]
- 11.Ratzinger G, Reagan JL, Heller G, Busam KJ, Young JW. Differential CD52 expression by distinct myeloid dendritic cell subsets: implications for alemtuzumab activity at the level of antigen presentation in allogeneic graft-host interactions in transplantation. Blood. 2003;101:1422–9. doi: 10.1182/blood-2002-04-1093. [DOI] [PubMed] [Google Scholar]
- 12.Masuyama J, Yoshio T, Suzuki K, et al. Characterization of the 4C8 antigen involved in transendothelial migration of CD26hi T cells after tight adhesion to human umbilical vein endothelial cell monolayers. J Exp Med. 1999;189:979–90. doi: 10.1084/jem.189.6.979. [DOI] [PMC free article] [PubMed] [Google Scholar]
- 13.Rowan WC, Hale G, Tite JP, Brett SJ. Cross-linking of the CAMPATH-1 antigen (CD52) triggers activation of normal human T lymphocytes. Int Immunol. 1995;7:69–77. doi: 10.1093/intimm/7.1.69. [DOI] [PubMed] [Google Scholar]
- 14.Watanabe T, Masuyama J, Sohma Y, et al. CD52 is a novel costimulatory molecule for induction of CD4+ regulatory T cells. Clin Immunol. 2006;120:247–59. doi: 10.1016/j.clim.2006.05.006. [DOI] [PubMed] [Google Scholar]
- 15.Boyd PN, Lines AC, Patel AK. The effect of the removal of sialic acid, galactose and total carbohydrate on the functional activity of Campath-1H. Mol Immunol. 1995;32:1311–8. doi: 10.1016/0161-5890(95)00118-2. [DOI] [PubMed] [Google Scholar]
- 16.Hu Y, Turner MJ, Shields J, Gale MS, Hutto E, Roberts BL, Siders WM, Kaplan JM. Investigation of the mechanism of action of alemtuzumab in a human CD52 transgenic mouse model. Immunology. 2009;128:260–70. doi: 10.1111/j.1365-2567.2009.03115.x. [DOI] [PMC free article] [PubMed] [Google Scholar]
- 17.Nguyen TH, Havari E, McLaren R, et al. Alemtuzumab induction of intracellular signaling and apoptosis in malignant B lymphocytes. Leuk Lymphoma. 2012;53:699–709. doi: 10.3109/10428194.2011.623253. [DOI] [PubMed] [Google Scholar]
- 18.Stanglmaier M, Reis S, Hallek M. Rituximab and alemtuzumab induce a nonclassic, caspase-independent apoptotic pathway in B-lymphoid cell lines and in chronic lymphocytic leukemia cells. Ann Hematol. 2004;83:634–45. doi: 10.1007/s00277-004-0917-0. [DOI] [PubMed] [Google Scholar]
- 19.Zent CS, Secreto CR, LaPlant BR, et al. Direct and complement dependent cytotoxicity in CLL cells from patients with high-risk early-intermediate stage chronic lymphocytic leukemia (CLL) treated with alemtuzumab and rituximab. Leuk Res. 2008;32:1849–56. doi: 10.1016/j.leukres.2008.05.014. [DOI] [PMC free article] [PubMed] [Google Scholar]
- 20.Cohen JA, Coles AJ, Arnold DL, et al. Alemtuzumab versus interferon β1a as first-line treatment for patients with relapsing–remitting multiple sclerosis: a randomised controlled phase 3 trial. Lancet. 2012;380:1819–28. doi: 10.1016/S0140-6736(12)61769-3. [DOI] [PubMed] [Google Scholar]
- 21.Coles AJ, Twyman CL, Arnold DL, et al. Alemtuzumab for patients with relapsing multiple sclerosis after disease-modifying therapy: a randomised controlled phase 3 trial. Lancet. 2012;380:1829–39. doi: 10.1016/S0140-6736(12)61768-1. [DOI] [PubMed] [Google Scholar]
- 22.Coles AJ, Fox E, Vladic A, et al. Alemtuzumab more effective than interferon β-1a at 5-year follow-up of CAMMS223 clinical trial. Neurology. 2012;78:1069–78. doi: 10.1212/WNL.0b013e31824e8ee7. [DOI] [PubMed] [Google Scholar]
- 23.Coles AJ, Cox A, Le Page E, et al. The window of therapeutic opportunity in multiple sclerosis: evidence from monoclonal antibody therapy. J Neurol. 2006;253:98–108. doi: 10.1007/s00415-005-0934-5. [DOI] [PubMed] [Google Scholar]
- 24.Hill-Cawthorne GA, Button T, Tuohy O, et al. Long term lymphocyte reconstitution after alemtuzumab treatment of multiple sclerosis. J Neurol Neurosurg Psychiatry. 2012;83:298–304. doi: 10.1136/jnnp-2011-300826. [DOI] [PubMed] [Google Scholar]
- 25.Bloom DD, Chang Z, Fechner JH, Dar W, Polster SP, Pascual J, Turka LA, Knechtle SJ. CD4+ CD25+ FOXP3+ regulatory T cells increase de novo in kidney transplant patients after immunodepletion with Campath-1H. Am J Transplant. 2008;8:793–802. doi: 10.1111/j.1600-6143.2007.02134.x. [DOI] [PubMed] [Google Scholar]
- 26.Cox AL, Thompson SA, Jones JL, Robertson VH, Hale G, Waldmann H, Compston DA, Coles AJ. Lymphocyte homeostasis following therapeutic lymphocyte depletion in multiple sclerosis. Eur J Immunol. 2005;35:3332–42. doi: 10.1002/eji.200535075. [DOI] [PubMed] [Google Scholar]
- 27.De Mercanti S, Clerico M, Rolla S, et al. Treg cell function and related cytokines changes during Alemtuzumab treatment: a 24 months immunological study. San Diego, California: AAN; 2013. [Google Scholar]
- 28.Hartung HP, Arnold DL, Cohen JA, et al. DAS Compston for the CARE-MS I Investigators . Lymphocyte subset dynamics following alemtuzumab treatment in the Care-MS I Study. Lyon, France: ECTRIMS; 2012. [Google Scholar]
- 29.Zhang X, Tao Y, Marcus K, et al. Alemtuzumab (anti-human CD52 mAb) induces expansion of Treg and Th2-cells and decreases frequencies of Th1- and Th17-cells in treated patients with relapsing remitting multiple sclerosis. Louisiana: American Academy of Neurology. New Orleans; 2012. [Google Scholar]
- 30.Sakaguchi S, Sakaguchi N, Asano M, Itoh M, Toda M. Immunologic self-tolerance maintained by activated T cells expressing IL-2 receptor α-chains (CD25). Breakdown of a single mechanism of self-tolerance causes various autoimmune diseases. J Immunol. 1995;155:1151–64. [PubMed] [Google Scholar]
- 31.Sakaguchi S, Sakaguchi N, Shimizu J, et al. Immunologic tolerance maintained by CD25+ CD4+ regulatory T cells: their common role in controlling autoimmunity, tumor immunity, and transplantation tolerance. Immunol Rev. 2001;182:18–32. doi: 10.1034/j.1600-065x.2001.1820102.x. [DOI] [PubMed] [Google Scholar]
- 32.Hori S, Nomura T, Sakaguchi S. Control of regulatory T cell development by the transcription factor Foxp3. Science. 2003;299:1057–61. doi: 10.1126/science.1079490. [DOI] [PubMed] [Google Scholar]
- 33.Bennett CL, Christie J, Ramsdell F, et al. The immune dysregulation, polyendocrinopathy, enteropathy, X-linked syndrome (IPEX) is caused by mutations of FOXP3. Nat Genet. 2001;27:20–1. doi: 10.1038/83713. [DOI] [PubMed] [Google Scholar]
- 34.Brunkow ME, Jeffery EW, Hjerrild KA, et al. Disruption of a new forkhead/winged-helix protein, scurfin, results in the fatal lymphoproliferative disorder of the scurfy mouse. Nat Genet. 2001;27:68–73. doi: 10.1038/83784. [DOI] [PubMed] [Google Scholar]
- 35.Ochs HD, Ziegler SF, Torgerson TR. FOXP3 acts as a rheostat of the immune response. Immunol Rev. 2005;203:156–64. doi: 10.1111/j.0105-2896.2005.00231.x. [DOI] [PubMed] [Google Scholar]
- 36.Ziegler SF. FOXP3: of mice and men. Annu Rev Immunol. 2006;24:209–26. doi: 10.1146/annurev.immunol.24.021605.090547. [DOI] [PubMed] [Google Scholar]
- 37.Costantino CM, Baecher-Allan C, Hafler DA. Multiple sclerosis and regulatory T cells. J Clin Immunol. 2008;28:697–706. doi: 10.1007/s10875-008-9236-x. [DOI] [PMC free article] [PubMed] [Google Scholar]
- 38.Dalla Libera D, Di Mitri D, Bergami A, et al. T regulatory cells are markers of disease activity in multiple sclerosis patients. PLoS ONE. 2011;6:e21386. doi: 10.1371/journal.pone.0021386. [DOI] [PMC free article] [PubMed] [Google Scholar]
- 39.Fletcher JM, Lonergan R, Costelloe L, Kinsella K, Moran B, O'Farrelly C, Tubridy N, Mills KH. CD39+ Foxp3+ regulatory T Cells suppress pathogenic Th17 cells and are impaired in multiple sclerosis. J Immunol. 2009;183:7602–10. doi: 10.4049/jimmunol.0901881. [DOI] [PubMed] [Google Scholar]
- 40.Bjerg L, Brosbøl-Ravnborg A, Tørring C, Dige A, Bundgaard B, Petersen T, Höllsberg P. Altered frequency of T regulatory cells is associated with disability status in relapsing–remitting multiple sclerosis patients. J Neuroimmunol. 2012;249:76–82. doi: 10.1016/j.jneuroim.2012.04.012. [DOI] [PubMed] [Google Scholar]
- 41.Viglietta V, Baecher-Allan C, Weiner HL, Hafler DA. Loss of functional suppression by CD4+ CD25+ regulatory T cells in patients with multiple sclerosis. J Exp Med. 2004;199:971–9. doi: 10.1084/jem.20031579. [DOI] [PMC free article] [PubMed] [Google Scholar]
- 42.Zozulya AL, Wiendl H. The role of regulatory T cells in multiple sclerosis. Nat Clin Pract Neurol. 2008;4:384–98. doi: 10.1038/ncpneuro0832. [DOI] [PubMed] [Google Scholar]
- 43.Linette GP, Shankara S, Longerich S, et al. In vitro priming with adenovirus/gp100 antigen-transduced dendritic cells reveals the epitope specificity of HLA-A*0201-restricted CD8+ T cells in patients with melanoma. J Immunol. 2000;164:3402–12. doi: 10.4049/jimmunol.164.6.3402. [DOI] [PubMed] [Google Scholar]
- 44.Xia MQ, Hale G, Waldmann H. Efficient complement-mediated lysis of cells containing the CAMPATH-1 (CDw52) antigen. Mol Immunol. 1993;30:1089–96. doi: 10.1016/0161-5890(93)90155-5. [DOI] [PubMed] [Google Scholar]
- 45.Miyara M, Sakaguchi S. Natural regulatory T cells: mechanisms of suppression. Trends Mol Med. 2007;13:108–16. doi: 10.1016/j.molmed.2007.01.003. [DOI] [PubMed] [Google Scholar]
- 46.Sojka DK, Huang YH, Fowell DJ. Mechanisms of regulatory T-cell suppression – a diverse arsenal for a moving target. Immunology. 2008;124:13–22. doi: 10.1111/j.1365-2567.2008.02813.x. [DOI] [PMC free article] [PubMed] [Google Scholar]
- 47.Scheffold A, Murphy KM, Hofer T. Competition for cytokines: T(reg) cells take all. Nat Immunol. 2007;8:1285–7. doi: 10.1038/ni1207-1285. [DOI] [PubMed] [Google Scholar]
- 48.Scheffold A, Huhn J, Hofer T. Regulation of CD4+ CD25+ regulatory T cell activity: it takes (IL-)two to tango. Eur J Immunol. 2005;35:1336–41. doi: 10.1002/eji.200425887. [DOI] [PubMed] [Google Scholar]
- 49.Grutter C, Wilkinson T, Turner R, et al. A cytokine-neutralizing antibody as a structural mimetic of 2 receptor interactions. Proc Natl Acad Sci U S A. 2008;105:20251–6. doi: 10.1073/pnas.0807200106. [DOI] [PMC free article] [PubMed] [Google Scholar]
- 50.Jones JL, Anderson JM, Phuah CL, et al. Improvement in disability after alemtuzumab treatment of multiple sclerosis is associated with neuroprotective autoimmunity. Brain. 2010;133:2232–47. doi: 10.1093/brain/awq176. [DOI] [PubMed] [Google Scholar]
- 51.Bandala-Sanchez E, Zhang Y, Reinwald S, Dromey JA, Lee BH, Qian J, Bohmer RM, Harrison LC. T cell regulation mediated by interaction of soluble CD52 with the inhibitory receptor Siglec-10. Nat Immunol. 2013;14:741–8. doi: 10.1038/ni.2610. [DOI] [PubMed] [Google Scholar]
- 52.Penaranda C, Tang Q, Bluestone JA. Anti-CD3 therapy promotes tolerance by selectively depleting pathogenic cells while preserving regulatory T cells. J Immunol. 2011;187:2015–22. doi: 10.4049/jimmunol.1100713. [DOI] [PMC free article] [PubMed] [Google Scholar]
- 53.Notley CA, McCann FE, Inglis JJ, Williams RO. Anti-CD3 therapy expands the numbers of CD4+ and CD8+ Treg cells and induces sustained amelioration of collagen-induced arthritis. Arthritis Rheum. 2010;62:171–8. doi: 10.1002/art.25058. [DOI] [PubMed] [Google Scholar]
- 54.Levings MK, Sangregorio R, Roncarolo MG. Human CD25+ CD4+ T regulatory cells suppress naive and memory T cell proliferation and can be expanded in vitro without loss of function. J Exp Med. 2001;193:1295–302. doi: 10.1084/jem.193.11.1295. [DOI] [PMC free article] [PubMed] [Google Scholar]
- 55.Sakaguchi S. Naturally arising CD4+ regulatory t cells for immunologic self-tolerance and negative control of immune responses. Annu Rev Immunol. 2004;22:531–62. doi: 10.1146/annurev.immunol.21.120601.141122. [DOI] [PubMed] [Google Scholar]
- 56.Havari E, Sancho J, Campos-Rivera J, Kaplan J, Roberts B, Nguyen TH, Shankara S. Impact of alemtuzumab treatment on the survival and function of human Tregs in vitro. Gothenburg, Sweden: ECTRIMS; 2010. [DOI] [PMC free article] [PubMed] [Google Scholar]
- 57.Takahashi T, Kuniyasu Y, Toda M, Sakaguchi N, Itoh M, Iwata M, Shimizu J, Sakaguchi S. Immunologic self-tolerance maintained by CD25+ CD4+ naturally anergic and suppressive T cells: induction of autoimmune disease by breaking their anergic/suppressive state. Int Immunol. 1998;10:1969–80. doi: 10.1093/intimm/10.12.1969. [DOI] [PubMed] [Google Scholar]
- 58.Thornton AM, Shevach EM. CD4+ CD25+ immunoregulatory T cells suppress polyclonal T cell activation in vitro by inhibiting interleukin 2 production. J Exp Med. 1998;188:287–96. doi: 10.1084/jem.188.2.287. [DOI] [PMC free article] [PubMed] [Google Scholar]
- 59.Barthlott T, Moncrieffe H, Veldhoen M, Atkins CJ, Christensen J, O'Garra A, Stockinger B. CD25+ CD4+ T cells compete with naive CD4+ T cells for IL-2 and exploit it for the induction of IL-10 production. Int Immunol. 2005;17:279–88. doi: 10.1093/intimm/dxh207. [DOI] [PubMed] [Google Scholar]
- 60.Pandiyan P, Zheng L, Ishihara S, Reed J, Lenardo MJ. CD4+ CD25+ Foxp3+ regulatory T cells induce cytokine deprivation-mediated apoptosis of effector CD4+ T cells. Nat Immunol. 2007;8:1353–62. doi: 10.1038/ni1536. [DOI] [PubMed] [Google Scholar]
- 61.McGeachy MJ, Stephens LA, Anderton SM. Natural recovery and protection from autoimmune encephalomyelitis: contribution of CD4+ CD25+ regulatory cells within the central nervous system. J Immunol. 2005;175:3025–32. doi: 10.4049/jimmunol.175.5.3025. [DOI] [PubMed] [Google Scholar]