

Abstract
Context:
Tea is a rich source of fluoride (F−) and its consumption has become a cultural habit. F− available from tea might play important role in increasing total F− intake leading to dental fluorosis.
Aims:
To estimate F− concentration in different varieties of commercially available tea, in Mathura city, and to determine the change in concentration of F− in different forms of tea infusion, prepared by different methods.
Setting and Design:
Mathura city and Clinical study.
Materials and Methods:
16 brands of tea were collected from the local market, out of which 3 were dip tea, 2 were leafy tea, and 11 were tea granules. Tea infusions were prepared from three forms of tea by three different methods, i.e., without boiling with water; after boiling with water; and after addition of milk and sugar to boiling water. F− concentration of those tea infusions was measured using a F− ion selective electrode method.
Statistical Analysis Used:
One-way ANOVA was used to compare mean F− concentration in tea infusions prepared by three different methods, irrespective of the form of tea and mean F− concentration between tea infusions prepared from three different forms of tea, by three different methods.
Results:
The mean F− concentration in tea infusions prepared by three different methods irrespective of the form of tea were 1.437, 3.375, and 3.437, respectively, and tea infusion prepared from tea granules irrespective of method of preparation showed a statistical significance.
Conclusions:
F− in tea can be an additional dietary source of F− which can be beneficial in preventing dental caries or deleterious for occurrence of fluorosis.
Keywords: Dental caries, dental fluorosis, fluoride concentration, tea infusion
INTRODUCTION
Fluoride (F−) is an important anion, present in soil, water, and air. It is also found as an element in food materials. The human body requires a limited amount of F− for its benefit. Excessive consumption of F− is detrimental to human health. Even a single dose of 0.20-0.35 g F− per kg body weight[1] becomes lethal for an adult. F− can enter into the body through natural sources such as air, water, soil, tea, coffee, and agricultural products like fruits and vegetables. In addition, we get F− from fluoridated toothpaste and fluoridated drinking water.
It is evident that optimal dose of 1 mg/l F− in drinking water (systemic effect) along with topical use of fluoride prevents dental caries. However, chronic use of F− at levels higher than the beneficial dose has noxious effects in humans in the form of skeletal and dental fluorosis.[2]
As F− is available from various sources for human consumption, the total ingestion of F− by a person should be estimated taking into consideration the F− consumed from all the sources, to get either the beneficial effect or to prevent the deleterious effect.
Tea is a naturally rich source of F−.[3] The tea plant (Camellia sinensis) takes up F− from the soil and accumulates it in its leaves. The F− content of tea plants is reported to range between 3.2 mg/kg and 260 mg/kg, mostly between 100 mg/kg and 200 mg/kg. In some publications, the F− content is reported to be as high as 400 mg/kg. A substantial amount of F− present in tea leaves is released during tea infusion, and nearly all (about 94.9%) of the released F− is estimated to be absorbed by the body from tea infusions.[1,4]
Tea is indigenous to India and is an area where the country can take a lot of pride. This is mainly because of its pre-eminence as a foreign exchange earner and its contributions to the country's gross national product.[5] The total turnover of the Indian tea industry is in the vicinity of Rs. 9,000 crores.[6]
Although people of Mathura city are of low middle income group, there is a tendency of population to consume tea more frequently. Tea consumption has become a cultural habit irrespective of social status and income.
Research on oral health effects of F− have shown caries preventive effect of F− in drinking water,[7] but it was worthy to note that mean F− concentration in drinking water ranging from 0.2 mg/l to 1.5 mg/l, there is varying degree of dental fluorosis though mild to very mild in nature.[8]
This observation substantially supports that in addition to the amount of F− consumption in drinking water, the F− available from additional sources such as food and vegetables grown and consumed in that area, consumption of milk and milk products, and consumption of tea and coffee should play an important role in increasing the total amount of F− ingestion leading to dental fluorosis. Keeping this observation in view, an attempt was made in this study to determine the change in concentration of F− in tea infusion prepared from different forms of tea by three different methods.
MATERIALS AND METHODS
Sampling design
In Mathura market, three forms of tea are most commonly available and consumed by the population. The three forms of tea that are commercially available are:
Tea bags (dip tea)
Tea packets containing leafy tea
Tea packets containing tea granules.
These forms of tea are marketed under different brands in Mathura city. People of Mathura use tea granules more frequently than other forms of tea. A total of 16 tea packets representing 16 brands were collected from the local market, out of which 3 brands were of dip tea, 2 brands were of leafy tea, and 11 brands were of tea granules.
Preparation of tea infusions
Before the preparation of tea infusion, F− concentration in water, sugar, and milk used for the preparation of tea was determined using F− ion selective electrode (Orion-9609BNWP) coupled to an ion analyzer (Orion-4 Star).
Following three methods were employed for the preparation of tea infusions:
Method 1 (Before boiling of water)
In method 1, 2 g of tea was added to 120 ml of water in a beaker at normal room temperature. After 3 min of infusion, the tea was filtered and the solution was recovered in another beaker and the F− concentration of tea infusion was recorded. This was done for all varieties and brands of tea samples.
Method 2 (After boiling of water)
In method 2, 120 ml of water was brought to boil in a beaker over a hot plate to which 2 g of tea was added. After 3 min of infusion, the tea was filtered and the solution was allowed to cool to room temperature. The F− concentration of tea infusion was recorded and this was done for all the 16 samples of tea.
Method 3 (After adding milk and sugar to boiling water)
In method 3, to 100 ml of boiling water, 20 ml of milk with 4 g of sugar and 2 g of tea were added. After 3 min of infusion, the tea was filtered and the solution was allowed to cool to room temperature. The F− concentration of tea infusion was recorded and this was done for all the 16 samples of tea.
Method used to determine fluoride concentration in tea infusions
Fluoride estimation in tea infusions was determined potentiometrically using a F− ion selective electrode (Orion-9609BNWP) coupled to an ion analyzer (Orion-4 Star). This method was followed in accordance with WHO methodology for estimation of F− concentration in water and milk.[9]
Same method was employed to determine the F− concentration in all the 16 samples of tea.
Statistical analysis
The data were analyzed using Statistical Package for the Social Sciences, version 11.5 for windows. One-way ANOVA was used to compare the F− concentration in tea infusions prepared by three different methods irrespective of the form of tea and to compare the mean F− concentration between tea infusions prepared from three different forms of tea, by three different methods. P value equal to or less than 0.05 was considered to be statistically significant.
RESULTS
In this study, F− concentration of water, milk, and sugar that were used for preparation of tea infusions was estimated separately using a F− ion selective electrode (Orion-9609BNWP) coupled to an ion analyzer (Orion-4 Star). The F− concentration of water, milk, and sugar was 0.8 mg/l, 0.4 mg/l, and 0.8 mg/l, respectively. The F− concentration of sugar was calculated by dissolving sugar in water and the F− concentration of water was subtracted from it to get the F− concentration of sugar. This F− concentration was kept constant for preparation of tea infusions by different methods in order to standardize the procedure. The preparation time for tea infusion after addition of tea whether before boiling or after boiling, was kept constant at 3 min for all the three methods.
The study found that the mean F− concentration in tea infusions prepared by three different methods, i.e., before boiling of water (method 1), after boiling of water (method 2), and after addition of milk and sugar to boiling water (method 3) irrespective of the form of tea were 1.437 ± 0.512, 3.375 ± 0.712, and 3.437 ± 0.892, respectively.
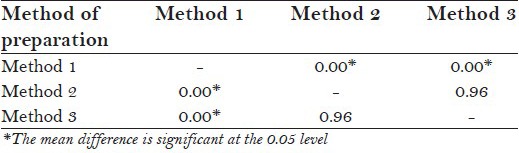
When one-way ANOVA was applied to compare the F− concentration in tea infusions prepared by three different methods irrespective of the form of tea, there was statistically significant difference in F− concentration between tea infusions prepared by method 1 and method 2 and by method 1 and method 3 (P = 0.000, post hoc tukey test). However, there was no statistically significant difference between F− concentration of tea infusions prepared by method 2 and method 3 [P = 0.968, post hoc tukey test; Table 1 and 1a].
Table 1.
Comparison of mean fluoride concentration in tea infusions prepared by three different methods irrespective of the form of tea: One way ANOVA
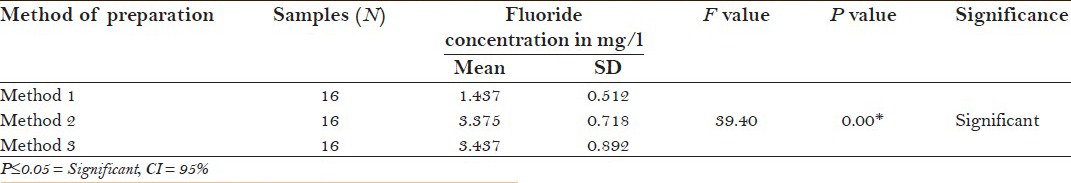
Table 1a.
Post hoc tukey test
The mean F− concentration in tea infusions prepared by three different methods, i.e., before boiling of water (method 1), after boiling of water (method 2), and after addition of milk and sugar to boiling water (method 3) with respect to form of tea were 1.666 ± 0.577, 2.666 ± 0.577, and 2.333 ± 0.577, respectively, for tea bags; 1.000 ± 0.000, 3.000 ± 1.414, and 3.000 ± 1.414, respectively for tea leaves; 1.454 ± 0.522, 3.636 ± 1.504, and 3.812 ± 0.603, respectively, for tea granules.
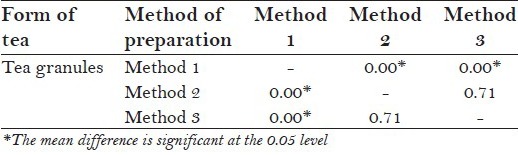
One-way ANOVA was applied to compare the mean F− concentration between tea infusions prepared from three different forms of tea, by three different methods. Tea infusion prepared from tea granules irrespective of methods of preparation showed a statistical significance [Table 2]. A post hoc tukey test was then applied to know the significant difference in F− concentration between any two of the three methods. It was found from the test that there was significant difference in mean F− concentration in tea granules prepared by method 1 and method 2 and by method 1 and method 3 (P = 0.000, post hoc tukey test). However, no statistically significant difference was found by method 2 and method 3 [P = 0.71, post hoc tukey test; Table 2a].
Table 2.
Comparison of mean fluoride concentration in tea infusion prepared from three different forms of tea by three different methods: One way ANOVA
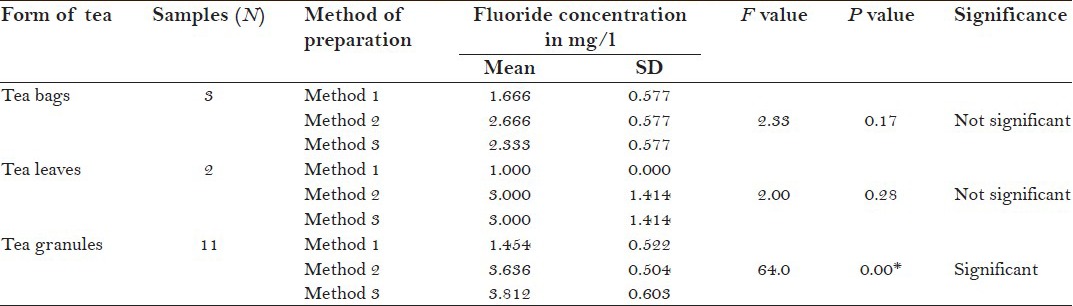
Table 2a.
Post hoc tukey test
DISCUSSION
It is important to note that the availability of F− for consumption is not only from drinking water but also from other sources such as diet, dairy products like milk, fruits and vegetables, beverages like tea and coffee, etc., This means that the beneficial or detrimental effect of F− will depend upon the total consumption from all sources taken together.[10]
Tea is usually very rich in F−, and F− levels ranging from 3.2 mg kg/1 to 400 mg kg/1 by weight in dry samples have been reported.[1] In this study, an attempt was made to estimate the level of F− concentration in different varieties of commercially available tea in Mathura city and to determine the change in concentration of F− in different forms of tea infusion prepared by different methods.
It was observed from the study that mean F− concentration in tea infusion prepared by method 1, i.e., before boiling of water was 1.437 mg/l as compared to F− concentration in tea infusion prepared by method 2, i.e., after boiling of water was 3.375 mg/l and method 3, i.e., after addition of milk and sugar to boiling water was 3.437 mg/l, irrespective of the forms of tea.
The low F− concentration in tea infusion before boiling of water, i.e., method 1, irrespective of form of tea might be due to the fact that F− is released in low quantities at room temperature and may require longer duration of time to release F− in tea infusion.
The high F− concentration in tea infusion prepared after boiling of water, i.e., method 2, irrespective of form of tea might be due the fact that the rise in temperature favors the release of more F− from tea in tea infusion.
The highest F− concentration in tea infusion prepared after addition of milk and sugar to boiling water, i.e., method 3 irrespective of the form of tea might be attributed to the addition of milk, whose F− content may add up to the F− content of tea in tea infusion.
Thus, the F− obtained from tea prepared by any of the three methods irrespective of form of tea is above the upper recommended limit of F− for Indian population, i.e., 0.7-1.2 mg/l. However, Indian population usually consumes on an average 150-200 ml of tea/day. The amount of F− ingested from tea might be an additional source of F− other than F− concentration in drinking water, thus increasing total ingestion. Hence, such addition might be beneficial in areas where F− concentration in drinking water is below the optimum level, whereas such addition might be detrimental in areas where F− concentration in drinking water is above the optimum level.
In Mathura city, people more frequently use tea infusion prepared from tea granules and prefer tea granules more than tea leaves and tea bags for preparation of tea. People invariably prepare tea by boiling tea granules with addition of milk and sugar. It was observed in the study that mean F− concentration in such type of tea infusion prepared by addition of milk, sugar, and tea granules to boiling water was 3.812 mg/l. Assuming the average consumption of 2-3 servings each of 80-100 ml of tea infusion per day, drinking of tea prepared from tea granules could make a significant contribution to the daily intake of F− for people of Mathura city, along with F− ingested from drinking water.
Since Mathura city consists of middle and low middle class population, they allow their children less than 8 years to consume tea along with breakfast and snacks, so exposing them to more F− along with F− present in water. Therefore, there is a chance of developing dental fluorosis in areas where F− concentration in drinking water is 1.2-1.5 mg/l.
It was concluded from the study that F− in tea can be an additional dietary source of F− which can be beneficial in preventing dental caries or deleterious for occurrence of fluorosis.
Footnotes
Source of Support: Nil
Conflict of Interest: None declared.
REFERENCES
- 1.Tokalıoğlu S, Kartal S, Sahin U. Determination of fluoride in various samples and some infusions using a fluoride selective electrode. Turk J Chem. 2004;28:203–11. [Google Scholar]
- 2.Yam AA, Kane AW, Cisse D, Gueye MM, Diop L, Agboton P, et al. Traditional tea drinking in Senegal. A real source of fluoride intake for the population. Odontostomatol Trop. 1999;22:25–8. [PubMed] [Google Scholar]
- 3.Hayacibara MF, Queiroz CS, Tabchoury CP, Cury JA. Fluoride and aluminum in teas and tea-based beverages. Rev Saude Publica. 2004;38:100–5. doi: 10.1590/s0034-89102004000100014. [DOI] [PubMed] [Google Scholar]
- 4.Zazouli MA, Esfandiari E. Fluoride content of Iranian black tea and tea liquor. Fluoride. 2006;39:266–8. [Google Scholar]
- 5.Indian tea. [Last accessed 2010 Sep 7]. Available from: http://www.teauction.com/industry/indiantea.asp .
- 6.India tea industry. [Last accessed 2010 Sep 7]. Available from: http://www.teaboard.gov.in/pdf/teaindustry.pdf .
- 7.Petersen PE, Lennon MA. Effective use of fluorides for the prevention of dental caries in the 21st century: The WHO approach. Community Dent Oral Epidemiol. 2004;32:319–21. doi: 10.1111/j.1600-0528.2004.00175.x. [DOI] [PubMed] [Google Scholar]
- 8.Mohapatra AK, Solanki JV. Agra: Dr. B. R. Ambedkar University; 2009. Prevalence of dental caries and dental fluorosis in 5-6 and 12-13 year school children residing in various levels of fluoride concentration in drinking water in Mathura city [Dissertation] [Google Scholar]
- 9.Stephen KW, Banoczy J, Pakhomov GN. Milk fluoridation for the prevention of dental caries. [Last accessed 2010 Sep 7]. Available from: http://whqlibdoc.who.int/publications/2009/9789241547758_eng.pdf .
- 10.Fejerskov O, Ekstrand J, Brain A. Fluorides in Dentistry. 2nd ed. Munksgaard Publishers; 1996. Burt; pp. 40–4. [Google Scholar]