Abstract
Degradation is among the most important properties of biomaterial scaffolds, which are indispensable for regenerative medicine. The currently used method relies on the measurement of mass loss across different samples and cannot track the degradation of an individual scaffold in situ. Here we report, for the first time, the use of multiscale photoacoustic microscopy to non-invasively monitor the degradation of an individual scaffold. We could observe alterations to the morphology and structure of a scaffold at high spatial resolution and deep penetration, and more significantly, quantify the degradation of an individual scaffold as a function of time, both in vitro and in vivo. In addition, the remodeling of vasculature inside a scaffold can be visualized simultaneously using a dual-wavelength scanning mode in a label-free manner. This optoacoustic method can be used to monitor the degradation of individual scaffolds, offering a new approach to non-invasively analyze and quantify biomaterial-tissue interactions in conjunction with the assessment of in vivo vascular parameters.
Keywords: inverse opal scaffolds, regenerative medicine, MTT formazan, erosion, blood vessels, photoacoustic imaging
Regenerative medicine requires the use of three-dimensional (3D) porous scaffolds, which not only serve as structural supports but also provide controlled microenvironments for cells to interact with.[1] The scaffolds are typically made of a biodegradable material in an effort to alleviate the foreign body response caused by permanent implantation.[2] For most applications, it is necessary to quantitatively know the degradation behaviors of such a biodegradable scaffold. In spite of its importance and many years of research, it is still a grand challenge to measure the degradation profile of a scaffold as the current method typically relies on the measurement of mass loss across multiple samples. Besides its invasive nature, the assay is labor-intensive and requires one to sacrifice a large number of samples or animals. To address this issue, several imaging techniques have been recently explored for non-invasive assessment of the degradation profile of an individual scaffold.[3, 4] Although these studies were able to quantify overall changes to a scaffold, it was very difficult to observe alterations to the fine structures of the scaffold due to limited resolutions of the imaging modalities. As a result, we still need to develop a new imaging technique with high spatial resolution as well as deep penetration depth for non-invasively assessing the degradation behavior of a scaffold.
Photoacoustic microscopy (PAM) is a novel imaging modality that acquires volumetric data in a non-invasive manner. It relies on photoacoustic signals generated by an optical-absorbing species upon irradiation by a pulsed or intensity-modulated laser,[5] and can detect both endogenous[6] and exogenous[7] contrasts at high spatial resolution and sensitivity, together with relatively deep penetration depth. In addition, based on its absorption contrast mechanism, PAM imaging is not affected by tissue autofluorescence commonly experienced by fluorescence microscopy. Inspired by these attractive features of PAM, here we further extended its capability to non-invasively monitor, both in vitro and in vivo, the degradation of individual poly(D,L-lactide-co-glycolide) (PLGA) inverse opal scaffolds doped with a contrast agent based on 3-(4,5-dimethylthiazol-2-yl)-2,5-diphenyltetrazolium bromide (MTT) formazan.
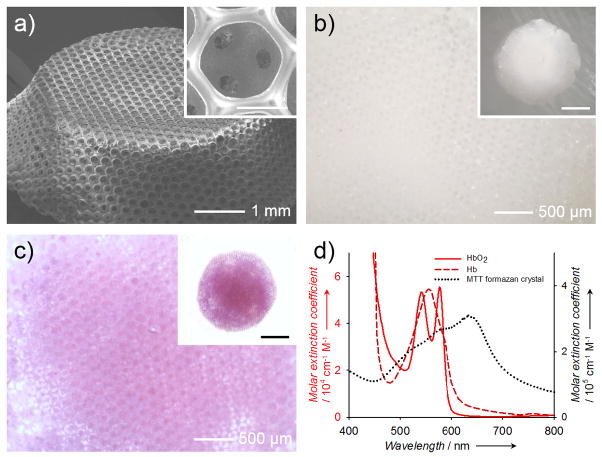
In this proof-of-concept study, we used a mixture (in equal mass) of two types of PLGAs with lactide-to-glycolide ratios of 50:50 and 75:25, respectively, in order to achieve an intermediate degradation kinetics.[8] We fabricated PLGA inverse opal scaffolds with a uniform pore size of 180 μm.[1b, 6c, 6d, 9] Figure 1a shows a typical scanning electron microscopy (SEM) image of a PLGA inverse opal scaffold at a tilt angle, revealing its three-dimensionality, uniform pores, and a long-range ordered structure. The uniform and interconnected pores of these scaffolds (shown in Figure 1a, inset) are critical to homogeneous cell seeding and tissue ingrowth throughout the scaffold.[1b, 9c, 10] Typically, a pristine PLGA inverse opal scaffold wetted with water is translucent white and barely absorbs visible light (Fig. 1b). To generate contrast for PAM, the scaffold was doped with MTT formazan, which rendered the scaffold a purple color (Fig. 1c). MTT formazan was chosen as a contrast agent for the following reasons: i) formazan is relatively nontoxic;[11] ii) MTT formazan crystals have strong absorption covering the spectral range of 490–700 nm (at half maximum), distinct from the absorption of hemoglobin or deoxy-hemoglobin (Fig. 1d); iii) the addition of MTT formazan caused no alteration to the degradation behavior of a PLGA scaffold (Fig. S1); iv) due to its strong hydrophobicity, MTT formazan could hardly leak out from the scaffolds over the 6-week period tested (Fig. S2); and v) since MTT formazan is a small molecule, it disperses well in the scaffold, and once released from the degrading scaffold, the molecules can be quickly cleared away from the scaffold region, thus potentially enabling accurate quantification.
Figure 1.
a) A representative SEM image showing a PLGA inverse opal scaffold with uniform pores and a long-range ordered structure. The inset shows a magnified view of a pore on the surface, revealing the uniform windows connecting to the pores underneath. Scale bar: 100 μm. b, c) Optical micrographs showing (b) a pristine PLGA inverse opal scaffold and (c) a PLGA inverse opal scaffold after doping with MTT formazan to render it purple in color. d) UV-vis extinction spectra of hemoglobin, deoxy-hemoglobin, and MTT formazan crystals. Formazan has an absorption peak at approximately 650 nm, while blood does not show strong absorption at >600 nm.
The scaffolds doped with MTT formazan were then subjected to PAM imaging. In order to demonstrate the capability of PAM to monitor the morphological changes of the scaffolds, we examined the degradation of the PLGA inverse opal scaffolds under two different conditions: in plain phosphate buffered saline (PBS), and in PBS supplemented with 0.025 wt.% lipase (in vivo mimicry). Lipase was chosen because it is secreted in the body naturally upon implantation of foreign bodies,[12] and is able to expedite the degradation of PLGA so that a prominent contrast between the two groups can be easily observed.
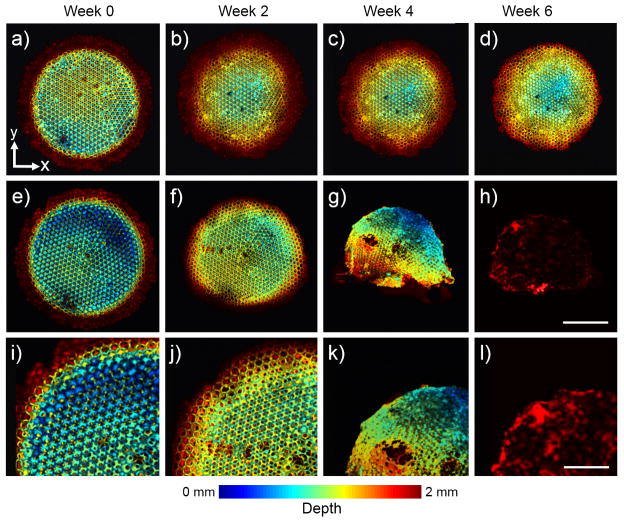
Using an optical-resolution PAM (OR-PAM), which had a lateral resolution of approximately 5 μm and a penetration depth of around 1 mm in highly scattering soft tissues,[13] we could efficiently follow changes to the fine structure of a scaffold during its degradation. Figure 2 shows coronal PAM projection images of a scaffold, which are color-coded by depth of maximum from blue (surface) to red (bottom). From these images, we could not only clearly observe the uniform pores on the surface of a scaffold, but even the uniform windows connecting to the pores underneath (Fig. S3). The scaffold in plain PBS only showed minor changes to the structures during the 6-week period, mainly caused by shrinkage (Fig. 2, a–d). By contrast, the addition of lipase induced remarkably accelerated degradation of the scaffold (Fig. 2, e–h; and i–l, magnified views). The reduction in the overall size of the scaffold became apparent at week 2. The scaffold was largely disrupted at week 4, with large holes appearing in the bulk of the scaffold, and the scaffold had almost completely degraded by week 6.
Figure 2.
a–h) Coronal OR-PAM projection images showing the degradation of a PLGA inverse opal scaffold immersed in (a–d) plain PBS and (e–h) PBS containing 0.025 wt.% lipase at 37 °C for a period up to 6 weeks. Scale bar: 2 mm. i–l) Magnified views showing the top-left corner of the images in (e–h), respectively. While the scaffold in PBS did not undergo obvious structural alterations up to week 6, the scaffold showed remarkable changes over time in the presence of lipase. Scale bar: 1 mm. The images are color-coded by depth of maximum.
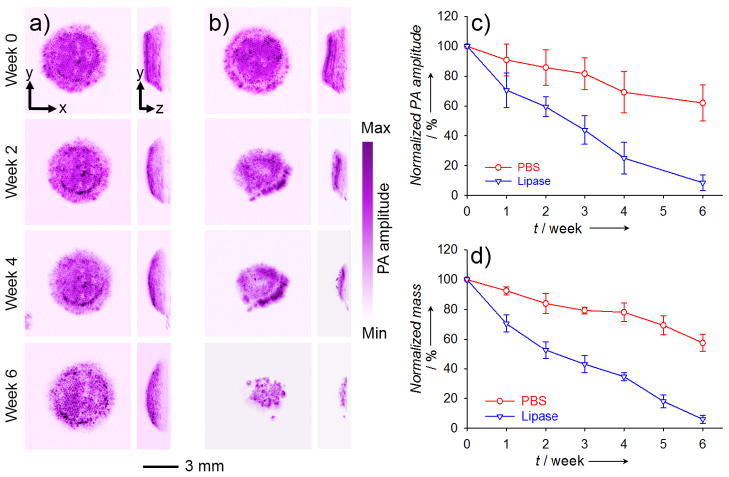
PAM could also be used to quantitatively analyze the degradation of a scaffold in addition to resolving its structural changes. To demonstrate this capability, we used an acoustic-resolution PAM (AR-PAM; central frequency of ultrasonic transducer: 50 MHz) with a penetration depth of around 3 mm in soft tissues and a lateral resolution of approximately 45 μm.[14] In this case, the inverse opal scaffold was monitored by AR-PAM for up to 6 weeks at a wavelength of 638 nm (Fig. 3, a and b). It is worthy of mentioning that, at a lateral resolution of 45 μm, the porous structure of an inverse opal scaffold was still discernible by AR-PAM (Fig. S4). By using the PAM volumetric data, we were able to quantify the degradation of the scaffolds (by mass) over time: the scaffolds in plain PBS had degraded about 40% by week 6, and lipase had induced about 90% degradation for the scaffolds during the same period of time (Fig. 3c). The quantification results obtained using PAM data correlated well with those measured from similar scaffolds using the conventional invasive mass loss assay (Fig. 3d).
Figure 3.
a, b) AR-PAM MAP coronal (left row) and sagittal images (right row) showing the degradation of a PLGA inverse opal scaffold immersed in (a) plain PBS and (b) PBS containing 0.025 wt.% lipase at 37 °C for a period of up to 6 weeks. c) Quantification of degradation using PAM volumetric data. By week 6, the scaffolds in plain PBS only degraded about 40% while the scaffolds in lipase-containing PBS had almost degraded completely. d) Quantification of the degradation in PBS in the absence and presence of lipase, respectively, using the conventional invasive mass loss assay, which showed profiles similar to what were obtained from PAM. MAP stands for “maximum amplitude projection”.
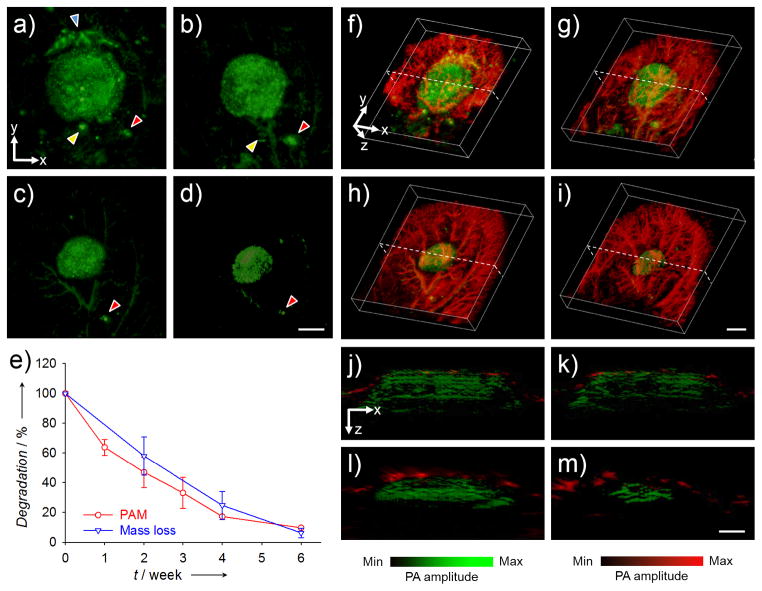
More significantly, besides in vitro analyses, PAM could be used to track the degradation of a scaffold in vivo. In a typical study, the PLGA inverse opal scaffolds doped with MTT formazan were implanted in a mouse ear model,[6c] and monitored using dual wavelength AR-PAM. Figure 4, a–d, shows coronal PAM maximum amplitude projection (MAP) images of the same scaffold in the mouse ear at weeks 0, 1, 3, and 6 post implantation, respectively, at a wavelength of 638 nm. We could clearly observe structural changes to the scaffold without interference from blood vessels thanks to the limited optical absorption of hemoglobin at the chosen wavelength. The diameter of the scaffold decreased from about 5 mm to 2.5 mm over a period of 6 weeks, together with a decrease in photoacoustic amplitude. Using the PAM volumetric data, it was estimated that the scaffolds had degraded about 90% by week 6 (Fig. 4e), very similar to the results obtained from the invasive mass loss assay (about 94%, Fig. 4e). By switching to a wavelength of 578 nm, we could then acquire images of both the scaffold and the vasculature because hemoglobin also has strong absorption at this wavelength. After subtracting the signals from the scaffold, we were able to look at the single component of blood vessels with minimum interference from the scaffold (Fig. S5). Figure 4, f–i and Movies S1–S4, show co-registered 3D depictions of blood vessels (in red) and the scaffold (in green) at weeks 0, 1, 3, and 6 post implantation. The degradation of the scaffold and the remodeling of blood vessels within the mouse ear could be identified at the same time. Figure 4, j–m, shows the corresponding B-scan (z direction from the surface of the skin) images at the positions indicated by the dotted lines in Figure 4, f–i, respectively. The thickness of the scaffold decreased from about 1.5 mm at week 0 to 0.8 mm at week 6, and some blood vessels were observed to develop into the void space of the scaffold. Moreover, the area of the blood vessels was quantifiable,[6c] and functional PAM could also be used to obtain other important parameters of the vasculature such as blood flow velocity,[15] oxygen saturation,[16] partial pressure,[16b] and metabolism.[17]
Figure 4.
a–d) AR-PAM coronal MAP images taken from the same PLGA inverse opal scaffold implanted in the ear of a nude mouse at weeks 0, 1, 3, and 6 post implantation, respectively. The arrowheads indicate small pieces of the scaffold that likely came off during the surgery, and their slight changes in position and orientation relative to the main scaffold at different time points could be attributed to the activity of the mouse. Scale bars: 2 mm. e) Comparison of the degradation profiles of scaffolds as a function of time obtained from the same scaffold using PAM and from different scaffolds using the conventional invasive mass loss assay. f–i) Co-registered 3D reconstruction images showing both the degradation of a scaffold (the same piece) and the remodeling of vasculature simultaneously. Scale bars: 2 mm. j–m) Co-registered B-scan images at the dotted planes as indicated in (f–i), respectively. The blood vessels observed at week 0 were mainly located on the top surface of the scaffold. Scale bars: 1 mm. MAP stands for “maximum amplitude projection”.
It should be pointed out that some photoacoustic signals were also observed from regions outside the scaffold within the first week of implantation (Fig. 4a), which could be attributed to small pieces of the scaffold that came off during the surgical process. These pieces gradually disappeared or were reduced in size in the course of degradation (Fig. 4, a–d, arrowheads). Across different time points, some of these small pieces could experience changes in position and orientation relative to the main scaffold due to the activity of the mouse. Interestingly, while the native vessels should not generate any intense photoacoustic signals at a wavelength of 638 nm, a few vessels were observed in the PAM image at weeks 0 through 6 (Fig. 4, a–d). We believe that this phenomenon was likely related to the clearance, potentially via the lymphatic system, of MTT formazan released from the scaffold itself or the broken pieces as they were undergoing degradation. However, further studies are needed to clarify this issue.
Finally, we demonstrated the capability of PAM to analyze the degradation of an individual scaffold implanted subcutaneously at the dorsal site of a mouse. Unlike the ear model where the thickness of the skin was limited to only about 200 μm, the skins around the site of dorsal implantation had an average thickness of 1–1.5 mm. Accordingly, we changed to a different ultrasonic transducer (central frequency: 20 MHz) for the AR-PAM system to increase its penetration depth to the sub-centimeter scale with a reduced lateral resolution to approximately 80 μm. As shown in Figure S6a, at such an implantation depth, PAM could easily image the entire scaffold. We then overlaid layers of chicken breasts onto the mouse skin at the site of implantation. Interestingly, the entire scaffold was also clearly visible after we had added one layer of chicken breast (3 mm, Figure S6b); when a second layer was added (6 mm in total), we were still able to observe the surface region of the scaffold with discernible porous structure. Taking consideration of the thickness of the mouse skin, we believe that our PAM system could resolve the structure of an entire scaffold embedded in soft tissues as deep as around 5 mm at a reasonable lateral resolution. Such a penetration depth could be further improved by increasing the absorption contrast of the scaffold or the laser intensity. In addition, the degradation of the scaffold over time could still be monitored as well. In this particular demonstration, the scaffold shrunk both in diameter and thickness over time during the first 4 weeks post implantation, and by week 6, it had completely degraded (Fig. S7).
In summary, we have successfully demonstrated the capability to use multiscale PAM to non-invasively track the degradation of individual biomaterial scaffolds both in vitro and in vivo. PAM (or photoacoustic tomography, PAT) can achieve much greater penetration depths than pure optical imaging modalities, typically on the scale of a few hundred micrometers to a few centimeters.[18] While such a penetration depth may suffice the needs for small laboratory animals or near surface regions, assessment of implants at deep depths in large animals or human objects using PAM might still be difficult. In addition, bony or air-filled tissues cannot be effectively imaged using PAM. Despite these two major limitations, we still consider our technique to be a great tool that may eventually become an enabling procedure in analyzing biomaterial-tissue interactions in conjunction with the assessment of other in vivo vascular parameters in a completely non-invasive manner.
Supplementary Material
Acknowledgments
We appreciate Prof. James Ballard for careful reading of the manuscript. This work was supported in part by an NIH Director’s Pioneer Award (DP1 OD000798) and startup funds from Washington University in St. Louis and Georgia Institute of Technology (to Y.X.). This work was also sponsored by NIH grants (R01 EB000712, R01 EB008085, R01 CA140220, R01 CA157277, R01 CA159959, and U54 CA136398, to L.V.W.).
Footnotes
Supporting information for this article is available on the WWW under http://dx.doi.org/.
Contributor Information
Dr. Yu Shrike Zhang, The Wallace H. Coulter Department of Biomedical Engineering, Georgia Institute of Technology and Emory University, Atlanta, GA 30332 (USA).
Xin Cai, Department of Biomedical Engineering, Washington University, St. Louis, MO 63130 (USA).
Dr. Junjie Yao, Department of Biomedical Engineering, Washington University, St. Louis, MO 63130 (USA)
Wenxin Xing, Department of Biomedical Engineering, Washington University, St. Louis, MO 63130 (USA).
Prof. Lihong V. Wang, Email: lhwang@seas.wustl.edu, Department of Biomedical Engineering, Washington University, St. Louis, MO 63130 (USA)
Prof. Younan Xia, Email: younan.xia@bme.gatech.edu, The Wallace H. Coulter Department of Biomedical Engineering, Georgia Institute of Technology and Emory University, Atlanta, GA 30332 (USA)
References
- 1.a) Ma PX. Mater Today. 2004;7:30. [Google Scholar]; b) Choi SW, Zhang Y, Xia Y. Langmuir. 2010;26:19001. doi: 10.1021/la104206h. [DOI] [PMC free article] [PubMed] [Google Scholar]
- 2.Griffith LG. Ann NY Acad Sci. 2002;961:83. doi: 10.1111/j.1749-6632.2002.tb03056.x. [DOI] [PubMed] [Google Scholar]
- 3.Kim K, Jeong CG, Hollister SJ. Acta Biomater. 2008;4:783. doi: 10.1016/j.actbio.2008.02.010. [DOI] [PMC free article] [PubMed] [Google Scholar]
- 4.Artzi N, Oliva N, Puron C, Shitreet S, Artzi S, bon Ramos A, Groothuis A, Sahagian G, Edelman ER. Nat Mater. 2011;10:704. doi: 10.1038/nmat3095. [DOI] [PMC free article] [PubMed] [Google Scholar]
- 5.a) Wang LV. Nat Photon. 2009;3:503. doi: 10.1038/nphoton.2009.157. [DOI] [PMC free article] [PubMed] [Google Scholar]; b) Wang LV, Hu S. Science. 2012;335:1458. doi: 10.1126/science.1216210. [DOI] [PMC free article] [PubMed] [Google Scholar]; c) Cai X, Zhang YS, Xia Y, Wang LV. Mater Today. 2013;16:67. doi: 10.1016/j.mattod.2013.03.007. [DOI] [PMC free article] [PubMed] [Google Scholar]
- 6.a) Wang Y, Hu S, Maslov K, Zhang Y, Xia Y, Wang LV. Opt Lett. 2011;36:1029. doi: 10.1364/OL.36.001029. [DOI] [PMC free article] [PubMed] [Google Scholar]; b) Wang Y, Maslov K, Zhang Y, Hu S, Yang LM, Xia Y, Liu J, Wang LV. J Biomed Opt. 2011;16:011014. doi: 10.1117/1.3525643. [DOI] [PMC free article] [PubMed] [Google Scholar]; c) Cai X, Zhang Y, Li L, Choi SW, MacEwan MR, Yao J, Kim C, Xia Y, Wang LV. Tissue Eng Part C: Methods. 2013;19:196. doi: 10.1089/ten.tec.2012.0326. [DOI] [PMC free article] [PubMed] [Google Scholar]; d) Zhang Y, Cai X, Choi SW, Kim C, Wang LV, Xia Y. Biomaterials. 2010;31:8651. doi: 10.1016/j.biomaterials.2010.07.089. [DOI] [PMC free article] [PubMed] [Google Scholar]
- 7.Yao J, Maslov K, Hu S, Wang LV. J Biomed Opt. 2009;14:054049. doi: 10.1117/1.3251044. [DOI] [PMC free article] [PubMed] [Google Scholar]; b) Cho EC, Zhang Y, Cai X, Moran CH, Wang LV, Xia Y. Angew Chemie Int Ed. 2013;52:1152. doi: 10.1002/anie.201208096. [DOI] [PMC free article] [PubMed] [Google Scholar]; c) Zhang Y, Wang Y, Wang L, Wang Y, Cai X, Zhang C, Wang LV, Xia Y. Theranostics. 2013 doi: 10.7150/thno.5369. [DOI] [PMC free article] [PubMed] [Google Scholar]
- 8.Lu L, Peter SJ, Lyman MD, Lai HL, Leite SM, Tamada JA, Uyama S, Vacanti JP, Langer R, Mikos AG. Biomaterials. 2000;21:1837. doi: 10.1016/s0142-9612(00)00047-8. [DOI] [PubMed] [Google Scholar]
- 9.a) Choi SW, Zhang Y, Thomopoulos S, Xia Y. Langmuir. 2010;26:12126. doi: 10.1021/la101519b. [DOI] [PMC free article] [PubMed] [Google Scholar]; b) Zhang Y, Cai X, Wang Y, Zhang C, Li L, Choi SW, Wang LV, Xia Y. Angew Chem Int Ed. 2011;50:7359. doi: 10.1002/anie.201101659. [DOI] [PMC free article] [PubMed] [Google Scholar]; c) Zhang Y, Choi SW, Xia Y. Macromol Rapid Commun. 2012;33:296. doi: 10.1002/marc.201100695. [DOI] [PubMed] [Google Scholar]; d) Choi SW, Zhang Y, MacEwan MR, Xia Y. Adv Healthcare Mater. 2013;2:145. doi: 10.1002/adhm.201200106. [DOI] [PMC free article] [PubMed] [Google Scholar]; e) Zhang YS, Regan KP, Xia Y. Macromol Rapid Commun. 2013;34:485. doi: 10.1002/marc.201200740. [DOI] [PubMed] [Google Scholar]; f) Zhang YS, Choi S-W, Xia Y. Soft Matter. 2013 doi: 10.1039/C3SM52063C. [DOI] [Google Scholar]
- 10.Zhang Y, Xia Y. Adv Funct Mater. 2012;22:121. doi: 10.1002/adfm.201102582. [DOI] [PMC free article] [PubMed] [Google Scholar]
- 11.Scudiero DA, Shoemaker RH, Paull KD, Monks A, Tierney S, Nofziger TH, Currens MJ, Seniff D, Boyd MR. Cancer Res. 1988;48:4827. [PubMed] [Google Scholar]
- 12.a) Janousek L, Adamec M, Saudek F, Koznarova R, Boucek P, Lipar K, Tosenovsky P, Matia I. Transplant Proc. 2004;36:1099. doi: 10.1016/j.transproceed.2004.04.049. [DOI] [PubMed] [Google Scholar]; b) Ma WX, Yu TS, Fan YY, Zhang ST, Ren P, Wang SB, Zhao R, Pi JB, Guan DW. Int J Legal Med. 2011;125:549. doi: 10.1007/s00414-011-0567-4. [DOI] [PubMed] [Google Scholar]
- 13.a) Maslov K, Zhang HF, Hu S, Wang LV. Opt Lett. 2008;33:929. doi: 10.1364/ol.33.000929. [DOI] [PubMed] [Google Scholar]; b) Hu S, Maslov K, Wang LV. Opt Lett. 2011;36:1134. doi: 10.1364/OL.36.001134. [DOI] [PMC free article] [PubMed] [Google Scholar]
- 14.Zhang HF, Maslov K, Stoica G, Wang LV. Nat Biotechnol. 2006;24:848. doi: 10.1038/nbt1220. [DOI] [PubMed] [Google Scholar]
- 15.Yao J, Wang LV. J Biomed Opt. 2010;15:021304. doi: 10.1117/1.3339953. [DOI] [PMC free article] [PubMed] [Google Scholar]
- 16.a) Zhang HF, Maslov K, Sivaramakrishnan M, Stoica G, Wang LV. Appl Phys Lett. 2007;90:053901. [Google Scholar]; b) Wang Y, Hu S, Maslov K, Zhang Y, Xia Y, Wang LV. Opt Lett. 2011;36:1029. doi: 10.1364/OL.36.001029. [DOI] [PMC free article] [PubMed] [Google Scholar]
- 17.Yao J, Maslov KI, Zhang Y, Xia Y, Wang LV. J Biomed Opt. 2011;16:076003. doi: 10.1117/1.3594786. [DOI] [PMC free article] [PubMed] [Google Scholar]
- 18.a) Song KH, Wang LV. J Biomed Opt. 2007;12:060503. doi: 10.1117/1.2818045. [DOI] [PubMed] [Google Scholar]; b) Kim C, Erpelding TN, Jankovic L, Pashley MD, Wang LV. Biomed Opt Express. 2010;1:278. doi: 10.1364/BOE.1.000278. [DOI] [PMC free article] [PubMed] [Google Scholar]; c) Wang Y, Erperlding TN, Jankovic L, Guo Z, Robert JL, David G, Wang LV. J Biomed Opt. 2012;17:061208. doi: 10.1117/1.JBO.17.6.061208. [DOI] [PMC free article] [PubMed] [Google Scholar]
Associated Data
This section collects any data citations, data availability statements, or supplementary materials included in this article.


