

Abstract
Purpose
There is significant interest in delivering precisely targeted small-volume radiation treatments, in the pre-clinical setting, to study dose-volume relationships with tumour control and normal tissue damage. For these studies it is vital that image guidance systems and target positioning are accurately aligned (IGRT), in order to deliver dose precisely and accurately according to the treatment plan. In this work we investigate the IGRT targeting accuracy of the X-RAD 225 Cx system from Precision X-Ray using high resolution 3D dosimetry techniques.
Method
Small cylindrical PRESAGE™ dosimeters were used with optical-CT readout (DMOS) to verify the accuracy of 2.5, 1.0, and 5.0 mm X-RAD cone attachments. The dosimeters were equipped with four target points, visible on both CBCT and optical-CT, at which a 7-field coplanar treatment plan was delivered with the respective cone. Targeting accuracy (distance to agreement between imaging positioning and therapeutic delivery) and cone alignment (isocenter precision under gantry rotation) were measured using the optical-CT images.
Results
Optical-CT readout of the first 2.5 mm cone dosimeter revealed a significant targeting error of 2.1±0.6 mm and a cone misalignment of 1.3±0.1 mm. After the IGRT hardware and software had been recalibrated, these errors were reduced to 0.5±0.1 mm and 0.18±0.04 mm respectively, within the manufacturer specified 0.5 mm. Results from the 1.0 mm cone were 0.5±0.3 mm targeting accuracy and 0.4±0.1 mm cone misalignment, within the 0.5 mm specification. The results from the 5.0 mm cone were 1.0±0.2 mm targeting accuracy and 0.18±0.06 mm cone misalignment, outside of accuracy specifications.
Conclusion
Quality assurance of small field IGRT targeting and delivery accuracy is a challenging task. The use of a 3D dosimetry technique, where targets are visible on both CBCT and optical-CT, enabled identification and quantification of a targeting error in 3D. After correction, the targeting accuracy of the irradiator was verified to be within 0.5 mm (or 1.0 mm for the 5.0 mm cone) and the cone alignment was verified to be within 0.2 mm (or 0.4 mm for the 1.0 mm cone). The PRESAGE™/DMOS system proved valuable for end-to-end verification of small field IGRT capabilities.
1. Introduction
Small field biological irradiators are designed to deliver radiation to very small volumes (currently ~1 mm3) in living mammals (e.g. mice). The radiobiological effects resulting from irradiation of a primary tumour or an individual healthy organ are used to model the effects of clinical radiation doses delivered during radiation therapy in humans (Taghian and Suit 1999). Achieving precise delivery of radiation to an isolated volume will assist in acquiring the preclinical data to develop clinical organ-at-risk (OAR) guidelines and dose-volume dependencies, such as QUANTEC (Bentzen et al 2010), and determining tumour response to radiation (Kirsch et al 2010). As clinical therapy techniques become more advanced, translational research of this nature requires more complex small field biological irradiators to mimic clinical procedures.
Performing the dosimetric commissioning of small field irradiators presents many well-known challenges (Das et al 2008a, 2008b, Pidikiti et al 2011). A variety of dosimetry techniques have been attempted (Heydarian et al 1996, Olding et al 2011, Babic et al 2009, Wong et al 2009, Pappas et al 2008, Clift et al 2010). In prior work (Newton et al 2011), we demonstrated a combination of 2D and 3D dosimetry techniques (Gafchromic EBT film and a novel PRESAGE™/Optical-CT system (Sakhalkar et al 2009, Thomas et al 2011, Oldham et al 2012) can achieve comprehensive commissioning of the dosimetric aspects of the treatment beams. These methods were applied to commission the X-RAD 225 Cx from Precision X-Ray, which can produce a variety of small circular or square 225kVp photon beams ranging in size from 1 mm to 40 mm in maximum dimension. Commissioning measurements focused on characterizing the radiation beams in terms of percent-depth-dose (PDD), two-dimensional (2D) profiles at various depths, and output factors.
In this work, we moved on to use high-resolution 3D dosimetry techniques to evaluate the accuracy of the image guided targeting capabilities of the X-RAD 225 Cx. The X-RAD 225 is capable of on-board imaging (OBI) with cone-beam-CT (CBCT) for target positioning – a technique known as image-guided radiation therapy (IGRT). This method of IGRT minimizes setup errors by enabling isocentric placement on 3D bony anatomy and soft-tissue image-data at the start of the treatment session. There are no set-up lasers or light-fields on this system. Although conventional Winston-Lutz 2D tests can be used to verify targeting alignment of the larger cones (Benedict et al 2010, Schell et al 1995), this method is not feasible for the smaller cones due to detector resolution. We therefore used a novel high resolution 3D dosimetry system (PRESAGE™/DMOS) to more comprehensively characterize the targeting accuracy for small fields. An additional advantage of 3D dosimetry approach is a comprehensive understanding of any out-of-plane misalignment (i.e. where beams may be skewed but still intersect close to the nominal isocenter). The parameters of particular interest in this study are (i) the isocenter precision under gantry rotation and (ii) the accuracy of coincidence of the imaging and therapeutic mechanical systems and coordinates. During the course of this work, a targeting error was initially identified for the 2.5 mm cone. This error was quantified in 3D and corrected by mechanical realignment and recalibration, after which the isocenter precision and accuracy of coincidence were re-verified.
2. Methods
The accuracy of IGRT treatment was evaluated using cylindrical PRESAGE™ 3D dosimeters, 5 cm in diameter and 5 cm in height. Four physical target points were created in each dosimeter by drilling 1.5 mm diameter channels of varying depth into the top of the PRESAGE™. Channels were parallel to the cylinder axis, and spatially separated in the transaxial plane by approximately of 1.5 cm (Figure 1). The end of each drill channel tapered to a sharp point, corresponding to a target point. Prior to irradiation, the dosimeters were pre-scanned in the DMOSa optical-CT scanner to capture background optical density and transmission losses due to Fresnel reflection (Thomas et al 2011). Channels are filled with refractive matching fluid, but channel edges remain visible due to slight imperfections (rough edges) caused by the drilling process (Figure 1(b)). Hollow channels are clearly visible in the OBI CBCT images in Figure 1(c,d).
Figure 1.

[top row] PRESAGE™ dosimeter optical images prior to irradiation: (a) optical-CT reconstruction showing arrangement of drilled 1.5 mm channels from top-down view of PRESAGE™ dosimeter; (b) projection through dosimeter (DMOS CCD capture) showing the four coplanar treatment planes at varying depths, targeting the tips of the drilled channels. [bottom row] X-RAD 225 Cx on-board CBCT images, showing IGRT target selection at channel tip. Screenshots: (c) sagittal; (d) axial.
IGRT accuracy was measured for cone sizes {1.0, 2.5, 5.0} mm. For each cone size, a pre-drilled and prescanned PRESAGE™ cylinder was taped horizontally onto the X-RAD 225 Cx treatment stage to simulate a rat treatment. CBCT IGRT was performed to position the tip of the drill-channel (the target point) at the isocenter. Images were reconstructed using filtered back-projection and (0.25 mm)3 isotropic voxels. Air within the channels is visible to X-rays from the CBCT, allowing for easy alignment (Figure 1(c,d)). Each of the four target points was treated with a 7 field, equiangular, coplanar treatment delivered with the respective cone. Additionally, one isocentric point below the channels was treated with the same 7 field coplanar setup to provide a measurement of the isocenter diameter where beams have passed through homogeneous media (Figure 1(b)). Each beam delivered about 1 Gy to the isocenter, leading to a total isocentric dose of approximately 7 Gy.
Immediately after irradiation of all targets, the PRESAGE™ dosimeter was imaged in the DMOS optical-CT scanner to measure and record the change in optical density (ΔOD). Post-irradiation scans were corrected by subtracting pre-irradiation scans acquired the day before treatment. In both scans, refractive matching fluid was injected into the drilled channels to minimize refraction artefacts. Scanning a single dosimeter involved acquiring 720 projections over 360 degrees, which took about 20 minutes. The DMOS projections were reconstructed with filtered back-projection (FBP) using a standard truncated ramp filter, |ω| × rect(ω/ω0), after which the 3D reconstructed volumes were smoothed with a (5 vox)3 median filter. For plans using the 2.5 and 5.0 mm cones, the data was reconstructed into (0.5 mm)3 isotropic voxels; for the 1.0 mm cone, (0.3 mm)3 isotropic voxels were used.
The 3D image volumes measured by the DMOS scanner report the ΔOD distribution throughout the PRESAGE™ dosimeter, which is directly proportional to absorbed dose (Sakhalkar et al 2009). The spatial accuracy of the IGRT treatments in 3D was then determined by studying positional discrepancies between the target points and the intersection point of the corresponding treatment beams. For each target, rays were traced along the 7 beam trajectories in the axial plane. The trajectories were determined by finding the centroid of the beam profile at 2 points (entrance and exit). Rays were also traced in the sagittal and coronal planes for each target to analyse the targeting accuracy along the z-axis (superior-inferior).
For our analysis, two criteria were used to evaluate the IGRT accuracy at each target point. We defined isocenter precision under gantry rotation, rc, as the radius of the smallest circle drawn at the isocenter in the axial plane that intersects all beam trajectories. This measurement is taken in the axial plane on which the coplanar treatments were delivered, as shown in Figure 2. The accuracy of coincidence of the imaging and therapeutic systems, rt, was defined as the distance from the mechanical isocenter to the target point (the tip of drilled channel). This is a 3D measurement where components of rt (dx, dy, dz) are measured and used to calculate the magnitude, . In our analysis of the optical-CT images, dx and dy were measured together and presented as in Table 1.
Figure 2.

Definition of the two terms used for analysis of beam trajectories compared to IGRT target. Accuracy of coincidence, rt, is a 3D measurement of distance between mechanical isocenter and target location. Isocenter precision, rc, is the radius of the smallest circle in the axial plane drawn at the isocenter and intersecting all seven beams.
Table 1.
Mean and standard deviation of the isocenter precision, rc, and accuracy of coincidence, rt, for each of the four dosimeters used to test IGRT accuracy on the X-RAD 225 Cx. Numerical measurements display the mean over all target points in the dosimeter, with the standard deviation of the mean given in parentheses. For the accuracy of coincidence measurements, the z-axis represents the superior-inferior axis and the xy-plane represents the axial plane.
| Cone Size [mm] | Voxel size [mm3] | Optical-CT Measurements: mean (1.s.d)
|
|||
|---|---|---|---|---|---|
| Cone Isocenter [mm]
|
Targeting Accuracy [mm]
|
||||
| rc | √(dx2 + dy2) | dz | rt | ||
| 2.5 * | (0.5)3 | 1.3 (0.1) | 0.15 (0.07) | 2.1 (0.6) | 2.1 (0.6)ǂ |
| 2.5 | (0.5)3 | 0.18 (0.04) | 0.2 (0.1) | 0.4 (0.1) | 0.5 (0.1) |
| 1.0 | (0.3)3 | 0.4 (0.1) | 0.3 (0.3) | 0.4 (0.4) | 0.5 (0.3) |
| 5.0 | (0.5)3 | 0.18 (0.06) | 0.4 (0.1) | 0.9 (0.3) | 1.0 (0.2) |
Errors in accuracy of coincidence (rt > 0.5 mm) and isocenter precision (rc > 0.5 mm) were identified using this dosimeter.
Final standard deviation in rt calculated using
The on-board CBCT is registered to the {x,y,z} translational axes of the couch. The dosimeter is securely placed on the couch in a position that is accurately reproducible in the optical-CT scanner due to an asymmetrical registration “cap” that is glued to the bottom of the dosimeter (Thomas et al 2011). The CBCT is used to bring the target point (drilled channel tips) and X-RAD 225 Cx mechanical isocenter into coincidence via targeting software that enables automatic-shifting of the dosimeter/couch within the irradiator. In this way, a targeting error quantified in three dimensions from the optical-CT readout of the dosimeter can be directly translated to a 3D error in the vector space of the treatment couch.
The use of multiple target points in each dosimeter provided the grounds for statistical analysis (mean, standard deviation) of overall system IGRT targeting accuracy. For each dosimeter, the mean and standard deviation of the isocenter precision, rc, was calculated from the five axial planes treated with the 7-beam plan. Similarly, the mean and standard deviation of the accuracy of coincidence, rt, was calculated from the four channel-tip targets.
3. Results and Discussion
For illustrative purposes, Figure 3 shows projection images through the PRESAGE™ dosimeter at an arbitrary angle, before and after irradiation. The four target points are visible on the optical projection image in Figure 3(a), as the tapered ends of the vertical drill-channels. Figure 3(b) shows the same projection after irradiation, in which the co-planar beam tracks and intersection point of each treatment are visible. The additional beam delivery through the homogeneous dosimeter region can also be seen below the drilled channels, which was used in calculating rc, not rt.
Figure 3.
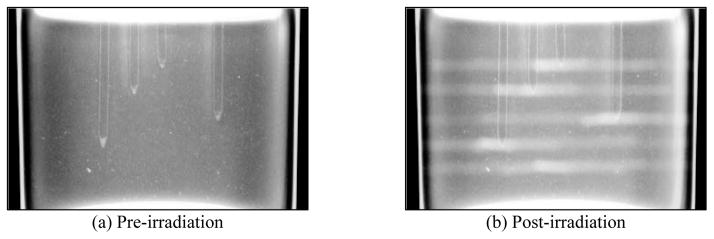
(a) Single optical projection through unirradiated PRESAGE™ dosimeter showing drilled channels, the tips of which represent targets. (b) The same projection post-irradiation, showing a change in optical density caused by the delivered plan (5 × 7-field coplanar Tx, 2.5 mm cone). The isocenter of each coplanar treatment was set at the tip of the drilled channels using the X-RAD 225 Cx IGRT system.
Initial IGRT evaluation of the X-RAD 225 Cx with the 2.5 mm cone identified an isocenter misalignment (rc = 1.3 ± 0.1 mm). This misalignment is apparent in Figure 4(b), where the beam line trajectories do not intersect at the centre of the mechanical isocenter. A large targeting error was also identified in the superior-inferior direction, dz = 2.1 0.6 mm, visible in Figure 4(d) where the beam plane does not intersect with the target channel tip. This was the dominant component in the magnitude of overall accuracy of coincidence, rt = 2.1 ± 0.6 mm (shown in Table 1), which is higher than the manufacturer specification of 0.5 mm. Consequently, the system and online targeting software were re-calibrated by the service engineers following the protocol and using equipment specified by the manufacturer. The measurement was repeated a second time using a new PRESAGE™ dosimeter and the same cone (Figure 5). Analysis of the new dosimeter measurements revealed that, after re-calibration, rc = 0.18 ± 0.04 mm and rt = 0.5 ± 0.1 mm, demonstrating accuracy of the IGRT system within the advertised 0.5 mm. Figure 4 and Figure 5 demonstrate a single axial and sagittal slice through a 3D volume of dosimetry data (a full 3D data set can be viewed in the appendix movies).
Figure 4.

Optical-CT dose distribution reconstruction for the first measurement using the X-RAD 2.5 mm cone, illustrating the targeting error and isocenter misalignment that were identified and subsequently corrected. [top row] (a) An axial slice through the PRESAGE™ dosimeter showing the 7 field coplanar beams. (b) The same axial slice with central beam line annotations highlighting the measurement of isocenter precision, rc, and accuracy of coincidence, rt. [bottom row] (c) A sagittal slice through the same target, with (d) showing central beam line annotations highlighting the presence of a targeting error in the superior-inferior direction, dz.
Figure 5.

Optical-CT dose distribution reconstruction for the repeated 2.5 mm cone measurement performed after the targeting error and the cone misalignment were corrected by enabling the X-RAD 225 Cx automated tracking software. Each subfigure (a–d) corresponds to the respective image in Figure 4.
The outer edge artefacts visible in the axial slices of Figure 4 and Figure 5 are present to some degree in all optical-CT images of cylindrical dosimeters. They are caused by refraction of light at the edge of the dosimeter due to imperfect refractive index matching between the dosimeter and the surrounding matching fluid. (Oldham et al 2001, Rankine and Oldham 2013). Very slight mismatches (~1%) between the refractive indices of the dosimeter and surrounding medium can cause an edge artefact up to 5% of the radius thickness. For 50 mm radius dosimeters, our system has an experimentally documented edge artefact of 4 mm, or 8% of dosimeter radius (Sakhalkar et al 2009).
These initial two PRESAGE™ measurements identified an IGRT error with the 2.5 mm cone (Figure 3 and Figure 4) and confirmed that, after realignment and re-calibration, the IGRT was accurate to within 0.5 mm (i.e. both rc < 0.5 mm and rt < 0.5 mm). The next step was to thoroughly test the IGRT capabilities by repeating the experiment with additional cone sizes. Figure 6 shows several axial slices from the PRESAGE™ dosimeters used to verify the system accuracy for the 1.0 mm and 5.0 mm cones. These measurements were performed after the IGRT re-calibration, and the results of the analysis of the data indicated that IGRT was accurate to within 0.5 mm for the 1.0 mm cone, but slightly worse for the 5.0 mm cone, for which rt = 1.0 ± 0.2 mm. The results for isocenter precision and accuracy of coincidence for all cone sizes are presented in Table 1.
Figure 6.

Optical-CT analysis of PRESAGE™ dosimeter to verify IGRT accuracy. Rows labelled “axial” are axial slices from the optical-CT dosimeter readout, located at the tip of the drilled channels, showing the targeting accuracy in the anterior-posterior and lateral dimensions. Rows labelled “coronal/sagittal” are coronal or sagittal slices from the optical-CT dosimeter readout, showing the targeting accuracy in the superior-inferior dimension. [top rows] Four targets irradiated with 1.0 mm cone, axial and coronal/sagittal optical-CT slices showing accuracy and alignment. [bottom rows] Four targets irradiated with 5.0 mm cone, axial and coronal/sagittal optical-CT slices.
The manufacturer of the X-RAD 225 Cx irradiator states that the system IGRT targeting is accurate to 0.5 mm. Our dosimetry tool, PRESAGE™ dosimeters read by high resolution optical-CT (DMOS), was able to verify this accuracy claim for the 1.0 mm and 2.5 mm cones, but the 5.0 mm cone appeared to be less accurate based solely on the measurement uncertainty. With regards to the accuracy of coincidence, rt, comparing the xy-plane measurement of √(dx2 + dy2) with the superior-inferior z-axis measurement, dz, we notice that the error magnitude is higher in the z-axis direction. This may be attributed to small differences in the outline of the drilled channels in the CBCT and optical-CT images, particularly at the target tip. Users are required to select the treatment target on a CBCT image with (0.25 mm)3 voxels, but the dosimetry measurements are made on the optical-CT data with (0.3 mm)3 or (0.5 mm)3. While this technique is novel for small animal dosimetry, by way of a target that can be viewed on both IGRT and dosimetry systems in three dimensions, some difficulties do arise in determining the exact channel tip in the z direction. A random error is introduced in the analysis process of locating the channel tips, of which the magnitude could be estimated as high as ±(0.252 + 0.52)0.5 mm = ±0.6 mm. If this analysis uncertainty in estimating the z location of the channel tip is combined with the measurement uncertainty in the dz component for the 5.0 mm cone from Table 1, then dz = 0.9 ± 0.7 mm, and the final accuracy of coincidence is rt = 1.0 ± 0.6 mm. Given these combined uncertainties, this result overlaps with the manufacturer accuracy specification; the X-RAD 225 Cx IGRT system was found to be accurate for all cone sizes considering all dosimetric uncertainties. Future developments may include targets with sharper tips, drilled with specialised drill-bits, in order to reduce random error and increase sensitivity to targeting errors.
Isocenter precision was similar for 2.5 mm and 5.0 mm cone attachments, but approximately twice as large for the 1.0 mm cone. This may be due to the poor symmetry of the beam profile when using the 1.0 mm cone (Newton et al 2011). However, compared to the accuracy of coincidence measurements, the isocenter precision was still within the manufacturer specified accuracy for all cone sizes.
With regards to application into radiation studies on live animals (e.g. mice), one major limitation of this work is that we are using a stationary phantom. What our results represent is the best case scenario, where respiration effects do not come into play. Translating precision limits set by cone alignment and targeting accuracy measurements into real live animal irradiation would require an additional term or margin to allow compensation for movement due to respiration or other anatomical motion effects.
4. Conclusion
Determining and monitoring the targeting and delivery accuracy of very small fields (≥1 mm) of the X-RAD 225 Cx is highly challenging. Conventional Winston-Lutz type tests may be unfeasible due to the small field size and detector resolution. The facility for 3D dosimetry enabled identification of an unknown targeting error and comprehensive quantification of the error in three dimensions for a very small field-size (2.5 mm). After this error was corrected, the targeting accuracy of the irradiator was verified to be within 0.5 mm for the 1.0 mm and 2.5 mm cones, and within 1.0 mm for the 5.0 mm cone. The cone alignment, or isocenter radius under gantry rotation, was verified to be within 0.2 mm for 2.5 mm and 5.0 mm cones, and within 0.4 mm for the 1.0 mm cone. These results demonstrate that high-resolution 3D dosimetry techniques can play a valuable role in comprehensive evaluation of IGRT targeting functionality of small field systems.
Supplementary Material
Acknowledgments
This work was supported by NIH R01CA100835, S103034539, NCI 10RR027610, NIAID K02AI093866, and NASA NSCOR NNX11AC60G.
Thank you to Yifan Li for operating the X-RAD 225 Cx.
Footnotes
DMOS technical specifications and diagrams are available in the literature (Thomas et al 2011, Newton et al 2010)
References
- Babic S, McNiven A, Battista J, Jordan K. Three-dimensional dosimetry of small megavoltage radiation fields using radiochromic gels and optical CT scanning. Physics in Medicine and Biology. 2009;54:2463–81. doi: 10.1088/0031-9155/54/8/014. Online: http://www.ncbi.nlm.nih.gov/pubmed/19336848. [DOI] [PubMed] [Google Scholar]
- Benedict SH, Yenice KM, Followill D, Galvin JM, Hinson W, Kavanagh B, Keall P, Lovelock M, Meeks S, Papiez L, Purdie T, Sadagopan R, Schell MC, Salter B, Schlesinger DJ, Shiu AS, Solberg T, Song DY, Stieber V, Timmerman R, Tomé Wa, Verellen D, Wang L, Yin F-F. Stereotactic body radiation therapy: The report of AAPM Task Group 101. Medical Physics. 2010;37:4078–101. doi: 10.1118/1.3438081. Online: http://link.aip.org/link/MPHYA6/v37/i8/p4078/s1&Agg=doi. [DOI] [PubMed] [Google Scholar]
- Bentzen SM, Constine LS, Deasy JO, Eisbruch A, Jackson A, Marks LB, Ten Haken RK, Yorke ED. Quantitative Analyses of Normal Tissue Effects in the Clinic (QUANTEC): an introduction to the scientific issues. International Journal of Radiation Oncology, Biology, Physics. 2010;76:S3–9. doi: 10.1016/j.ijrobp.2009.09.040. Online: http://www.pubmedcentral.nih.gov/articlerender.fcgi?artid=3431964&tool=pmcentrez&rendertype=abstract. [DOI] [PMC free article] [PubMed] [Google Scholar]
- Clift C, Thomas A, Adamovics J, Chang Z, Das I, Oldham M. Toward acquiring comprehensive radiosurgery field commissioning data using the PRESAGE/optical-CT 3D dosimetry system. Physics in Medicine and Biology. 2010;55:1279–93. doi: 10.1088/0031-9155/55/5/002. Online: http://www.pubmedcentral.nih.gov/articlerender.fcgi?artid=3030986&tool=pmcentrez&rendertype=abstract. [DOI] [PMC free article] [PubMed] [Google Scholar]
- Das IJ, Cheng C-W, Watts RJ, Ahnesjö A, Gibbons J, Li XA, Lowenstein J, Mitra RK, Simon WE, Zhu TC. Accelerator beam data commissioning equipment and procedures: Report of the TG-106 of the Therapy Physics Committee of the AAPM. Medical Physics. 2008a;35:4186–215. doi: 10.1118/1.2969070. Online: http://link.aip.org/link/MPHYA6/v35/i9/p4186/s1&Agg=doi. [DOI] [PubMed] [Google Scholar]
- Das IJ, Ding GX, Ahnesjö A. Small fields: Nonequilibrium radiation dosimetry. Medical Physics. 2008b;35:206–15. doi: 10.1118/1.2815356. Online: http://link.aip.org/link/MPHYA6/v35/i1/p206/s1&Agg=doi. [DOI] [PubMed] [Google Scholar]
- Heydarian M, Hoban PW, Beddoea H. A comparison of dosimetry techniques in stereotactic radiosurgery. Physics in Medicine and Biology. 1996;41:93–110. doi: 10.1088/0031-9155/41/1/008. Online: http://www.ncbi.nlm.nih.gov/pubmed/8685261. [DOI] [PubMed] [Google Scholar]
- Kirsch DG, Grimm J, Guimaraes AR, Wojtkiewicz GR, Perez Ba, Santiago PM, Anthony NK, Forbes T, Doppke K, Weissleder R, Jacks T. Imaging primary lung cancers in mice to study radiation biology. International Journal of Radiation Oncology, Biology, Physics. 2010;76:973–7. doi: 10.1016/j.ijrobp.2009.11.038. Online: http://www.pubmedcentral.nih.gov/articlerender.fcgi?artid=2847457&tool=pmcentrez&rendertype=abstract. [DOI] [PMC free article] [PubMed] [Google Scholar]
- Newton J, Oldham M, Thomas A, Li Y, Adamovics J, Kirsch DG, Das S. Commissioning a small-field biological irradiator using point, 2D, and 3D dosimetry techniques. Medical Physics. 2011;38:6754–62. doi: 10.1118/1.3663675. Online: http://www.pubmedcentral.nih.gov/articlerender.fcgi?artid=3247930&tool=pmcentrez&rendertype=abstract. [DOI] [PMC free article] [PubMed] [Google Scholar]
- Newton J, Thomas A, Ibbott G, Oldham M. Preliminary commissioning investigations with the DMOS-RPC optical-CT scanner. Journal of Physics. Conference Series. 2010;250:12078. doi: 10.1088/1742-6596/250/1/012078. Online: http://www.pubmedcentral.nih.gov/articlerender.fcgi?artid=3015184&tool=pmcentrez&rendertype=abstract. [DOI] [PMC free article] [PubMed] [Google Scholar]
- Oldham M, Siewerdsen JH, Shetty A, Jaffray DA. High resolution gel-dosimetry by optical-CT and MR scanning. Medical Physics. 2001;28:1436–45. doi: 10.1118/1.1380430. Online: http://link.aip.org/link/MPHYA6/v28/i7/p1436/s1&Agg=doi. [DOI] [PubMed] [Google Scholar]
- Oldham M, Thomas A, O’Daniel J, Juang T, Ibbott G, Adamovics J, Kirkpatrick JP. A Quality Assurance Method that Utilizes 3D Dosimetry and Facilitates Clinical Interpretation. International Journal of Radiation Oncology, Biology, Physics. 2012;84:540–6. doi: 10.1016/j.ijrobp.2011.12.015. Online: http://www.ncbi.nlm.nih.gov/pubmed/22361085. [DOI] [PMC free article] [PubMed] [Google Scholar]
- Olding T, Holmes O, Dejean P, McAuley KB, Nkongchu K, Santyr G, Schreiner LJ. Small field dose delivery evaluations using cone beam optical computed tomography-based polymer gel dosimetry. Journal of Medical Physics. 2011;36:3–14. doi: 10.4103/0971-6203.75466. Online: http://www.pubmedcentral.nih.gov/articlerender.fcgi?artid=3048952&tool=pmcentrez&rendertype=abstract. [DOI] [PMC free article] [PubMed] [Google Scholar]
- Pappas E, Maris TG, Zacharopoulou F, Papadakis A, Manolopoulos S, Green S, Wojnecki C. Small SRS photon field profile dosimetry performed using a PinPoint air ion chamber, a diamond detector, a novel silicon-diode array (DOSI), and polymer gel dosimetry. Analysis and intercomparison Medical Physics. 2008;35:4640–8. doi: 10.1118/1.2977829. Online: http://link.aip.org/link/MPHYA6/v35/i10/p4640/s1&Agg=doi. [DOI] [PubMed] [Google Scholar]
- Pidikiti R, Stojadinovic S, Speiser M, Song KH, Hager F, Saha D, Solberg TD. Dosimetric characterization of an image-guided stereotactic small animal irradiator. Physics in Medicine and Biology. 2011;56:2585–99. doi: 10.1088/0031-9155/56/8/016. Online: http://www.ncbi.nlm.nih.gov/pubmed/21444969. [DOI] [PubMed] [Google Scholar]
- Rankine L, Oldham M. On the feasibility of optical-CT imaging in media of different refractive index. Medical Physics. 2013;40:051701. doi: 10.1118/1.4798980. Online: http://link.aip.org/link/MPHYA6/v40/i5/p051701/s1&Agg=doi. [DOI] [PMC free article] [PubMed] [Google Scholar]
- Sakhalkar HS, Adamovics J, Ibbott G, Oldham M. A comprehensive evaluation of the PRESAGE/optical-CT 3D dosimetry system. Medical Physics. 2009;36:71–82. doi: 10.1118/1.3005609. Online: http://link.aip.org/link/MPHYA6/v36/i1/p71/s1&Agg=doi. [DOI] [PMC free article] [PubMed] [Google Scholar]
- Schell MC, Bova FJ, Larson DA, Leavitt DD, Lutz WR, Podgorsak EB, Wu A. AAPM Report No. 54, STEREOTACTIC RADIOSURGERY: Report of Task Group 42 Radiation Therapy Committee.1995. [Google Scholar]
- Taghian AG, Suit HD. Animal systems for translational research in radiation oncology. Acta Oncologica. 1999;38:829–38. doi: 10.1080/028418699432518. Online: http://www.ncbi.nlm.nih.gov/pubmed/10606412. [DOI] [PubMed] [Google Scholar]
- Thomas A, Newton J, Adamovics J, Oldham M. Commissioning and benchmarking a 3D dosimetry system for clinical use. Medical Physics. 2011;38:4846. doi: 10.1118/1.3611042. Online: http://link.aip.org/link/MPHYA6/v38/i8/p4846/s1&Agg=doi. [DOI] [PMC free article] [PubMed] [Google Scholar]
- Wong CJ, Ackerly T, He C, Patterson W, Powell CE, Qiao G, Solomon DH, Meder R, Geso M. Small field size dose-profile measurements using gel dosimeters, gafchromic films and micro-thermoluminescent dosimeters. Radiation Measurements. 2009;44:249–56. Online: http://linkinghub.elsevier.com/retrieve/pii/S135044870900064X. [Google Scholar]
Associated Data
This section collects any data citations, data availability statements, or supplementary materials included in this article.