

Abstract
Fructose intake from added sugars has been implicated as a cause of nonalcoholic fatty liver disease. Here we tested the hypothesis that fructose may interact with high fat diet to induce fatty liver, and to determine if this was dependent on a key enzyme in fructose metabolism, fructokinase. Wild type or fructokinase knockout mice were fed a low fat (11%), high fat (36%) or high fat (36%) and high sucrose (30%) diet for 15 weeks. Both wild type and fructokinase knockout mice developed obesity with mild hepatic steatosis and no evidence for hepatic inflammation on a high fat diet compared to a low fat diet. In contrast, wild type mice fed a high fat and high sucrose diet developed more severe hepatic steatosis with low grade inflammation and fibrosis, as noted by increased CD68, TNF-alpha, MCP-1, alpha-smooth muscle actin, and collagen I and TIMP1 expression. These changes were prevented in the fructokinase knockout mice.
Conclusion
An additive effect of high fat and high sucrose diet on the development of hepatic steatosis exists. Further, the combination of sucrose with high fat diet may induce steatohepatitis. The protection in fructokinase knockout mice suggests a key role for fructose (from sucrose) in this development of steatohepatitis. These studies emphasize the important role of fructose in the development of fatty liver and nonalcoholic steatohepatitis (NASH).
MeSH Keywords: nonalcoholic fatty liver disease, hepatic steatosis, hepatic fibrosis, fructose and ketohexokinase
Introduction
Nonalcoholic fatty liver disease (NAFLD) is the most common liver disease in children and adults, and is a hepatic manifestation of obesity and the metabolic syndrome (1). NAFLD includes two entities which have different prognosis: simple hepatic steatosis with no adverse sequelae, and nonalcoholic steatohepatitis (NASH) which has a proven potential to progress to cirrhosis and even hepatocellular carcinoma. Although insulin resistance, oxidative stress, lipid peroxidation, cytokine production including adipokines and innate immunity are likely involved in the pathogenesis of NASH (2-3), the dietary mechanisms causing NASH are less well understood. While total caloric intake may play a role in NAFLD (4), the role of specific nutrients has also received attention. Some epidemiological studies implicate diets higher in saturated fat (5-6). However, NAFLD is also strongly associated with the ingestion of fructose, especially from sweetened beverages (7)(8). The two major sources of fructose are sucrose (table sugar) which consists of 50% fructose and 50% glucose (a disaccharide of glucose and fructose), and high fructose corn syrup (HFCS), which has a varying fructose content, from 42% in pastries to 55 to 65% in fountain drinks (9). The administration of fructose (or sucrose or HFCS) rapidly causes hepatic steatosis in experimental animals (10-12). Hepatic steatosis can even be induced in calorically restricted rats provided the diet is high in sucrose (40%) (11). Dietary sucrose is also essential for the induction of steatohepatitis in mice fed a methionine-choline-deficient diet, and of the two simple sugars, fructose is more cytotoxic than glucose when used as the source of carbohydrate in the methionine-choline-deficient diet formulas (13-14). Subjects with NAFLD also have a history of higher intake of fructose-containing soft drinks with evidence for increased expression of fructose-metabolizing enzymes in their liver (7). After controlling for age, sex, BMI, and total calorie intake, daily fructose consumption was associated with lower steatosis grade and higher fibrosis stage. In older adults, daily fructose consumption was associated with increased hepatic inflammation and hepatocyte ballooning (8). The administration of fructose alone or sugary beverages containing fructose increased de-novo lipogeneisis and hepatic triglyceride storage in humans (15-17). These observations suggest that fructose intake may have an important role in the pathogenesis of NAFLD (7, 18-20).
High fructose consumption causes hepatic steatosis accompanied with intracellular phosphate depletion (21). Fructose is primarily metabolized by fructokinase (ketohexokinase) which exists in two isoforms—fructokinase C and fructokinase A. Fructokinase C is the principal isoform in the liver and is a rapid phosphorylator, and metabolizes fructose to fructose-1-phosphate rapidly, resulting in transient depletion of intracellular phosphate and ATP. In contrast, fructokinase A metabolizes fructose slowly without significant ATP consumption (21). Studies using knockout mice have shown that it is fructokinase C that causes hepatic fat accumulation, and indeed fructokinase A knockout mice show enhanced hepatic fat accumulation compared to wild type mice despite equivalent caloric intake, due to increased metabolism of fructose via the fructokinase C pathway (21). The metabolism of fructose results in nucleotide turnover and uric acid generation that may have a role in inducing mitochondrial oxidative stress and fat accumulation (22-24).
The classic Western diet is high in both saturated fats and in sugar. Given our ability to tease out the role of fructose using fructokinase knockout mice, we decided to test the hypothesis that the interaction of a diet high in sugar and saturated fat in the induction of fatty liver is dependent on fructokinase. While a high saturated fat diet can induce hepatic steatosis, the addition of fructose is required to develop inflammatory and fibrogenic changes associated with NASH.
Materials and Methods
Animal study
Ketohexokinase-A and -C knockout (the KhkΔ/Δ mouse; KHK-A/C KO) mice in C57BL/6 background which lack both ketohexokinase-A and ketohexokinase-C, were generated as described previously (25). KHK-A/C knockout homozygous mice and wild-type (WT) litter mates (male, 10 week-old) were used. They were maintained in temperature- and humidity-controlled specific pathogen-free condition on a 14-hour dark/10-hour light cycle. Custom diets; low fat diet (LFD, D11092101), high fat diet (HFD, D11092102) and high fat high sucrose diet (HFHSD, D11092103), were obtained from Research Diet, Inc. (New Brunswick, NJ, See Supplementary Table 1). In brief, LFD diet consisted of 11% fat-derived calories (9% corn oil and 2.5% butter) and 67.7% carbohydrate-derived calories without sugar. HFD diet consisted of 36% fat derived-calories (9% corn oil and 27% butter) and 43.2% carbohydrate-derived calories without sugar. HFHSD was composed of 36% fat derived-calories (9% corn oil and 27% butter), which is the same as HFD, and 43.2% carbohydrate-derived calories with sucrose (30% sucrose-derived calories). WT mice and KHK-A/C KO mice were assigned into 3 groups respectively; those fed LFD, HFD or HFHSD diet ad libitum for 15 weeks (n = 7-8 per group). Mice had free access to tap water. Body weight and energy intake from the diet were measured every week. Urine samples were collected at 13 weeks using metabolic cages. Mice were sacrificed at the end of the study following 6 hours fasting. At harvest, blood samples were taken, and tissues were fixed in 10% neutral buffered formalin or flash frozen in liquid nitrogen. All animal experiments followed adherence to the NIH Guide for the Care and Use of Laboratory Animals. The animal protocol was approved by the Animal Care and Use Committee of the University of Colorado.
Biochemical analysis
Serum alanine aminotransferase (ALT), aspartate aminotransferase (AST), urea nitrogen, total cholesterol, LDL cholesterol, HDL cholesterol, triglyceride, glucose and uric acid was analyzed using an automated chemistry analyzer (VetACE Clinical Chemistry System, Alfa Wassermann Diagnostic Technologies, West Cauldwell, NJ). Serum level of insulin was determined using an Ultra Sensitive Mouse Insulin ELISA Kit (Crystal Chem, Downers Grove, IL). Fructose concentration was measured using the EnzyChrom fructose assay kit (BioAssay Systems, Hayward, CA). For measurement of uric acid in liver lysates, QuantiChrom uric acid assay kit (BioAssay Systems) was used. For measurement of hepatic triglyceride, liver samples were homogenized in 5% (v/v) nonidet P40 (NP-40) in water, incubated in a water bath at 80°C for 5 minutes, then cooled down to room temperature. Samples were then centrifuged for 2 minutes to remove any insoluble material. Triglyceride levels were then determined using the automated chemistry analyzer (VetACE), then were normalized for protein concentration as measured by the BCA protein assay (Pierce).
Histopathology
Paraffin-embedded sections were stained with H&E or Mallory trichrome. Histological analysis of steatosis and injury was performed using the procedures described by Brunt et al. as modified by Kleiner et al. and expanded for use in rodents by Orlicky et al (26). Images were captured on an Olympus BX51 microscope equipped with a four megapixel Macrofire digital camera (Optronics; Goleta, CA) using the PictureFrame Application 2.3 (Optronics).
Quantitative RT-PCR
Total RNA was extracted using RNeasy mini kit (Qiagen), and then was reverse transcribed using iScript cDNA synthesis kit (Bio-Rad, Hercules, CA). Quantitative real time PCR for mouse KHK-A, KHK-C, tumor necrosis factor-α (TNF-α), α-smooth muscle actin (αSMA) and β-actin was performed using iQ SYBR Green Supermix (Bio-Rad). Primer pairs for mouse KHK-A and KHK-C were as previously described (21). Primer sequences for mouse CD68, TNF-α and αSMA were as follow; CD68, forward, 5′-GTGTCTGATCTTGCTAGGACC-3′: reverse, 5′-TGTGCTTTCTGTGGCTGTAG-3′; TNF-α, forward, 5′-TGCTAGCAAACCACCAAGTG-3′: reverse, 5′-AGATAGCAAATCGGCTGACG-3′; αSMA, forward, 5′-AAACAGGAATACGACGAAG-3′: reverse, 5′-CAGGAATGATTTGGAAAGGA-3′. Quantitative real time PCR for mouse monocyte chemoattractant protein-1 (MCP-1), and for mouse collagen type I (COL1A1) and TIMP metallopeptidase inhibitor 1 (Timp1) was performed using Taqman gene expression assay (Applied Biosystems, Foster City, CA) and Quantitect primer assay (Qiagen) respectively. Amplifications were performed using a Bio-Rad i-Cycler. All PCR data were normalized for mouse β-actin expression.
Western blotting
Protien extraction from mouse tissue, SDS-PAGE and western blotting was performed as described previously (21). Membranes were incubated with primary antibodies for mouse fatty acid synthase (FAS), ATP-citrate lyase (ACL) (Cell Signaling Technology, Danvers, MA), enoyl CoA-hydratase (ECH1, Proteintech, Chicago, IL), NADPH oxidase 4 (NOX4, Santa Cruz Biotechnology, Santa Cruz, CA) or manganese superoxide dismutase (MnSOD, Enzo Life Sciences, Farmingdale, NY) and visualized using a horseradish peroxidase secondary antibody (Cell Signaling Technology, Danvers, MA) and the HRP Immunstar detection kit (Bio-Rad, Hercules, CA). β-actin content was used as an internal control (Cell signaling). Densitometry was performed using Kodak Molecular Imaging software (Kodak, Rochester, NY). To determine mitochondrial NOX4 expression and cytosolic citrate concentration in liver, separation of mitochondrial and cytosolic fractions from liver tissues and citrate measurement were done as described previously (24). Voltage-dependent anion channel 1 (VDAC1, Abcam, Cambridge, MA) was used as mitochondrial loading control.
Detection of Superoxide Generation
Superoxide generation in frozen sections of liver was assessed by staining with dihydroethidium. Fresh cross sections (8 μm) of unfixed frozen liver samples were immediately incubated for 15 minutes at 37°C with 4 μM dihydroethidium, which was diluted in phosphate-buffered saline from 5 mM dihydroethidium (Invitrogen) in dimethyl sulfoxide. Slides were washed with ice-cold phosphate-buffered saline and covere-slipped. Sections were visualized using a Nikon inverted fluorescence microscope, and the fluorescence intensities in randomly selected areas (magnification, 100×) were quantified with Metamorph software (Molecular Devices, Sunnyvale, CA).
Statistical Analysis
All data are presented as the mean ± s.e.m. Independent replicates for each data point (n) are identified in figure legends. Data graphics and statistical analysis were performed using Prism 5 (GraphPad). Data without indications were analyzed by one-way ANOVA, Tukey post hoc test. P < 0.05 was regarded as statistically significant.
Results
Wild type mice (WT) and mice genetically lacking both KHK-A and KHK-C (the KhkΔ/Δ mouse; KHK-A/C KO) were fed low fat diet (LFD), high fat diet (HFD) or high fat high sucrose diet (HFHSD) ad libitum for 15 weeks (n = 7-8 per group). The composition of the diets is shown in Supplementary Table 1 and the specific fatty acid profiles in Supplementary Table 2. The LFD diet consisted of 11% fat-derived calories and 67.7% carbohydrate-derived calories without sugar or fructose. HFD diet consisted of 36% fat derived-calories, which came primarily from butter, and 43.2% calories from carbohydrates without sugar or fructose. In contrast, the HFHSD was composed of 36% fat derived-calories, which is same as HFD, and 43.2% carbohydrate-derived calories with sucrose (30% sucrose-derived calories).
Energy Intake
The effect of the various diets on energy intake is shown in Table 1. Total cumulative energy intake over the 15-week period revealed a stepwise increase, with LFD showing the least energy intake, followed by HFD and HFHSD (Table 1). Nevertheless, when we adjusted the energy intake (daily energy intake was subtracted by urinary fructose and glucose excretion, then divided by body weight), there were no differences between groups (Table 1). The absence of fructokinase did not affect energy intake, and both WT and KHK-A/C KO showed similar energy intakes for the various diets (Table 1). These calculations included correction of loss of fructose in the urine which is known to occur in KHK-A/C KO mice (Table 1).
Table 1.
Characteristics of mice given ad libitum LFD, HFD and HFHSD for 15 weeks.
| WT | KHK-A/C KO | WT HFD vs. WT HFHSD | KHK-A/C KO HFD vs. KHK-A/C KO HFHSD | WT HFHSD vs. KHK-A/C KO HFHSD | |||||
|---|---|---|---|---|---|---|---|---|---|
|
|
|
||||||||
| LFD (n=7) | HFD (n=8) | HFHSD (n=8) | LFD (n=7) | HFD (n=8) | HFHSD (n=7) | ||||
| BW and tissue weight | |||||||||
| Body weight (0W, g) | 27.8 ±0.5 | 27.5 ±0.6 | 27.7 ±0.5 | 27.9 ±0.4 | 28.1 ± 0.5 | 27.3 ±0.6 | N.S. | N.S. | N.S. |
| Body weight (15W, g) | 32.5 ±0.9 | 36.6 ±1.3 * | 41.7 ±1.6 *** | 32.8 ±0.9 | 38.5 ±1.4 * | 39.0 ±1.4 ** | P < 0.05 | N.S. | N.S. |
| ΔBody weight (15W, g) | 4.7 ±0.8 | 9.1 ±1.1 * | 13.9 ±1.4 *** | 4.8 ±0.6 | 10.3±1.1 * | 11.7 ±1.2 ** | P < 0.05 | N.S. | N.S. |
| Liver weight (g) | 1.15 ±0.03 | 1.22 ±0.05 | 1.41 ±0.17 | 1.16 ±0.03 | 1.29 ±0.06 | 1.27 ±0.09 | N.S. | N.S. | N.S. |
| Epididymal fat weight (g) | 1.10±0.12 | 1.91 ±0.18 ** | 2.41 ±0.18 *** | 1.03 ±0.18 | 2.12 ±0.10 *** | 2.44 ±0.19 *** | N.S. | N.S. | N.S. |
| Energy intake | |||||||||
| Cumulative energy intake (kcal) | 1231 ±26.6 | 1349 ±63.7 | 1477 ±35.4 ** | 1274 ±29.1 | 1312 ±29.7 | 1439 ±21.3 ** | N.S. | N.S. | N.S. |
| Daily energy intake per BW (kcal/day/g BW) | 0.398 ±0.01 | 0.397 ±0.02 | 0.404 ±0.01 | 0.396 ±0.01 | 0.392 ±0.02 | 0.405 ±0.02 | N.S. | N.S. | N.S. |
| Urine analysis | |||||||||
| Glucose (kcal/day) | 0.004 ±0.000 | 0.003 ±0.001 | 0.004 ±0.001 | 0.004 ±0.000 | 0.004 ±0.001 | 0.004 ±0.001 | N.S. | N.S. | N.S. |
| Fructose (kcal/day) | 0.000 ±0.000 | 0.000 ±0.000 | 0.005 ±0.002 ** | 0.043 ±0.004a | 0.035 ±0.006a | 0.911 ±0.095 *** | P < 0.01 | P < 0.001 | P < 0.001 |
BW: body weight; Daily energy intake per BW: Daily energy intake was subtracted with urinary excretion of glucose and fructose, then was divided by BW.
P < 0.05,
P < 0.01,
P < 0.001 vs. respective genotype fed LFD.
P < 0.001 vs. WT fed respective diet. N.S., not significant.
Weight gain and Systemic Effects
Figure 1 shows the effect of the various diets on change in body weight. A progressively greater increase in weight was observed in WT mice fed LFD, HFD and HFHSD (Figure 1A). Mice lacking fructokinase also showed higher weight gain with HFD compared to LFD (Figure 1B), and the gain in weight for these two diets were similar when compared to the WT mice (Figure 1C and 1D). However, mice lacking fructokinase showed no increased weight with HFHSD compared to HFD alone (Figure 1B). Nevertheless, the final weight in KHK-A/C KO mice fed HFHSD was not significantly different from WT mice fed HFHSD (Figure 1E), although there was a trend, for lower body weight gain in the knockout mice despite similar energy intake (Table 1). These data suggest that KHK-A/C KO mice are not protected from obesity from diets high in saturated fat but are relatively protected from further weight gain induced by diets containing sucrose.
Figure 1.

WT mice and KHK-A/C KO mice were given ad libitum LFD, HFD or HFHSD for 15 weeks (n = 7-8). (a) Growth curves of WT mice fed LFD, HFD or HFHSD. (b) Growth curves of KHK-A/C KO mice fed LFD, HFD or HFHSD. (c-e) Growth curves of WT mice and KHK-A/C KO mice fed LFD (c), HFD (d) or HFHSD (e). *P < 0.05, **P < 0.01, ***P < 0.001 vs. respective LFD group. #P < 0.05 vs. WT fed HFD.
Consistent with these findings, the administration of a HFD was associated with similar increases in both WT and KHK-A/C KO mice in epididymal fat, and serum LDL and HDL cholesterol compared to LFD (Table 1 and Supplementary Table 3). WT mice administered HFHSD tended to have worse parameters than HFD alone, whereas differences between HFHSD and HFD in KHK-A/C KO mice were minimal. When WT and KHK-A/C KO mice fed HFHSD were compared, the primary difference was in HDL cholesterol which was significantly lower in the WT group compared to the KHK A/C KO mice.
Effects on Liver
Liver weight tended to increase stepwise in wild type mice in response to LFD, HFD and HFHSD respectively (Table 1), and this was associated with a significant stepwise increase in hepatic triglyceride accumulation (Figure 2B) and with the development of macro- and microvesicular steatosis (Figure 2A). Macrovesicular steatosis was observed primarily in the midzonal and peri-portal (zone 1) areas, and microvesicular steatosis was observed primarily in the midzonal area (zone 2) and centrilobular areas (zone 3), and were significantly higher in WT fed HFHSD compared to those fed LFD or HFD (Table 2). Mice lacking fructokinase also showed an increase in liver weight and intrahepatic triglycerides in response to a HFD, but they were protected from the additional effects of sugar (Figure 2, Tables 1 and 2).
Figure 2.
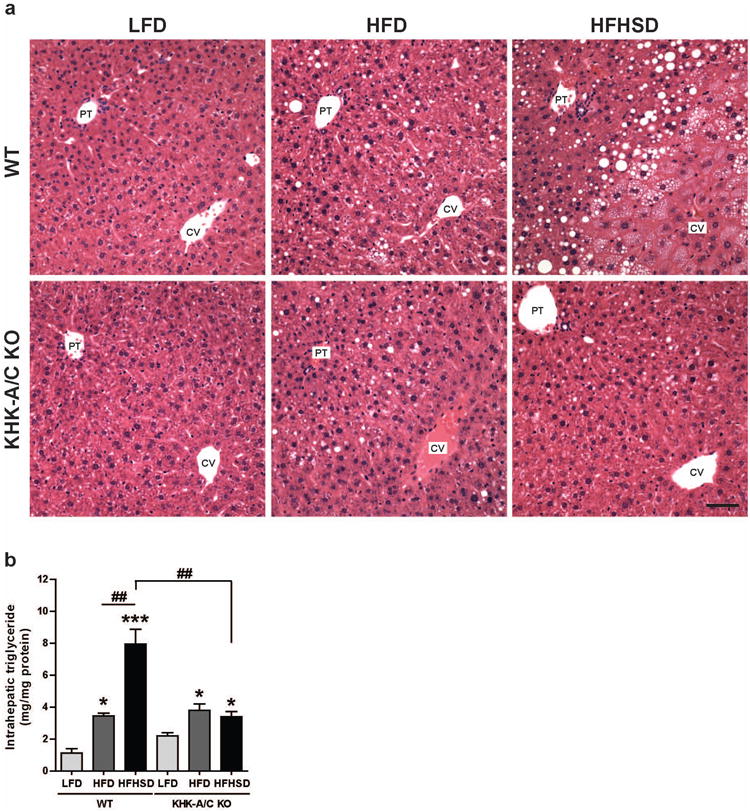
WT mice and KHK-A/C KO mice were given ad libitum LFD, HFD or HFHSD for 15 weeks (n = 7-8). (a) Representative images of H&E stained liver. Bar, 50 μm. CV, central vein. PT, portal triad. (b) Intrahepatic triglyceride levels (n =6). Data represent means (x000B1) s.e.m. *P < 0.05, ***P < 0.001 vs. respective LFD group. ##P < 0.01.
Table 2.
Liver pathology of mice given ad libitum LFD, HFD and HFHSD for 15 weeks.
| Genotype Diet | Wild type | KHK-A/C KO | |||||
|---|---|---|---|---|---|---|---|
|
|
|
||||||
| LFD | HFD | HFHSD | LFD | HFD | HFHSD | ||
| Steatosis | % of hepatocytes | ||||||
| macrovesicular steatosis (zones 1 & 2) | <5% | 6/6 | 4/6 | 0/6 | 5/5 | 3/6 | 4/5 |
| 5-20% | 0/6 | 2/6 | 4/6 | 0/5 | 3/6 | 1/5 | |
| >20% | 0/6 | 0/6 | 2/6 | 0/5 | 0/6 | 0/5 | |
| microvesicular steatosis (zones 2 & 3) | <10% | 6/6 | 6/6 | 0/6 | 5/5 | 3/6 | 4/5 |
| 10-33% | 0/6 | 0/6 | 2/6 | 0/5 | 3/6 | 1/5 | |
| >33% | 0/6 | 0/6 | 4/6 | 0/5 | 0/6 | 0/5 | |
| Fibrosis | |||||||
| mild | 0/6 | 2/6 | 5/6 | 0/5 | 0/6 | 1/5 | |
| moderate - severe | 0/6 | 0/6 | 0/6 | 0/5 | 0/6 | 0/5 | |
Whereas WT mice fed HFD developed mild hepatic steatosis, WT mice fed HFHSD developed severe steatosis associated with mild inflammation and fibrosis. Inflammation including microgranuloma, lipogranuloma and portal fibrosis was present focally in WT mice fed HFHSD but not in the other groups (Supplementary Figure 1). HFHSD was also associated with increased serum AST and ALT levels with elevated intrahepatic expression of TNF-α in WT mice (Figure 3A-C). Liver tissue from WT animals fed a HFHSD also demonstrated an increased expression of the chemotactic factor, MCP-1 and the monocyte-macrophage marker CD68 (Figure 3D and 3E).
Figure 3.

WT mice and KHK-A/C KO mice were given ad libitum LFD, HFD or HFHSD for 15 weeks (n = 7-8). (a) Serum aspartate aminotransferase (AST) levels (n = 7-8). (b) Serum alanine aminotransferase (ALT) levels (n = 7-8). (c-e) Quantitative real-time PCR for mouse tumor necrosis factor α (TNF-α, c), monocyte chemoattractant protein-1 (MCP-1, d) and CD68 (e) (n = 6-7). β-actin was used as a internal control. Data represent means (x000B1) s.e.m. *P < 0.05, **P < 0.01, ***P < 0.001 vs. respective LFD group. #P < 0.05. ##P < 0.01. ### P < 0.001.
Trichrome-stained liver from WT fed HFHSD also demonstrated a mild sinusoidal fibrosis in the periportal area that radiated out into the midzonal regions (Figure 4A, Table 2 and Supplementary Figure 2), with increased hepatic expression of collagen type I (COL1A1) (Figure 4B) and TIMP1 (Figure 4C), the latter which regulates extracellular matrix turnover. This was associated with increased expression of the myofibroblast marker, α-smooth muscle actin (α-SMA) which is a marker for hepatic stellate cell (Ito cell) activation which occurs with fibrosing diseases (Figure 4D).
Figure 4.
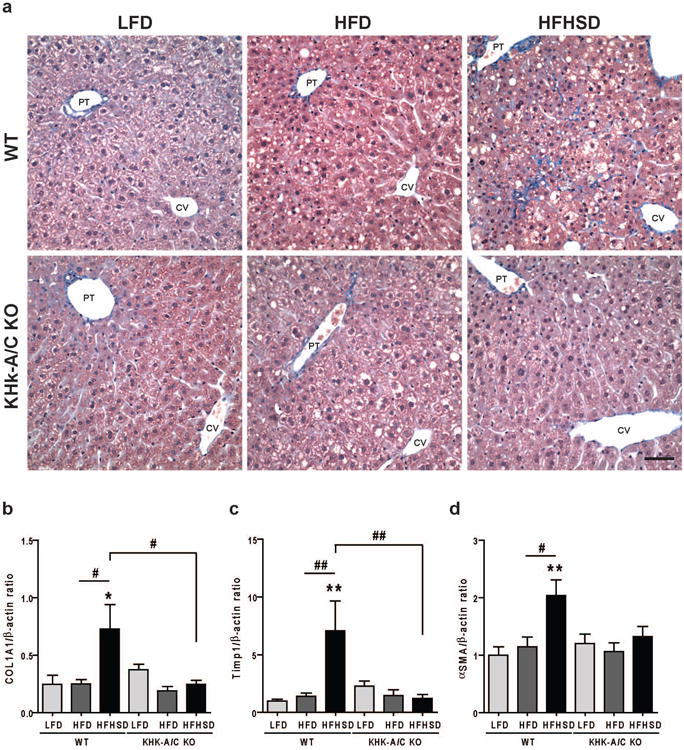
WT mice and KHK-A/C KO mice were given ad libitum LFD, HFD or HFHSD for 15 weeks (n = 7-8). (a) Representative images of trichrome stained liver. Bar, 50 μm. CV, central vein. PT, portal triad. (b-d) Quantitative real-time PCR for mouse collagen type I (COL1A1, b), mouse TIMP metallopeptidase inhibitor 1 (Timp1, c) and α-smooth muscle actin (αSMA, d) in liver (n = 6-7). β-actin was used as an internal control. Data represent means (x000B1) s.e.m. *P < 0.05, **P < 0.01 vs. respective LFD group. #P < 0.05. ##P < 0.01.
While WT mice fed a HFHSD showed these features of liver inflammation and fibrosis, all of these changes were absent in KHK-A/C KO mice fed equivalent calories of HFHSD (Figures 3 and 4 and Table 2)
Hepatic Fructose Metabolism
Since sucrose is a source of fructose, we measured serum and intrahepatic fructose levels in our mice (Figure 5). Fructose levels tended to increase in the serum in WT mice on a HFHSD with a greater and significant rise in intrahepatic fructose levels (Figure 5A). Interestingly, a milder but still significant rise in hepatic fructose was observed in WT mice fed HFD alone, suggesting some endogenous production of fructose in these mice (Figure 5A). Fructose and sucrose intake are known to upregulate fructokinase expression (11, 23), and we also observed an increase in KHK-C but not KHK-A isoform expression in the WT mice fed a HFHSD (Figure 5B). Although, no major changes in protein expression among WT mice was observed for fatty acid synthase (FAS) or enoyl CoA hydratase-1 (ECH1) which are involved in hepatic fat synthesis and fatty acid oxidation, respectively, we found increased ATP citrate lyase which is also involved in hepatic fat synthesis (Figure 5C-E and Supplementary Figure 3). However, we did observe an increase in both serum and intrahepatic uric acid levels (Figure 5F) in WT mice fed a HFHSD, which reflects fructose metabolism (27), and was associated with indirect evidence for mitochondrial oxidative stress, as noted by a increased superoxide generation, increased mitochondrial NOX4 and a decreased expression of manganese superoxide dismutase (MnSOD) (Figure 6).
Figure 5.

WT mice and KHK-A/C KO mice were given ad libitum LFD, HFD or HFHSD for 15 weeks (n = 7-8). (a) Left panel: Serum fructose concentration (n = 7-8). Right panel: Fructose content in liver (n = 6). (b) Quantitative real-time PCR for mouse KHK-C (left panel) and KHK-A (right panel) in liver (n = 6-7). (c-e) Western blot analysis of mouse fatty acid synthase (FAS, c), ATP citrate lyase (ACL, d) and mouse enoyl CoA-hydratase (ECH1, e) in liver (n = 4). β-actin was used as an internal control. (f) Left panel: Serum uric acid concentration (n = 7-8). Right panel: Uric acid content in liver (n = 6). Data represent means (x000B1) s.e.m. *P < 0.05, **P < 0.01, ***P < 0.001 vs. respective LFD group. #P < 0.05. ##P < 0.01. ### P < 0.001. a, P < 0.05 by t-test. N.S., not significant.
Figure 6.

WT mice and KHK-A/C KO mice were given ad libitum LFD, HFD or HFHSD for 15 weeks. (a, b) Dihydroethidium staining of the liver. (a) Representative images. Bar, 100 μm. (b) Quantification of fluorescence intensities (n = 3). (c) Western blot analysis of manganese superoxide dismutase (MnSOD) in liver (n = 4). β-actin was used as an internal control. (d) Western blot analysis of mitochondrial NADPH oxidase 4 (NOX4) in liver (n = 4). Voltage-dependent anion channel 1(VDAC1) was used as mitochondrial loading control. Data represent means (x000B1) s.e.m. *P < 0.05, **P < 0.01, ***P < 0.001 vs. respective LFD group. #P < 0.05. ##P < 0.01. ### P < 0.001.
Mice lacking fructokinase showed the expected increase in serum fructose levels regardless of diet (21) in association with absent expression of both KHK isoforms in the liver (Figures 5A and 5B). Interestingly, while no change in FAS and ACL expression was observed among the various diets, there was increased expression of ECH1 with the administration of either HFD or HFHSD, and the difference between WT HFHSD and KHK A/C HFHSD was significant (Figure 5C-E). The lack of fructokinase also prevented the increase in serum and hepatic uric acid and superoxide generation and mitochondrial NOX4, and blocked the decrease in MnSOD that occurred with a HFHSD in the WT mice (Figures 5F and Figure 6).
Discussion
Classic Western diets are high in both saturated fat and sugar, and both have been implicated in the development of NAFLD. Based on previous studies from our group in which we showed that fructose can induce fatty liver via a fructokinase-dependent pathway (21), we decided to test the hypothesis that fructokinase mediates fatty liver in mice fed a Western diet. To tease out the role of various diets, we compared the ability of a low fat diet (11% fat), high fat diet (36% fat), or a high fat (36%) and high sucrose (30%) diet to induce fatty liver in mice. The high fat diet consisted primarily of butter (27% of total calorie) which is rich in saturated fat, and corn oil (9% of total calorie) which is rich in omega-6 polyunsaturated fatty acids, both of which have been implicated in the development of metabolic syndrome and NAFLD. These diets were selected as they are similar to current Western diet and the various components are within the range of physiological intake.
A diet high in saturated fat resulted in increased total energy intake associated with increased weight gain, epididymal fat, elevated plasma lipid levels and mild fatty liver. These changes were also observed in the fructokinase knockout mice, demonstrating that they are not protected from obesity from a high fat diet.
In association with the development of obesity with a high fat diet, both WT and KHK A/C knockout mice developed mild hepatic steatosis. These data cannot resolve if the development of steatosis is simply from excessive caloric intake or whether it is specific to the increase in saturated fats and omega-6 polyunsaturated fatty acids. Importantly, however, the development of steatosis from a HFD diet alone did not induce inflammation or fibrosis. These data suggest that a high fat diet may act primarily as a mechanism for causing hepatic steatosis.
Whereas a high fat diet was only capable of inducing steatosis, wild type mice fed both a high fat and high sucrose diet developed more severe steatosis with inflammation (noted by increased MCP-1, CD68 and TNF-α expression), oxidative stress, myofibroblasts (α-SMA1 expression), and collagen deposition, in association with increased serum AST and ALT levels. Importantly, mice lacking fructokinase fed a HFHSD were completely protected from the development of hepatic inflammation and fibrosis despite similar energy intake.
Recently the mechanism for fructose-induced fatty liver has been shown to be dependent on fructokinase C (21). Fructokinase C is distinct from most nutrition-based enzymes since it causes transient ATP depletion prior to the downstream production of ATP. Indeed, the administration of either intravenous or oral fructose to humans can result in transient ATP depletion and is greater in subjects with NAFLD (28-31). The greater ATP depletion in NAFLD may result from higher levels of fructokinase (7) as higher levels of fructokinase result in greater metabolic effects for the same dose of fructose (23). Subjects with NAFLD who have a higher fructose intake show a greater ATP depletion to intravenous fructose (28). In turn, the nucleotide turnover associated with fructose metabolism results in the production of uric acid which can induce mitochondrial oxidative stress and the accumulation of lipids in the liver (22-24). Consistent with these findings, we observed an increase in hepatic uric acid levels with a increased superoxide generation, increased mitochondrial NOX4 and a decrease in the mitochondrial antioxidant, MnSOD in the wild type HFHSD fed mice but not in KHK A/C KO mice fed the same diet.
A limitation of our study is that a low fat, high sucrose diet was not included, and hence it is difficult to determine if the effect of high sucrose diet acted synergistically with high fat diet or whether it was additive. To address this question, we compared our current results with our previous study in which WT mice were fed normal chow with 15% (w/v) fructose, or 30% (w/v) fructose in the drinking water, or with tap water for 25 weeks (21). The mice fed 15% fructose water consumed 32% of their total energy intake from fructose (high fructose) and 12.2% of total energy intake from fat (low fat), and hence they had a comparable low fat diet to our LFD group, but a higher fructose intake than our HFHSD group. The mice fed 30% fructose water consumed even higher amounts of fructose (45% of their total energy intake from fructose (very high fructose)) with a comparable low fat intake (9.9% of total energy intake from fat (low fat) (Supplementary Table 4). Despite ingesting more fructose and for a longer period than the current study, the intrahepatic triglyceride was significantly lower than that observed in our mice fed HFHSD (WT fed HFHSD, 7.94 ± 0.95 mg/mg protein; WT fed low fat high fructose diet (HFrD), 2.47 ± 0.34 mg/mg protein, WT fed low fat very high fructose diet (VHFrD), 4.81 ± 0.52 mg/mg protein, Supplementary Figure 4). We also determined retrospectively whether there was increased inflammation or fibrosis in the mice fed a low fat, high fructose diet. Interestingly, the mice fed fructose water did not show inflammation in liver either by H&E staining or quantitative PCR for MCP-1 and CD68 (Supplementary Figure 5). Mild fibrosis, which was less than that observed in WT fed HFHSD, was found only in some WT mice fed VHFrD, although the expression of collagen type I was not increased (Supplementary Figure 5). These studies suggest that while fructose intake can easily induce hepatic steatosis, the addition of high fat diet results in a synergistic effect to increase liver fat and to induce inflammation and fibrosis in liver, and that those were dependent on fructokinase.
A second limitation of the study is that we only examined one time point (15 weeks). It remains possible that longer treatment with a high fat diet may have resulted in worse steatosis and inflammation. Hence, we cannot exclude the possibility that high fat diet alone may not be able to cause some inflammatory changes. Nevertheless, it is evident that the combination of sugar and high fat diet resulted in inflammatory and fibrotic changes that were not observed in mice fed high fat diet alone (this study) or with high fructose diet alone (see above). Hence, we can safely conclude that the combination of sugar and fat resulted in an acceleration of the liver disease from steatosis towards NASH. An additive effect of a high sucrose diet and high fat diet on hepatic lipid accumulation has also been reported by others (32), but this study shows that it is associated with the development of steatohepatitis.
In conclusion, our studies suggest that the combination of high fat diet and high sugar intake rich in fructose can induce hepatic steatosis and mild inflammation and fibrosis consistent with early NASH. The main novelty of the current study is the demonstration that the development of hepatic inflammation and fibrosis required the combination of sucrose and high fat diet, and that it could be prevented in mice lacking fructokinase. Specifically, our studies suggest that while obesity from a high fat diet may be associated with mild hepatic steatosis, that the addition of fructose-containing beverages accelerated the progression to NASH. We further show that NASH is prevented in the fructokinase knockout mouse despite similar total energy intake, consistent with the finding that inflammation and fibrosis occurs as a direct consequence of the unique metabolism of fructose. Further studies investigating the role of fructose and fructokinase in the etiology of NAFLD appear warranted.
Supplementary Material
Acknowledgments
We thank Brandi Hunter for her technical assistance. Funding: Supported by startup funds to Dr Richard Johnson from the Department of Medicine at the University of Colorado Denver, and by grants from NIH (DK-038088) and Diabetes UK (RD04/0002833).
Footnotes
Disclosures: Drs Ishimoto, Lanaspa, and Johnson have patent applications with the University of Colorado related to the inhibition of fructokinase and its isoforms for the treatment of metabolic disorders including NAFLD. Dr Johnson is author of two lay books on the topic of fructose and metabolic syndrome, including The Sugar Fix (Rodale, 2008) and The Fat Switch (Mercola.com, 2012).
References
- 1.Pagano G, Pacini G, Musso G, Gambino R, Mecca F, Depetris N, Cassader M, et al. Nonalcoholic steatohepatitis, insulin resistance, and metabolic syndrome: further evidence for an etiologic association. Hepatology. 2002;35:367–372. doi: 10.1053/jhep.2002.30690. [DOI] [PubMed] [Google Scholar]
- 2.Tilg H, Moschen AR. Evolution of inflammation in nonalcoholic fatty liver disease: the multiple parallel hits hypothesis. Hepatology. 2010;52:1836–1846. doi: 10.1002/hep.24001. [DOI] [PubMed] [Google Scholar]
- 3.Yilmaz Y. Review article: is non-alcoholic fatty liver disease a spectrum, or are steatosis and non-alcoholic steatohepatitis distinct conditions? Aliment Pharmacol Ther. 2012;36:815–823. doi: 10.1111/apt.12046. [DOI] [PubMed] [Google Scholar]
- 4.Kechagias S, Ernersson A, Dahlqvist O, Lundberg P, Lindstrom T, Nystrom FH. Fast-food-based hyper-alimentation can induce rapid and profound elevation of serum alanine aminotransferase in healthy subjects. Gut. 2008;57:649–654. doi: 10.1136/gut.2007.131797. [DOI] [PMC free article] [PubMed] [Google Scholar]
- 5.Musso G, Gambino R, De Michieli F, Cassader M, Rizzetto M, Durazzo M, Faga E, et al. Dietary habits and their relations to insulin resistance and postprandial lipemia in nonalcoholic steatohepatitis. Hepatology. 2003;37:909–916. doi: 10.1053/jhep.2003.50132. [DOI] [PubMed] [Google Scholar]
- 6.Toshimitsu K, Matsuura B, Ohkubo I, Niiya T, Furukawa S, Hiasa Y, Kawamura M, et al. Dietary habits and nutrient intake in non-alcoholic steatohepatitis. Nutrition. 2007;23:46–52. doi: 10.1016/j.nut.2006.09.004. [DOI] [PubMed] [Google Scholar]
- 7.Ouyang X, Cirillo P, Sautin Y, McCall S, Bruchette JL, Diehl AM, Johnson RJ, et al. Fructose consumption as a risk factor for non-alcoholic fatty liver disease. J Hepatol. 2008;48:993–999. doi: 10.1016/j.jhep.2008.02.011. [DOI] [PMC free article] [PubMed] [Google Scholar]
- 8.Abdelmalek MF, Suzuki A, Guy C, Unalp-Arida A, Colvin R, Johnson RJ, Diehl AM. Increased fructose consumption is associated with fibrosis severity in patients with nonalcoholic fatty liver disease. Hepatology. 2010;51:1961–1971. doi: 10.1002/hep.23535. [DOI] [PMC free article] [PubMed] [Google Scholar]
- 9.Ventura EE, Davis JN, Goran MI. Sugar content of popular sweetened beverages based on objective laboratory analysis: focus on fructose content. Obesity (Silver Spring) 2011;19:868–874. doi: 10.1038/oby.2010.255. [DOI] [PubMed] [Google Scholar]
- 10.Ackerman Z, Oron-Herman M, Grozovski M, Rosenthal T, Pappo O, Link G, Sela BA. Fructose-induced fatty liver disease: hepatic effects of blood pressure and plasma triglyceride reduction. Hypertension. 2005;45:1012–1018. doi: 10.1161/01.HYP.0000164570.20420.67. [DOI] [PubMed] [Google Scholar]
- 11.Roncal-Jimenez CA, Lanaspa MA, Rivard CJ, Nakagawa T, Sanchez-Lozada LG, Jalal D, Andres-Hernando A, et al. Sucrose induces fatty liver and pancreatic inflammation in male breeder rats independent of excess energy intake. Metabolism. 2011;60:1259–1270. doi: 10.1016/j.metabol.2011.01.008. [DOI] [PMC free article] [PubMed] [Google Scholar]
- 12.Collison KS, Maqbool ZM, Inglis AL, Makhoul NJ, Saleh SM, Bakheet RH, Al-Johi MA, et al. Effect of dietary monosodium glutamate on HFCS-induced hepatic steatosis: expression profiles in the liver and visceral fat. Obesity (Silver Spring) 2010;18:1122–1134. doi: 10.1038/oby.2009.502. [DOI] [PubMed] [Google Scholar]
- 13.Pickens MK, Yan JS, Ng RK, Ogata H, Grenert JP, Beysen C, Turner SM, et al. Dietary sucrose is essential to the development of liver injury in the methionine-choline-deficient model of steatohepatitis. J Lipid Res. 2009;50:2072–2082. doi: 10.1194/jlr.M900022-JLR200. [DOI] [PMC free article] [PubMed] [Google Scholar]
- 14.Pickens MK, Ogata H, Soon RK, Grenert JP, Maher JJ. Dietary fructose exacerbates hepatocellular injury when incorporated into a methionine-choline-deficient diet. Liver Int. 2010;30:1229–1239. doi: 10.1111/j.1478-3231.2010.02285.x. [DOI] [PMC free article] [PubMed] [Google Scholar]
- 15.Maersk M, Belza A, Stodkilde-Jorgensen H, Ringgaard S, Chabanova E, Thomsen H, Pedersen SB, et al. Sucrose-sweetened beverages increase fat storage in the liver, muscle, and visceral fat depot: a 6-mo randomized intervention study. Am J Clin Nutr. 2012;95:283–289. doi: 10.3945/ajcn.111.022533. [DOI] [PubMed] [Google Scholar]
- 16.Faeh D, Minehira K, Schwarz JM, Periasamy R, Park S, Tappy L. Effect of fructose overfeeding and fish oil administration on hepatic de novo lipogenesis and insulin sensitivity in healthy men. Diabetes. 2005;54:1907–1913. doi: 10.2337/diabetes.54.7.1907. [DOI] [PubMed] [Google Scholar]
- 17.Le KA, Ith M, Kreis R, Faeh D, Bortolotti M, Tran C, Boesch C, et al. Fructose overconsumption causes dyslipidemia and ectopic lipid deposition in healthy subjects with and without a family history of type 2 diabetes. Am J Clin Nutr. 2009;89:1760–1765. doi: 10.3945/ajcn.2008.27336. [DOI] [PubMed] [Google Scholar]
- 18.Lim JS, Mietus-Snyder M, Valente A, Schwarz JM, Lustig RH. The role of fructose in the pathogenesis of NAFLD and the metabolic syndrome. Nat Rev Gastroenterol Hepatol. 2010;7:251–264. doi: 10.1038/nrgastro.2010.41. [DOI] [PubMed] [Google Scholar]
- 19.Nomura K, Yamanouchi T. The role of fructose-enriched diets in mechanisms of nonalcoholic fatty liver disease. J Nutr Biochem. 2012;23:203–208. doi: 10.1016/j.jnutbio.2011.09.006. [DOI] [PubMed] [Google Scholar]
- 20.Collison KS, Saleh SM, Bakheet RH, Al-Rabiah RK, Inglis AL, Makhoul NJ, Maqbool ZM, et al. Diabetes of the Liver: The Link Between Nonalcoholic Fatty Liver Disease and HFCS-55. Obesity (Silver Spring) 2009 doi: 10.1038/oby.2009.58. [DOI] [PubMed] [Google Scholar]
- 21.Ishimoto T, Lanaspa MA, Le MT, Garcia GE, Diggle CP, Maclean PS, Jackman MR, et al. Opposing effects of fructokinase C and A isoforms on fructose-induced metabolic syndrome in mice. Proc Natl Acad Sci U S A. 2012;109:4320–4325. doi: 10.1073/pnas.1119908109. [DOI] [PMC free article] [PubMed] [Google Scholar]
- 22.Lanaspa MA, Cicerchi C, Garcia G, Li N, Roncal-Jimenez CA, Rivard CJ, Hunter B, et al. Counteracting Roles of AMP Deaminase and AMP Kinase in the Development of Fatty Liver. PLoS ONE. 2012;7:e48801. doi: 10.1371/journal.pone.0048801. [DOI] [PMC free article] [PubMed] [Google Scholar]
- 23.Lanaspa MA, Sanchez-Lozada LG, Cicerchi C, Li N, Roncal-Jimenez CA, Ishimoto T, Le M, et al. Uric Acid stimulates fructokinase and accelerates fructose metabolism in the development of Fatty liver. PLoS ONE. 2012;7:e47948. doi: 10.1371/journal.pone.0047948. [DOI] [PMC free article] [PubMed] [Google Scholar]
- 24.Lanaspa MA, Sanchez-Lozada LG, Choi YJ, Cicerchi C, Kanbay M, Roncal-Jimenez CA, Ishimoto T, et al. Uric acid induces hepatic steatosis by generation of mitochondrial oxidative stress: potential role in fructose-dependent and -independent fatty liver. J Biol Chem. 2012;287:40732–40744. doi: 10.1074/jbc.M112.399899. [DOI] [PMC free article] [PubMed] [Google Scholar]
- 25.Diggle CP, Shires M, Leitch D, Brooke D, Carr IM, Markham AF, Hayward BE, et al. Ketohexokinase: expression and localization of the principal fructose-metabolizing enzyme. J Histochem Cytochem. 2009;57:763–774. doi: 10.1369/jhc.2009.953190. [DOI] [PMC free article] [PubMed] [Google Scholar]
- 26.Orlicky DJ, Roede JR, Bales E, Greenwood C, Greenberg A, Petersen D, McManaman JL. Chronic ethanol consumption in mice alters hepatocyte lipid droplet properties. Alcohol Clin Exp Res. 2011;35:1020–1033. doi: 10.1111/j.1530-0277.2011.01434.x. [DOI] [PMC free article] [PubMed] [Google Scholar]
- 27.Raivio KO, Becker A, Meyer LJ, Greene ML, Nuki G, Seegmiller JE. Stimulation of human purine synthesis de novo by fructose infusion. Metabolism. 1975;24:861–869. doi: 10.1016/0026-0495(75)90133-x. [DOI] [PubMed] [Google Scholar]
- 28.Abdelmalek MF, Lazo M, Horska A, Bonekamp S, Lipkin EW, Balasubramanyam A, Bantle JP, et al. Higher dietary fructose is associated with impaired hepatic adenosine triphosphate homeostasis in obese individuals with type 2 diabetes. Hepatology. 2012;56:952–960. doi: 10.1002/hep.25741. [DOI] [PMC free article] [PubMed] [Google Scholar]
- 29.Cortez-Pinto H, Chatham J, Chacko VP, Arnold C, Rashid A, Diehl AM. Alterations in liver ATP homeostasis in human nonalcoholic steatohepatitis: a pilot study. Jama. 1999;282:1659–1664. doi: 10.1001/jama.282.17.1659. [DOI] [PubMed] [Google Scholar]
- 30.Nair S, V PC, Arnold C, Diehl AM. Hepatic ATP reserve and efficiency of replenishing: comparison between obese and nonobese normal individuals. Am J Gastroenterol. 2003;98:466–470. doi: 10.1111/j.1572-0241.2003.07221.x. [DOI] [PubMed] [Google Scholar]
- 31.Bawden SJ, Stephenson MC, Marciani L, Aithal GP, Macdonald IA, Gowland PA, Morris PA. Investigating Alterations in Hepatic ATP levels following Fructose and Fructose+Glucose Ingestion: A Simple Non-invasive Technique to Assess Liver Function Using 31P MRS. Proc Intl Soc Mag Reson Med. 2012;20:1369. [Google Scholar]
- 32.Sobrecases H, Le KA, Bortolotti M, Schneiter P, Ith M, Kreis R, Boesch C, et al. Effects of short-term overfeeding with fructose, fat and fructose plus fat on plasma and hepatic lipids in healthy men. Diabetes Metab. 2010;36:244–246. doi: 10.1016/j.diabet.2010.03.003. [DOI] [PubMed] [Google Scholar]
Associated Data
This section collects any data citations, data availability statements, or supplementary materials included in this article.