

Background: The nature of the activated form of heterotrimeric Gi/o proteins is unclear.
Results: Non-modified Gi/o heterotrimers dissociate upon activation, whereas fluorescently labeled Gi/o heterotrimers dissociate or rearrange depending on fluorescent protein localization.
Conclusion: Dissociated GαGTP and Gβγ subunits represent the major activated form of Gi/o proteins.
Significance: The identification of the Gi/o protein activated form is crucial for the elucidation of signaling mechanisms and rational drug design.
Keywords: Adrenergic Receptor, Cell Signaling, Heterotrimeric G Proteins, Membrane Proteins, Microscopic Imaging, Plasma Membrane, Potassium Channels, Two-photon Polarization Microscopy
Abstract
Although most heterotrimeric G proteins are thought to dissociate into Gα and Gβγ subunits upon activation, the evidence in the Gi/o family has long been inconsistent and contradictory. The Gi/o protein family mediates inhibition of cAMP production and regulates the activity of ion channels. On the basis of experimental evidence, both heterotrimer dissociation and rearrangement have been postulated as crucial steps of Gi/o protein activation and signal transduction. We have now investigated the process of Gi/o activation in living cells directly by two-photon polarization microscopy and indirectly by observations of G protein-coupled receptor kinase-derived polypeptides. Our observations of existing fluorescently labeled and non-modified Gαi/o constructs indicate that the molecular mechanism of Gαi/o activation is affected by the presence and localization of the fluorescent label. All investigated non-labeled, non-modified Gi/o complexes dissociate extensively upon activation. The dissociated subunits can activate downstream effectors and are thus likely to be the major activated Gi/o form. Constructs of Gαi/o subunits fluorescently labeled at the N terminus (GAP43-CFP-Gαi/o) seem to faithfully reproduce the behavior of the non-modified Gαi/o subunits. Gαi constructs labeled within the helical domain (Gαi-L91-YFP) largely do not dissociate upon activation, yet still activate downstream effectors, suggesting that the dissociation seen in non-modified Gαi/o proteins is not required for downstream signaling. Our results appear to reconcile disparate published data and settle a long running dispute.
Introduction
Heterotrimeric G proteins (consisting of Gα, Gβ, and Gγ subunits) are an important part of the cellular signal transduction system. They serve as transducers and amplifiers of signals from G protein-coupled receptors to intracellular effectors. Activation of G protein-coupled receptors leads to an exchange of a molecule of GDP bound to an inactive Gα subunit for a molecule of GTP, causing changes in the G protein complex, termed “activation.” Both the activated GTP-bound Gα subunits and the Gβγ dimers can modulate the activity of effectors such as adenylate cyclase, phospholipase C, or G protein-regulated inward rectifying potassium (GIRK)2 channels. Hydrolysis of GTP to GDP, because of a GTPase activity of the Gα subunit, leads to a return of the G protein molecule into the inactive state.
The Gi/o family of G proteins inhibits adenylate cyclase activity (decreasing the intracellular cAMP concentration) and activates GIRK channels (hyperpolarizing the cell membrane). However, it is not clear how activation of Gi/o proteins leads to these downstream signaling events. Despite a number of published studies, even the molecular identity of the activated state of the Gi/o proteins remains disputed (1–4). One model (5) postulates that the G protein heterotrimer dissociates into a GTP-bound Gα subunit (GαGTP) and a Gβγ dimer, whereas another model (6) proposes that the G protein heterotrimer becomes rearranged but does not dissociate upon activation. A combined model (2, 7) asserts an equilibrium between dissociated and intact G protein heterotrimers in the active state. It is, however, unclear whether interactions with effectors are mediated by a rearranged, GTP-bound heterotrimer (GαGTPGβγ) or by the dissociated components (GαGTP, Gβγ).
The published evidence in support of the distinct models of Gi/o activation is often contradictory. In vitro studies indicate that, similar to other heterotrimeric G proteins, the Gi/o proteins dissociate upon activation by the non-hydrolyzable GTP analog GTPγS (5, 8, 9). Furthermore, individual purified G protein subunits (including purified Gαi/o subunits) have been shown to interact with effectors associated with Gi/o signaling (5, 8). Thus, in vitro evidence suggests that Gi/o proteins dissociate upon activation into a free GαGTP subunit and a Gβγ dimer and that the dissociated subunits mediate downstream signaling (5, 10). In contrast, in vivo experiments performed in cell cultures have produced conflicting results. Observations of increases in FRET (11, 12) and bioluminescence resonance energy transfer (13) between modified G protein subunits upon G protein activation support heterotrimer rearrangement (rather than dissociation) upon activation. A decrease in FRET between G protein subunits labeled with fluorescent proteins (FPs) (14), internalization of Gβ1γ11 dimers (15), and an increase in lateral mobility of FP-labeled Gβγ dimers in the plasma membrane (16) upon Gi/o protein activation are consistent with heterotrimer dissociation upon activation. Because the in vitro results were obtained under conditions far from natural and the in vivo evidence is inconsistent and has mostly been obtained using G protein heterotrimers modified with two large protein tags (17), better evidence is needed to elucidate the process of Gi/o activation under natural conditions. Inspired by recent advances in imaging of G protein activation, we decided to investigate the molecular nature of the activated state of Gi/o proteins under conditions as close to natural as possible.
To detect interactions between Gα and Gβγ subunits, we employed the technique of two-photon polarization microscopy (2PPM), developed recently in our laboratory and described in detail in Ref. 18. The 2PPM technique allows measurements of two-photon linear dichroism (LD) (the differences in two-photon absorption of light of distinct (perpendicular) linear polarizations in fluorescently labeled samples). LD is present in all assemblies of non-randomly oriented fluorophores. We have shown recently that, using 2PPM, LD can be detected in ∼80% of FP-labeled membrane proteins expressed in mammalian cells, including several G proteins (18). Changes in LD can be used for sensitive observations of changes in protein-protein interactions and conformational changes in proteins. Our mathematical and software tools allow reliable quantification of LD and derivation of quantitative descriptions of molecular processes taking place in living cells (18). Because of the requirement of 2PPM for only a single FP label to observe protein-protein interactions, 2PPM is a promising tool for investigating processes such as G protein activation under conditions close to natural.
In 2PPM, two images of a fluorescent sample are acquired, one with excitation light polarized horizontally in the image and one with excitation light polarized vertically. Differences between the two images signify the presence of LD, caused by presence of fluorophores that are orientationally distributed non-randomly, for example because of their tethering to a cell membrane.
The extent of LD in membrane-tethered fluorophores depends on two factors: the orientation of the observed membrane with respect to the excitation light polarization and the orientation of the fluorophore assembly with respect to the cell membrane. No LD is present in membranes oriented diagonally in 2PPM images because the orientation of the membrane (and fluorophores) with respect to both excitation polarizations is identical. Maximum LD occurs in membranes oriented parallel and perpendicular to the used polarizations (vertically or horizontally in the image). Therefore, we measured LD in sections of cell outline that are oriented almost horizontally or vertically.
For a particular section of the cell outline, the extent and “sign” of LD depends on fluorophore orientation with respect to the membrane. The closer a fluorophore is to being parallel to the cell membrane, the larger the excess of fluorescence it will exhibit with light polarized parallel to the cell membrane. Conversely, the closer a fluorophore is to being perpendicular to the cell membrane, the larger the excess of fluorescence it will exhibit with light polarized perpendicular to the cell membrane. Fluorophores with a random distribution of orientations, or fluorophores at an angle of 52.0° (the so-called “magic angle” for two-photon excitation) with respect to the cell membrane will produce no LD.
The extent of LD can be described by a dichroic ratio (r): the ratio of fluorescence intensities excited by light polarized horizontally (Fh) and vertically (Fv), respectively, in the microscopy image. Because r depends on the orientation of the cell membrane, we characterize constructs by using a maximum dichroic ratio (rmax), calculated as Fh/Fv in sections of the cell outline oriented close to horizontal in the image and as the inverse ratio in sections of the cell outline oriented close to vertical in the image. This way, fluorophore distributions close to parallel to the cell membrane exhibit rmax > 1, and fluorophore distributions close to perpendicular to the cell membrane show rmax < 1. Wide distributions of fluorophore tilt angles and/or closeness of the mean fluorophore tilt angle to the magic angle show little or no LD (rmax = ∼1). In this work, we rely on observations of LD by the 2PPM technique to infer information on dissociation and rearrangement of G protein complexes.
To verify our 2PPM results, and to extend them to non-modified G proteins, we built on a published observation (19) that fluorescently labeled peptides derived from a G protein-coupled receptor kinase 3 (GRK3) selectively bind free Gβγ dimers and can, thus, serve as indicators of G protein dissociation. The binding site of the GRK3 C-terminal domain (GRK3ct) on Gβ1γ2 overlaps extensively with the binding site of Gα on Gβ1γ2 (17, 20, 21). Thus, binding of GRK3ct to Gβ1γ2 likely occurs only upon dissociation of the heterotrimeric G protein complex (2, 20). Interactions of GRK3ct with Gβ1γ2 have been observed by resonant energy transfer (FRET and bioluminescence resonance energy transfer) between suitable labels attached to both GRK3ct and Gβ1γ2. For Gαo, the GRK3ct -Gβ1γ2 interaction has also been observed by monitoring cellular localization of GRK3ct-Venus, allowing the use of non-labeled Gβ1γ2. Observations of GRK3ct-FP translocation, in combination with our imaging and image processing tools, promised to yield evidence of the mechanism of Gi/o protein activation not only in Gαi/o constructs labeled with an FP but also in non-modified Gαi/o subunits.
Our 2PPM and GRK3ct translocation results indicate that non-modified Gαi/o constructs extensively dissociate from Gβγ partners upon activation. In contrast, some of the FP-tagged Gαi/o constructs investigated remain in the form of a heterotrimer. Interestingly, our results show that even FP-tagged constructs that do not dissociate upon activation can activate downstream signaling pathways. Thus, at least in FP-modified constructs, Gαi/o dissociation is not required for downstream signaling. However, the extent of dissociation in non-modified Gi/o proteins indicates that the dissociated Gα and Gβγ subunits are the major activated form that mediates downstream signaling in a natural setting.
EXPERIMENTAL PROCEDURES
Constructs
Most constructs used in this study were gifts from Drs. M. Bünemann (Gαi1-L91-YFP, Gαi2-L91-YFP, Gαi3-L91-YFP, Gαo-L91-YFP, α2a adrenergic receptor (α2aAR), α2aAR-YFP, and α2aAR-CFP), A. Tinker (GAP43-CFP-Gαi1, GAP43-CFP-Gαi2, GAP43-CFP-Gαi3, and GAP43-CFP-Gαo), N. Lambert (GRK3ct-Venus), and V. Ruiz-Velasco (Gβ1, Gγ2, and Gβ1-YFP). All Gαi/o-FP constructs bore the C351I (or C352I) mutation, rendering them insensitive to pertussis toxin. Constitutively active (CA) mutants of Gαi/o-FP constructs and non-tagged Gαi1, Gαi3, and Gαo constructs (all bearing the C351I or C352I mutation) were created from the corresponding Gαi/o-FP constructs by PCR (Phusion polymerase, NEB) and verified by DNA sequencing (LGC Genomics, Germany). The plasmid encoding non-tagged Gαi2 (bearing a C351I mutation) was purchased from the Missouri S&T cDNA Resource Center. We prepared GRK3ct-Cerulean by PCR from masGRK3ct-Cerulean (a gift from N. Lambert) by removing the mas membrane tag and amino acids 488–547 of GRK3.
Cell Culture
HEK293 cells were cultured at 37 °C under an atmosphere of 95% air, 5% CO2 in Dulbecco's modified Eagle's medium with Glutamax I and high glucose (Life Technologies) supplemented with 10% fetal bovine serum. Cells were plated on 8-chamber microscopy slides (μ-Slides, Ibidi GmbH, Germany) or 6-chamber perfusion microscopy slides (μ-Slide VI Luer slides, Ibidi GmbH). Transfections were carried out using Lipofectamine 2000 (Life Technologies) according to the protocol of the manufacturer. In cotransfections, we used equimolar amounts of plasmids encoding Gαi/o, Gβ1, Gγ2, and α2aAR. The GRK3ct-encoding constructs were cotransfected at 0.8 equivalents. Microscopy experiments were carried out 48 h after transfection. In experiments involving GRK3ct constructs, we inhibited endogenous Gi/o signaling by treatment with 100 ng/ml of pertussis toxin for 16 h prior to microscopy observations. G protein activation experiments were performed in perfusion slides at room temperature under a continuous flow of peristaltically pumped (Minipuls 3, Gilson, UK), HEPES-buffered Hanks' balanced salt solution (pH 7.4). Norepinephrine ((±)-norepinephrine (+)-bitartrate salt (NE), Sigma) at a final concentration of 1 μm was applied for 30 s.
Fluorescence Microscopy
We conducted all microscopy experiments on a customized laser scanning microscope (iMic2, Till Photonics, Germany) equipped with a titanium:sapphire laser (Chameleon Ultra II with group velocity dispersion compensation, Coherent) using a UApoPlan/IR ×60 numerical aperture 1.2 water immersion objective lens (Olympus, Japan). A long-pass dichroic mirror and an emission filter (Q565LP, Chroma) and Brightline 479/40 (Semrock) for CFP and 740DCXR (Chroma) and Brightline 542/27 (Semrock) for YFP separated fluorescence from the excitation laser beam. Fluorescence was detected by a photomultiplier (R6357, Hamamatsu Photonics) equipped with an IR-blocking filter (HQ700SP-2P, Chroma). For each imaging experiment, we quantitatively analyzed at least 10 representative cells.
The method of 2PPM, including the experimental arrangement, is described in detail in Ref. 18. In 2PPM experiments, the direction of polarization of the excitation beam was alternated between horizontal and vertical by a polarization modulator (RPM-2P, Innovative Bioimaging) operated at 100 kHz and synchronized with acquisition of individual pixels by the microscope.
FRET measurements were performed on an iMic2 microscope equipped with a Polychrome IV light source (both Till Photonics) using an UApoPlan/IR ×60 numerical aperture 1.2 water immersion objective lens (Olympus). FRET was determined as a ratio of YFP to CFP emission (FYFP/FCFP) using 438 ± 12 nm of excitation. The CFP signal was recorded using a Brightline 438/24 excitation filter, Brightline 458 long-pass dichroic beam splitter, and Brightline 472/30 emission filter (all Semrock). The YFP signal was recorded with a Brightline 438/24 excitation filter for FRET images or a Brightline 479/40 for direct YFP excitation, a Brightline 509 long-pass dichroic beam splitter, and a Brightline 530/25 emission filter (all Semrock). Images were recorded sequentially with an ImagoQE camera (Till Photonics). The illumination time was set to 500 ms. CFP spillover into the FRET channel and YFP direct excitation upon 438 ± 12 nm of illumination were calculated and subtracted from the FRET signal to give the corrected FYFP/FCFP ratio. For each imaging experiment, we quantitatively analyzed at least 10 representative cells.
Image Processing and Analysis
To display the ratiometric information contained in 2PPM images, we processed the raw images in ImageJ and Polaris+ (Innovative Bioimaging) (Fig. 1). In short, each raw 2PPM image was deinterleaved into two images containing pixels obtained with horizontally and vertically polarized excitation, respectively. After background subtraction and adjustment for differences in laser beam intensity and pulse duration between the two polarizations, we applied a lookup table designed to express fluorescence intensity by brightness and values of the dichroic ratio by hue. On the color scale used, green indicates an excess of fluorescence excited by vertical polarization (Fv) and red an excess of fluorescence excited by horizontal polarization (Fh). Pure red or green color pixels indicate values of the dichroic ratio exceeding the maximum value set by the color scale.
FIGURE 1.
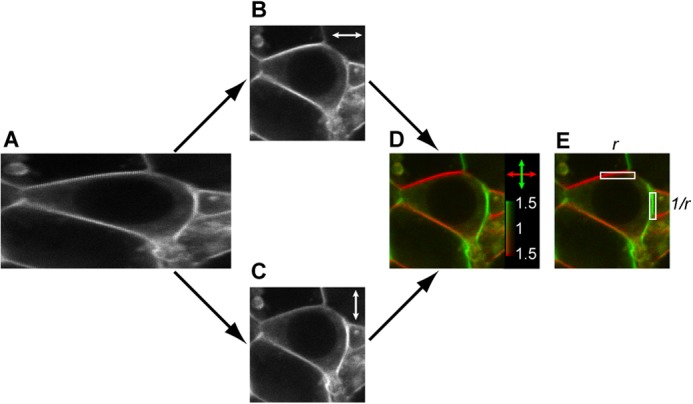
2PPM image processing illustrated on an example of a cell expressing the GAP43-CFP-Gαi2, Gβ1, and Gγ2 constructs. A, raw 2PPM image containing pixels obtained with both excitation light polarizations. B and C, images of fluorescence elicited with horizontally (B) and vertically (C) polarized excitation light, respectively (double-headed arrows), obtained by deinterleaving image A. D, linear dichroism image, obtained from images B and C, after adjustments for differences in laser beam intensity and pulse duration between the two polarizations and application of a lookup table designed to express fluorescence intensity by brightness and values of the dichroic ratio (r) by hue. The color scale indicates an excess of fluorescence excited by vertical polarization (Fv) in green and an excess of fluorescence excited by horizontal polarization (Fh) in red. E, pixels from horizontal and vertical parts of the cell outline are used for calculation of the maximum dichroic ratio. The maximum dichroic ratio rmax (and log2(rmax)) is obtained by calculating the mean values of r (and log2(r)) from horizontal and 1/r (and log2(1/r)) from vertical parts of the cell outline.
Quantitative analysis of 2PPM images was carried out as described in Ref. 18 using Matlab scripts developed in-house. Briefly, we calculated the dichroic ratio (r = Fh/Fv) and log ratio (log2(r)) for each pixel corresponding to the cell outline. We then associated the values of r (and log2(r)) with information on cell membrane orientation (angle θ). We determined the values of rmax (and log2(rmax)), characteristic of the construct being investigated, by calculating the mean of values of r (and log2(r)) for parts of the cell outline close to horizontal (θ - π/2 < 3°) and 1/r (and log2(1/r)) for parts of the cell outline close to vertical (θ < 3°). Thus, values of rmax > 1 (and log2(rmax) > 0) indicate that α0, the mean fluorophore angle with respect to the membrane normal, is larger than the two-photon magic angle (α0 > 52.0°).
To visualize and quantitate GRK3ct-FP translocation and localization (Figs. 5 and 7), we performed a background subtraction (using an image area outside of a cell), a correction for bleaching, and image thresholding in ImageJ. For visualization, we applied a lookup table designed to express values of fluorescence intensity ratios by hue. We quantitated GRK3ct-FP translocation (Fig. 5, D–G) by manually selecting a cytoplasmic region of a cell and taking a ratio of fluorescence intensities before and during stimulation of the cell with NE. The procedure of quantitating GRK3ct-FP membrane localization (Fig. 7) consisted of selecting the whole cell area by thresholding, measuring the fluorescence intensity (Fmembrane) in a manually selected, 250-nm-wide cell outline, and comparing it to the fluorescence intensity in the cytoplasm (Fcytoplasm). To account for low fluorescence intensities at the outer edge of the cell outline, the Fmembrane/Fcytoplasm ratios were normalized by those obtained in cells overexpressing only GRK3ct-Venus.
FIGURE 5.

Investigating interactions between G protein subunits by imaging GRK3ct-FP translocation. A, structures of Gαi1 (PDB code 1GP2 (33)), the C-terminal part of GRK2 (GRK2ct, PDB code 1OMW (20)), and Gβ1γ2 (PDB code 1OMW (20)). The sites of interactions of Gβ1γ2 with Gαi1 only are colored yellow (34), with GRK2ct only shown blue, and with both Gαi1 and GRK2ct shown in green (20). A major overlap between the Gβ1γ2 surfaces interacting with Gαi1 and GRK2ct is apparent. B, two-photon microscopy images of yellow fluorescence of a typical cell transfected with the GAP43-CFP-Gαo, Gβ1, Gγ2, α2AR, and GRK3ct-Venus constructs imaged before and after application of 1 μm NE and a ratio image of the two images color-coded to express the fluorescence intensity ratio by hue. Translocation of GRK3ct-Venus, evidenced by a fluorescence intensity decrease in the cytoplasm accompanied by an increase in the cell membrane regions, is apparent. Scale bars = 5 μm. C, 2PPM images of GRK3ct-Venus before and after application of 1 μm NE (data acquired simultaneously with the images in B). Coloring is as in Fig. 1. Upon activation, the appearance of LD can be discerned, indicative of membrane localization of the GRK3ct-Venus construct. D–G, graphs of GRK3ct-FP translocation, indicated by a decrease of cytoplasmic GRK3ct-FP fluorescence (in percent) upon G protein activation for constructs of the GAP43-CFP-Gαi/o (white bars) and Gαi/o-L91-YFP (gray bars) designs and for non-modified Gαi/o constructs (black bars). Error bars represent the mean + S.E.). Activation of all GAP43-CFP-Gαi/o, Gαo-L91-YFP, and non-modified Gαi/o constructs leads to GRK3ct-FP translocation. In contrast, no GRK3ct-FP translocation can be detected in cells expressing Gαi-L91-YFP constructs.
FIGURE 7.

Extent of GRK3ct-Venus translocation upon G protein activation. The graphs show the ratios of GRK3ct-Venus fluorescence intensities in the cell membrane and the cytoplasm in cells transfected with GRK3ct-Venus alone; cotransfected with Gβ1 and Gγ2 subunits; and cotransfected with Gαi/o, Gβ1, and Gγ2 with or without α2aAR, inactive and activated by addition of 1 μm NE. Error bars represent mean + S.E.
Quantitative results of both 2PPM and translocation imaging experiments were expressed as mean ± S.E. Statistical significance was evaluated using Student's t test. The normality of the data was tested and confirmed by D'Agostino and Pearson omnibus K2 normality test.
Electrophysiology
Membrane current recordings were performed by conventional whole cell patch clamp technique (22) using an EPC10 USB amplifier (HEKA Elektronik Dr. Schulze GmbH, Germany). Patch pipettes were pulled from borosilicate glass capillaries (GC150T-10, Harvard Apparatus) using a vertical puller (PC-10, Narishige, Japan) and had a resistance of 2–6 MΩ when filled with the pipette solution. Data were acquired and analyzed using Patchmaster software (HEKA Elektronik Dr. Schulze GmbH). IGIRK was measured as an inward current using a holding potential of −90 mV. The internal (pipette) solution composition was 100 mm potassium aspartate, 40 mm KCl, 5 mm MgATP, 10 mm HEPES, 5 mm NaCl, 2 mm EGTA, and 1 mm MgCl2 (pH 7.3). The external solution composition was 120 mm NaCl, 20 mm KCl, 2 mm CaCl2, 1 mm MgCl2, and 10 mm HEPES (pH 7.3). The results were presented as mean ± S.E. Statistical significance was evaluated using Student's t test. The normality of the data were tested and confirmed by D'Agostino and Pearson omnibus K2 normality test.
RESULTS
We investigated, both by 2PPM and GRK3ct-FP translocation, fluorescently labeled Gαi/o subunits (Gαi/o-FP) of two published designs: GAP43-CFP-Gα (23) and Gα-L91-YFP (11, 12). In the GAP43-CFP-Gα constructs, the N terminus of the native Gα, including a lipidation motif, is replaced by a GAP43 lipidation motif and a cyan fluorescent protein (Fig. 2, A and B, and supplemental Fig. 1). In the Gα-L91-YFP constructs, a yellow fluorescent protein is inserted into the αa-αb loop after the Leu-91 residue (Fig. 2, C and D, and supplemental Fig. 1). Both groups of constructs carry a C351I or C352I mutation, rendering them insensitive to pertussis toxin and allowing their selective activation in the presence of endogenously expressed Gα subunits. Both construct designs have been shown previously to be functional, judged by their ability to inhibit cAMP production and activate GIRK channels (11, 23). Published data on FRET between FP-labeled Gαi/o-L91-YFP and CFP-labeled Gγ2 or Gβ1 subunits (11, 12) have suggested that Gαi-L91-YFP containing heterotrimers did not dissociate during activation, whereas the Gαo-L91-YFP complex dissociated.
FIGURE 2.

Imaging interactions between G protein subunits by 2PPM. A, 2PPM imaging of cells overexpressing Gαi/o-FP constructs of the GAP43-CFP-Gαi/o design. A schematic of the GAP43-CFP-Gαi/o construct design with high conformational flexibility expected (double-headed arrow). Also shown are 2PPM images of HEK293 cells transfected with individual GAP43-CFP-Gαi/o constructs. Scale bars = 5 μm. Fluorescence elicited by horizontal and vertical excitation beam polarizations is colored red and green, respectively (double-headed arrows), with the color bar indicating the dichroic ratio r. The absence of red or green color in the images indicates the absence of LD. B, same as A, but for GAP43-CFP-Gαi/o constructs coexpressed with Gβ1 and Gγ2 subunits. LD (a red/green pattern) is apparent in the outlines of cells expressing all four GAP43-CFP-Gαi/o constructs. C, same as A, but for Gαi/o-L91-YFP constructs. LD is present in cells expressing the Gαi1-L91-YFP and Gαi3-L91-YFP constructs but not the Gαi2-L91-YFP or Gαo-L91-YFP constructs. D, same as C, but the Gαi/o-L91-YFP constructs were coexpressed with Gβ1 and Gγ2 subunits. LD is present in cells expressing all but the Gαi2-L91-YFP construct. Interestingly, the distribution of fluorescence intensities (localization of red/green parts of the cell outline) indicates that although the YFP fluorophore in the Gαi1-L91-YFP and Gαi3-L91-YFP constructs is oriented close to perpendicular to the cell membrane, in the Gαo-L91-YFP construct it is close to being parallel to the cell membrane. In Gαi2-L91-YFP, the fluorophore is either in a disordered orientation or close to the magic angle, 52.0 degrees, to the cell membrane.
Two-photon Polarization Microscopy Allows Observation of the Interactions between Heterotrimeric G Protein Subunits
To investigate whether 2PPM allows observation of the interactions between FP-tagged Gαi/o subunits and Gβ1γ2 dimers, we carried out 2PPM observations of HEK293 cells transfected with Gαi/o-FP constructs both alone and in combination with Gβ1 and Gγ2 subunits. The results of our 2PPM observations are illustrated in Fig. 2 and summarized in Fig. 3. Briefly, none of the four investigated GAP43-CFP-Gα constructs showed LD when expressed alone (Fig. 2A). In contrast, when coexpressed with Gβ1 and Gγ2, all investigated GAP43-CFP-Gα constructs exhibited pronounced LD (Figs. 2B and 3, A–D). The results of 2PPM observations of Gα constructs of the Gα-L91-YFP design were less uniform and revealed unexpected structural differences between the investigated constructs despite their identical design and high DNA and amino acid sequence similarity (repeatedly verified by DNA sequencing). When expressed alone, the Gαi2-L91-YFP construct showed no LD, whereas the Gαi1-L91-YFP, Gαi3-L91-YFP, and Gαo-L91-YFP constructs of the same design exhibited significant LD (Fig. 2C). When coexpressed with Gβ1 and Gγ2, the Gαi2-L91-YFP construct again showed no LD, whereas the Gαi1-L91-YFP, Gαi3-L91-YFP, and Gαo-L91-YFP constructs exhibited more pronounced LD than when expressed alone (Figs. 2D and 3, E–H). Thus, with the exception of Gαi2-L91-YFP, 2PPM can be used to observe interactions between the studied FP-labeled Gαi/o subunits and the Gβ1γ2 complex.
FIGURE 3.

Results of 2PPM imaging of Gαi/o-FP constructs. Shown is a summary of data from 2PPM experiments on Gαi/o-FP constructs of the GAP43-CFP-Gαi/o (A–D) and Gαi/o-L91-YFP (E–H) designs. The graphs show log2(rmax) and rmax of the Gαi/o-FP constructs transfected alone (white bars); cotransfected with Gβ1 and Gγ2 subunits (light gray bars); cotransfected with Gβ1, Gγ2, and α2AR-FP constructs and activated by addition of 1 μm NE (medium gray bars), constitutively active mutants of Gαi/o-FP constructs transfected alone (dark gray bars), and cotransfected with Gβ1 and Gγ2 subunits (black bars). Error bars represent mean + S.E.
Activation of G Proteins Leads to a Variety of LD Responses in Gαi/o-FP Constructs
To determine whether activated Gαi/o-FP subunits interact with Gβ1γ2 dimers, we carried out 2PPM imaging of G protein activation in cells transfected with a Gαi/o-FP, Gβ1, Gγ2, and an α2aAR-FP. The presence of α2aAR-FP did not affect the LD of Gαi/o-FP constructs, either in presence or absence of Gβ1 and Gγ2. In all constructs of the GAP43-CFP-Gαi/o design, application of NE caused a robust decrease but not a complete disappearance of LD in the CFP moiety of the Gαi/o constructs (Fig. 3, A–D). In all four GAP43-CFP-Gαi/o constructs, the LD remaining after receptor activation was considerably higher than in the respective subunits expressed alone. Thus, upon activation, the GAP43-CFP-Gαi/o subunits appear to enter a state distinct both from the non-activated heterotrimer and from the fully dissociated Gα subunit. Our 2PPM results cannot reveal the identity of this activated state, which may consist of rearranged heterotrimeric G proteins, partially dissociated heterotrimers (the 2PPM data being consistent with ∼70% dissociation), or Gα monomers in a conformation distinct from that of non-activated single Gα subunits.
Unlike the GAP43-CFP-Gαi/o constructs, the constructs of the Gαi/o-L91-YFP design exhibited a variety of responses upon receptor activation (Fig. 3, E–H). Modest decreases of LD upon activation could be discerned in Gαi1-L91-YFP and Gαi3-L91-YFP. The Gαi2-L91-YFP construct did not show a statistically significant change in LD upon activation. Activation of the Gαo-L91-YFP-containing complex caused a decrease in LD to levels indistinguishable from those observed in the Gαo-L91-YFP subunit expressed alone. These LD measurements confirm a structural heterogeneity among the studied Gαi/o-L91-YFP constructs that is not caused by sequence irregularities. Structural heterogeneity among the Gαi/o-L91-YFP constructs is also reflected in the extent of basal FRET between the Gαi/o-L91-YFP and Gβ1-CFP subunits (Fig. 4). The observed structural heterogeneity within the Gαi/o-L91-YFP group of constructs is suggestive of functional heterogeneity.
FIGURE 4.

Results of FRET imaging with Gαi/o-L91-YFP constructs. Bars show the FYFP/FCFP ratio of the Gαi1-L91-YFP (white bar), Gαi2-L91-YFP (light gray bar), Gαi3-L91-YFP (medium gray bar), and Gαo-L91-YFP (black bar) constructs cotransfected with Gβ1-N-CFP and Gγ2. Error bars represent mean + S.E.
Our results indicate that there are important differences among the studied constructs, both between and within the two groups of constructs. The differences may involve not only structure but also function of the constructs. In the absence of a clear pattern, no conclusion regarding subunit rearrangement or dissociation upon activation can be drawn from these experiments alone.
Some Constitutively Active Mutants of the Gαi/o-FP Constructs Interact with Gβ1γ2
To ascertain the ability of activated Gαi/o subunits to interact with Gβγ dimers, we created mutants of all tested Gαi/o-FP constructs bearing a Gln-to-Leu mutation in the third switch region (Q204L in Gαi1, Gαi3; Q205L in Gαi2, Gαo). This mutation has been shown (24) to abolish the GTPase activity of Gα subunits, rendering the mutants constitutively active. We observed the mutated Gα subunits by 2PPM both in the presence and absence of overexpressed Gβ1 and Gγ2 subunits. The results are summarized in Fig. 3.
All CA mutants of the GAP43-CFP-Gαi/o constructs (Fig. 3, A–D) showed only minute values of LD when expressed alone. The LD of two of these mutants, GAP43-CFP-Gαi1(Q204L) and GAP43-CFP-Gαo(Q205L), was not affected by coexpression of Gβ1, Gγ2. However, the other two GAP43-CFP-Gαi/o CA mutants, GAP43-CFP-Gαi2(Q205L) and GAP43-CFP-Gαi3(Q204L), did show a slightly higher LD when coexpressed with Gβ1, Gγ2 (p < 0.01; n = 14 and 21 cells, respectively).
Among the CA Gαi/o-L91-YFP mutants, Gαi2(Q205L)-L91-YFP and Gαo(Q205L)-L91-YFP showed a minute LD both when expressed alone and coexpressed with Gβ1 and Gγ2 (Fig. 3, F and H). In contrast, the Gαi1(Q204L)-L91-YFP and Gαi3(Q204L)-L91-YFP constructs showed considerably higher LD when coexpressed with Gβ1 and Gγ2 subunits than when expressed alone (Fig. 3, E and G) (p < 0.001, n ≥ 13 cells for each tested combination of constructs).
Thus, our 2PPM observations indicate that two of the CA mutants of the GAP43-CFP-Gα design (Gαi2 and Gαi3) can interact (albeit likely only weakly) with Gβ1γ2. Two of the CA mutants of the Gαi-L91-YFP design (Gαi1 and Gαi3) showed signs of strong interaction with Gβ1γ2. The other four CA mutants did not show signs of this interaction. Similar to the diverse results obtained with the non-mutated Gαi/o-FP constructs, the results with the CA mutants reveal structural and functional differences among the investigated constructs, even within a particular design.
GAP43-CFP-Gαi/o and Gαo-L91-YFP Complexes Dissociate during Activation, whereas Gαi-L91-YFP Complexes Do Not
To verify and extend our 2PPM results, we observed cellular localization of GRK3ct-FP (Fig. 5A), known to interact with Gβ1γ2. The results of our GRK3ct-FP observations in cells transfected with a Gαi/o-FP, Gβ1, Gγ2, α2aAR, and GRK3ct-FP are summarized in Fig. 5.
Prior to activation of the α2aAR receptor, GRK3ct-FP showed cytoplasmic localization in all experiments. The LD of each Gαi/o-FP construct was indistinguishable from its LD when coexpressed with only Gβ1 and Gγ2. Upon receptor activation by NE, GRK3ct-Venus translocated to the cell membrane in experiments involving each of the four Gαi/o-FP constructs of the GAP43-CFP-Gαi/o design (Fig. 5, B and D–G). This translocation was accompanied by the appearance of a small but discernible LD in GRK3ct-Venus (Fig. 5C) and also by changes of LD in the GAP43-CFP-Gαi/o constructs, consistent with activation of the G protein complex. In contrast, no GRK3ct-Cerulean translocation could be observed in experiments involving Gαi-L91-YFP constructs (Fig. 5, D–G), although, at least in Gαi1-L91-YFP, activation of the G protein construct was evidenced by changes in its LD. Activation of the Gαo-L91-YFP complex led to GRK3ct-Cerulean translocation, albeit weaker than in the GAP43-CFP-Gαi/o constructs. These results suggest that constructs of the GAP43-CFP-Gαi/o design dissociate upon activation. Among the Gαi/o-L91-YFP constructs, only Gαo-L91-YFP dissociates upon activation.
To assess the effects of the GRK3ct-FP presence on G protein dissociation, we investigated whether coexpression of a GRK3ct-FP probe affects the LD of Gαi1-FP both in an inactive and activated state. If GRK3ct significantly shifted the equilibrium between dissociated and non-dissociated G protein subunits, the effect should be reflected in the LD of the Gα-FP construct. However, we have not been able to observe such an effect (Fig. 6), which suggests that results obtained by using a GRK3ct-FP probe accurately reflect the extent of G protein dissociation that is present even in the absence of this probe.
FIGURE 6.
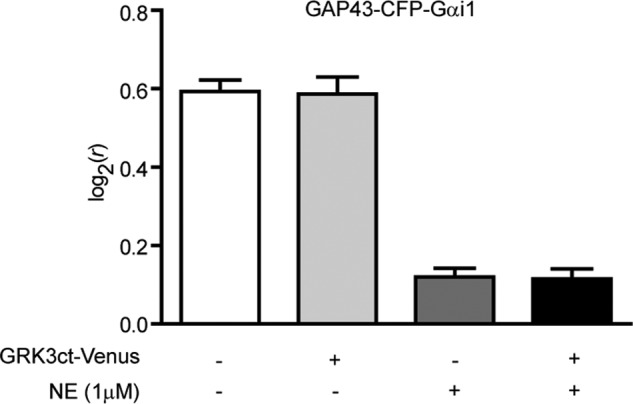
LD of the fluorescently labeled Gαi1 subunit (GAP43-CFP-Gαi1) in the resting and activated state in the absence and presence of GRK3ct-Venus. Shown is a bar graph showing the LD of GAP43-CFP-Gαi1 cotransfected with Gβ1, Gγ2, and α2a AR with or without GRK3ct-Venus before and during activation with NE (1 μm) in pertussis toxin-treated HEK293 cells. The expression of GRK3ct-Venus does not significantly affect the LD of GAP43-CFP-Gαi1 either in the inactive or activated state.
Complexes of Non-modified Gi/o Proteins Dissociate upon Activation
To ascertain whether complexes of non-modified Gi/o proteins dissociate upon activation, we observed intracellular localization of GRK3ct-Venus in cells transfected with Gαi/o, Gβ1, Gγ2, α2aAR, and GRK3ct-Venus. Prior to activation, GRK3ct-Venus appeared cytoplasmic in experiments involving each of the four investigated non-labeled Gαi/o proteins. Upon treatment with NE, GRK3ct-Venus uniformly translocated to the cell membrane to an extent comparable with that observed in experiments on constructs of the GAP43-CFP-Gαi/o design (Fig. 5, D–G). These results indicate that, in living cells, upon activation, all four investigated non-modified Gαi/o subunits dissociate from Gβ1γ2.
To obtain information on the extent of Gi/o complex dissociation upon activation, we compared the intracellular localization of GRK3ct-Venus in cells overexpressing GRK3ct-Venus, Gβ1, Gγ2, but not Gαi/o or a receptor, with cells overexpressing GRK3ct-Venus, Gβ1, Gγ2, a Gαi/o, and α2aAR, activated by addition of norepinephrine (Fig. 7 and supplemental Fig. 1). In the former cells, virtually all overexpressed Gβ1γ2 should be available for binding by GRK3ct-Venus. Thus, this experiment provides information on GRK3ct-Venus localization when virtually all present Gβ1γ2 are Gα-free and allows calibration of our GRK3ct results. In the latter cells, upon NE application, the extent of GRK3ct-Venus membrane localization reached 70–75% of that observed in the calibration experiment. Therefore, we estimate that, upon activation, 70–75% of non-modified, overexpressed Gi/o complexes dissociate.
Because the process of GTP hydrolysis is considerably slower than Gi/o dissociation (25), we can consider the Gi/o heterotrimers and the dissociated subunits to be in a simple two-state equilibrium described by an equilibrium dissociation constant. This approximation then allows extrapolation of our results obtained with overexpressed Gi/o proteins to Gi/o proteins present at endogenous concentrations (about four times lower than concentrations of overexpressed Gi/o subunits (supplemental Fig. 2)). Our calculations (see supplemental data) indicate that, when present at endogenous concentrations, 85–90% of Gi/o molecules dissociate upon activation.
Dissociation of G Protein Heterotrimers Is Not Required for Activation of Downstream Effectors
To determine how dissociation of G protein heterotrimers relates to their functional activity, we investigated the ability of constitutively active Gα-FP constructs to regulate the activity of GIRK channels (Fig. 8). We transfected HEK293 cells with either the GAP43-CFP-Gαi1(Q204L) or Gαi1(Q204L)-L91-YFP construct, along with constructs GIRK1-C-CFP and GIRK4 (together encoding a functional GIRK channel), either with or without the Gβ1 (or Gβ1-YFP) and Gγ2 constructs. Our results show that the presence of neither the constitutively active Gαi1 subunit (GAP43-CFP-Gαi1(Q204L) or Gαi1(Q204L)-L91-YFP) affected the GIRK channel activity induced by the presence of endogenous free Gβγ dimers or overexpressed Gβ1, Gγ2 subunits. In contrast, the presence of non-activated Gαi1 subunits (GAP43-CFP-Gαi1 or Gαi1-L91-YFP) greatly reduced GIRK1/4 channel activity, presumably by sequestering free Gβγ dimers. Activation by 1 μm NE led to a pronounced increase of GIRK activity in both types of Gαi1-FP constructs. The observed GIRK channel activation by Gαi1-L91-YFP constructs is not likely to be due to a small fraction of dissociated Gαi1 complexes because GIRK activation is a stoichiometric process (26), and a small fraction of dissociated Gαi complexes would only activate a small fraction of GIRK channels. Because our 2PPM and GRK3ct translocation data show that the Gαi1(Q204L)-L91-YFP and activated Gαi1-L91-YFP constructs interact with Gβγ dimers, we postulate the existence, at least in the Gαi-L91-YFP line of constructs, of Gα-Gβγ interactions that do not affect downstream signaling events. Only limited Gα-Gβγ interactions are, however, present in other constitutively active FP-labeled Gαi/o constructs as well as in agonist-activated, non-modified Gαi/o constructs. Therefore, we conclude that, although heterotrimer dissociation is not strictly required for downstream signaling, dissociation is the likely physiological mechanism of Gαi/o activation.
FIGURE 8.

Regulation of GIRK1/4 channel activity by Gα-FP constructs and their constitutively active mutants. The graphs show the effects of overexpression of FP-tagged Gαi1 constructs on GIRK1/4 channel current in HEK293 cells in the absence and presence of overexpressed Gβ1γ2 dimers. A, GAP43-CFP-Gαi1. B, Gαi1-L91-YFP. The graphs show current normalized by cell surface area (characterized by capacitance) (picoamperes/picofarad (pA/pF)) in non-transfected cells (white bars); cells transfected with GIRK1-C-CFP and GIRK4 constructs (light gray bars); GIRK1-C-CFP, GIRK4, and Gαi1-FP (medium gray bars); GIRK1-C-CFP, GIRK4, Gβ1 (or Gβ1-YFP), and Gγ2 (black bars); GIRK1-C-CFP, GIRK4, Gαi1-FP, Gβ1 (or Gβ1-YFP), and Gγ2 (horizontally hatched bars); GIRK1-C-CFP, GIRK4, Gαi1-FP, Gβ1 (or Gβ1-YFP), Gγ2, and α2aAR stimulated by 1 μm NE (diagonally hatched bars); GIRK1-C-CFP, GIRK4, a constitutively active Gαi1-FP mutant (GAP43-CFP-Gαi1(Q204L), or Gαi1(Q204L)-YFP) (vertically hatched bars); and GIRK1-C-CFP, GIRK4, a constitutively active Gαi1-FP mutant, Gβ1 (or Gβ1-YFP), and Gγ2 (crossed diagonally hatched bars) constructs. Error bars represent mean − S.E.
DISCUSSION
The question of whether Gi/o proteins dissociate into a free Gα subunit and a Gβγ dimer upon activation has been widely disputed (2, 5–16, 19, 27–29). Results of in vitro studies have largely supported dissociation of activated Gi/o protein heterotrimers (8, 9, 28, 29), whereas results of cell culture experiments have been mixed, with several studies (11–13) yielding evidence for Gi/o complex rearrangement rather than dissociation. We tried to investigate the process of Gi/o protein activation in conditions as close to natural as possible by observing G protein heterotrimers labeled with only a single FP and with no label at all.
In constructs of the GAP43-CFP-Gαi/o design, both 2PPM experiments and GRK3ct-YFP translocation observations suggest that the Gi/o heterotrimers, to a large extent, dissociate upon activation. 2PPM experiments show a marked decrease, but not disappearance, of LD upon activation and reveal some (likely limited) interactions between CA mutants of the Gαi/o subunits and the Gβ1γ2 dimers. Investigations of GRK3ct-YFP intracellular localization showed pronounced translocation upon GAP43-CFP-Gαi/o activation. The simplest explanation for these observations involves a substantial (∼70%) dissociation of the overexpressed GAP43-CFP-Gαi/o heterotrimers upon activation.
Experiments with constructs of the Gαi/o-L91-YFP design revealed heterogeneity in structure and molecular interactions. In Gαi1-L91-YFP and Gαi3-L91-YFP, little decrease of LD occurs upon activation, and a strong interaction exists between their CA mutants and the Gβ1γ2 dimers (Fig. 3, E and G). Furthermore, no GRK3ct-CFP translocation can be observed upon activation of Gαi1-L91-YFP and Gαi3-L91-YFP. These results indicate no or only minor (< 10%) heterotrimer dissociation upon activation. This conclusion is also valid for the Gαi2-L91-YFP construct, in which, however, 2PPM shows structural characteristics substantially different from both Gαi1-L91-YFP and Gαi3-L91-YFP. Surprisingly, the results of both 2PPM and GRK3ct-CFP translocation experiments obtained with the Gαo-L91-YFP construct are consistent with extensive (albeit lower than in the GAP43-CFP-Gαo construct) heterotrimer dissociation upon activation. Our observations of structural heterogeneity among constructs of the Gαi/o-L91-YFP design add to the more subtle heterogeneity of results of published (12) and our own FRET experiments (Fig. 4). Published experiments with Gαi/o-L91-YFP constructs (7, 11, 12) have largely supported rearrangement rather than dissociation upon G protein activation. Our results cast doubts over the relevance of results obtained with the Gαi/o-L91-YFP constructs to non-modified Gαi/o proteins.
Experiments on non-labeled Gi/o proteins (using GRK3ct-FP translocation as a proxy for Gi/o heterotrimer dissociation) show that all tested overexpressed Gi/o proteins dissociate upon activation to an extent of ∼70–75%. Extrapolation to Gi/o proteins present at endogenous concentrations suggests that 85–90% of Gi/o complexes dissociate upon activation. No statistically significant shift of the equilibrium between G protein heterotrimers and dissociated subunits in the active state because of coexpression of GRK3ct-FP construct could be detected and is, therefore, likely to be negligible. The extent of Gi/o heterotrimer dissociation is consistent with the dissociated subunits being the activated Gi/o form that mediates signal transduction to downstream effectors (Fig. 9).
FIGURE 9.

A model of Gi/o signaling on the basis of our results. Upon activation, 85–90% of Gi/o heterotrimers dissociate. A GTP-bound heterotrimer complex (GαGTPGβγ) is likely to exist but rapidly and extensively dissociates into GαGTP and Gβγ. The dissociated subunits, being the major components of the activated system, mediate the majority of interactions with downstream effectors. Downstream effectors may shift the G protein equilibrium toward dissociated subunits.
What is the functional significance of Gi/o protein dissociation upon activation? To find out, we tested the ability of the GAP43-CFP-Gαi1 and Gαi1-L91-YFP constructs and their constitutively active mutants to regulate activity of GIRK channels. Surprisingly, neither the constitutively active GAP43-CFP-Gαi1(Q204L) nor the Gαi1(Q204L)-L91-YFP construct reduce the activity of the GIRK1/4 channel (Fig. 8), although the Gαi1(Q204L)-L91-YFP construct does bind Gβγ dimers (Fig. 3). This finding indicates that efficient downstream signaling is possible even by a G protein heterotrimer, albeit by one modified by an FP insertion. However, because our results indicate that non-modified Gαi/o subunits largely dissociate upon activation and support published results showing that free Gβγ dimers activate GIRK channels, we postulate Gαi/o heterotrimer dissociation to be the major physiological mechanism of Gαi/o signal transduction to downstream effectors. It is, however, possible, perhaps even likely, that, to some extent, GIRK activation involves interactions between an activated Gαi/o heterotrimer and the GIRK channel, possibly affecting the signaling kinetics (30, 31).
In conclusion, our results explain published contradictory results obtained with constructs of different designs, bring in line in vitro and in vivo evidence, and appear to settle the issue of G protein dissociation within the Gi/o family. Our findings also open up the possibility that other heterotrimeric G proteins thought to undergo rearrangement, such as Gs (13, 16) and Gq (32), dissociate upon activation. Apart from providing new information on the mechanisms of Gi/o signaling, our results also illustrate the uses and capabilities of 2PPM, a novel microscopy technique that allows observations of protein-protein interactions using a single fluorescent label.
Acknowledgments
We thank Drs. M. Bünemann, A. Tinker, N. Lambert, E. Reuveny, and V. Ruiz-Velasco for constructs; Dr. L. Jin for assistance with electrophysiology; K. Tosnerova for technical assistance; S. Timr for assistance with data analysis; and A. Kevorkova for help with Western blotting.
This work was supported by European Commission FP7 Marie Curie International Reintegration Grant PIRG-GA-2007-209789 “MemSensors” (to J. L.), by Czech Government Institutional Grant AVOZ60870520 (to J. L.), by Grant P205/13-10799S (to J. L.), by University of South Bohemia Grant Agency Grant 141/2013/P (to A. B.), and by a University of South Bohemia fellowship (to A. B.). Patent 302233, covering the method of 2PPM, device and applications, has been awarded by the Industrial Property Office of the Czech Republic (to J. L.). A Patent Cooperation Treaty (PCT) application has been filed (by J. L.). J. L. is a founder and owner of Innovative Bioimaging, LLC.

This article contains supplemental Figs. 1 and 2 and Methods.
- GIRK
- G protein-regulated inward rectifying potassium channel
- GTPγS
- guanosine 5′-3-O-(thio)triphosphate
- FP
- fluorescent protein
- 2PPM
- two-photon polarization microscopy
- LD
- linear dichroism
- CA
- constitutively active
- NE
- (±)-norepinephrine (+)-bitartrate salt
- CFP
- cyan fluorescent protein
- α2aAR
- α2a-adrenergic receptor
- GRK3ct
- G protein-coupled receptor kinase 3 C-terminal domain.
REFERENCES
- 1. Vilardaga J. P., Bünemann M., Feinstein T. N., Lambert N., Nikolaev V. O., Engelhardt S., Lohse M. J., Hoffmann C. (2009) GPCR and G proteins. Drug efficacy and activation in live cells. Mol. Endocrinol. 23, 590–599 [DOI] [PMC free article] [PubMed] [Google Scholar]
- 2. Lambert N. A. (2008) Dissociation of heterotrimeric g proteins in cells. Sci. Signal. 1, re5. [DOI] [PubMed] [Google Scholar]
- 3. Oldham W. M., Hamm H. E. (2008) Heterotrimeric G protein activation by G-protein-coupled receptors. Nat. Rev. Mol. Cell Biol. 9, 60–71 [DOI] [PubMed] [Google Scholar]
- 4. Yuan C., Sato M., Lanier S. M., Smrcka A. V. (2007) Signaling by a non-dissociated complex of G protein βγ and α subunits stimulated by a receptor-independent activator of G protein signaling, AGS8. J. Biol. Chem. 282, 19938–19947 [DOI] [PubMed] [Google Scholar]
- 5. Gilman A. G. (1987) G proteins. Transducers of receptor-generated signals. Annu. Rev. Biochem. 56, 615–649 [DOI] [PubMed] [Google Scholar]
- 6. Levitzki A. (1988) From epinephrine to cyclic AMP. Science 241, 800–806 [DOI] [PubMed] [Google Scholar]
- 7. Hommers L. G., Klenk C., Dees C., Bünemann M. (2010) G proteins in reverse mode. Receptor-mediated GTP release inhibits G protein and effector function. J. Biol. Chem. 285, 8227–8233 [DOI] [PMC free article] [PubMed] [Google Scholar]
- 8. Katada T., Northup J. K., Bokoch G. M., Ui M., Gilman A. G. (1984) The inhibitory guanine nucleotide-binding regulatory component of adenylate cyclase. Subunit dissociation and guanine nucleotide-dependent hormonal inhibition. J. Biol. Chem. 259, 3578–3585 [PubMed] [Google Scholar]
- 9. Higashijima T., Ferguson K. M., Smigel M. D., Gilman A. G. (1987) The effect of GTP and Mg2+ on the GTPase activity and the fluorescent properties of Go. J. Biol. Chem. 262, 757–761 [PubMed] [Google Scholar]
- 10. Levitzki A., Klein S. (2002) G-protein subunit dissociation is not an integral part of G-protein action. ChemBioChem 3, 815–818 [DOI] [PubMed] [Google Scholar]
- 11. Bünemann M., Frank M., Lohse M. J. (2003) Gi protein activation in intact cells involves subunit rearrangement rather than dissociation. Proc. Natl. Acad. Sci. U.S.A. 100, 16077–16082 [DOI] [PMC free article] [PubMed] [Google Scholar]
- 12. Frank M., Thümer L., Lohse M. J., Bünemann M. (2005) G Protein activation without subunit dissociation depends on a Gα(i)-specific region. J. Biol. Chem. 280, 24584–24590 [DOI] [PubMed] [Google Scholar]
- 13. Galés C., Van Durm J. J., Schaak S., Pontier S., Percherancier Y., Audet M., Paris H., Bouvier M. (2006) Probing the activation-promoted structural rearrangements in preassembled receptor-G protein complexes. Nat. Struct. Mol. Biol. 13, 778–786 [DOI] [PubMed] [Google Scholar]
- 14. Gibson S. K., Gilman A. G. (2006) Giα and Gβ subunits both define selectivity of G protein activation by α2-adrenergic receptors. Proc. Natl. Acad. Sci. U.S.A. 103, 212–217 [DOI] [PMC free article] [PubMed] [Google Scholar]
- 15. Azpiazu I., Akgoz M., Kalyanaraman V., Gautam N. (2006) G protein βγ11 complex translocation is induced by Gi, Gq and Gs coupling receptors and is regulated by the α subunit type. Cell. Signal. 18, 1190–1200 [DOI] [PMC free article] [PubMed] [Google Scholar]
- 16. Digby G. J., Lober R. M., Sethi P. R., Lambert N. A. (2006) Some G protein heterotrimers physically dissociate in living cells. Proc. Natl. Acad. Sci. U.S.A. 103, 17789–17794 [DOI] [PMC free article] [PubMed] [Google Scholar]
- 17. Oldham W. M., Hamm H. E. (2006) Structural basis of function in heterotrimeric G proteins. Q. Rev. Biophys. 39, 117–166 [DOI] [PubMed] [Google Scholar]
- 18. Lazar J., Bondar A., Timr S., Firestein S. J. (2011) Two-photon polarization microscopy reveals protein structure and function. Nat. Meth. 8, 684–690 [DOI] [PubMed] [Google Scholar]
- 19. Hollins B., Kuravi S., Digby G. J., Lambert N. A. (2009) The c-terminus of GRK3 indicates rapid dissociation of G protein heterotrimers. Cell. Signal. 21, 1015–1021 [DOI] [PMC free article] [PubMed] [Google Scholar]
- 20. Lodowski D. T., Pitcher J. A., Capel W. D., Lefkowitz R. J., Tesmer J. J. (2003) Keeping G proteins at bay. A complex between G protein-coupled receptor kinase 2 and Gβγ. Science 300, 1256–1262 [DOI] [PubMed] [Google Scholar]
- 21. Ford C. E., Skiba N. P., Bae H., Daaka Y., Reuveny E., Shekter L. R., Rosal R., Weng G., Yang C. S., Iyengar R., Miller R. J., Jan L. Y., Lefkowitz R. J., Hamm H. E. (1998) Molecular basis for interactions of G protein βγ subunits with effectors. Science 280, 1271–1274 [DOI] [PubMed] [Google Scholar]
- 22. Hamill O. P., Marty A., Neher E., Sakmann B., Sigworth F. J. (1981) Improved patch-clamp techniques for high-resolution current recording from cells and cell-free membrane patches. Pflugers Arch. 391, 85–100 [DOI] [PubMed] [Google Scholar]
- 23. Leaney J. L., Benians A., Graves F. M., Tinker A. (2002) A novel strategy to engineer functional fluorescent inhibitory G-protein α subunits. J. Biol. Chem. 277, 28803–28809 [DOI] [PubMed] [Google Scholar]
- 24. Coleman D. E., Berghuis A. M., Lee E., Linder M. E., Gilman A. G., Sprang S. R. (1994) Structures of active conformations of Gi α 1 and the mechanism of GTP hydrolysis. Science 265, 1405–1412 [DOI] [PubMed] [Google Scholar]
- 25. Bourne H. R., Sanders D. A., McCormick F. (1991) The GTPase superfamily. Conserved structure and molecular mechanism. Nature 349, 117–127 [DOI] [PubMed] [Google Scholar]
- 26. Vorobiov D., Bera A. K., Keren-Raifman T., Barzilai R., Dascal N. (2000) Coupling of the muscarinic m2 receptor to G protein-activated K+ channels via Gα(z) and a receptor-Gα(z) fusion protein. Fusion between the receptor and Gα(z) eliminates catalytic (collision) coupling. J. Biol. Chem. 275, 4166–4170 [DOI] [PubMed] [Google Scholar]
- 27. Digby G. J., Sethi P. R., Lambert N. A. (2008) Differential dissociation of G protein heterotrimers. J. Physiol. 586, 3325–3335 [DOI] [PMC free article] [PubMed] [Google Scholar]
- 28. Fung B. K. (1983) Characterization of transducin from bovine retinal rod outer segments. I. Separation and reconstitution of the subunits. J. Biol. Chem. 258, 10495–10502 [PubMed] [Google Scholar]
- 29. Chidiac P., Ross E. M. (1999) Phospholipase C-β1 directly accelerates GTP hydrolysis by Gαq and acceleration is inhibited by Gβγ subunits. J. Biol. Chem. 274, 19639–19643 [DOI] [PubMed] [Google Scholar]
- 30. Berlin S., Keren-Raifman T., Castel R., Rubinstein M., Dessauer C. W., Ivanina T., Dascal N. (2010) Gα(i) and Gβγ jointly regulate the conformations of a Gβγ effector, the neuronal G protein-activated K+ channel (GIRK). J. Biol. Chem. 285, 6179–6185 [DOI] [PMC free article] [PubMed] [Google Scholar]
- 31. Berlin S., Tsemakhovich V. A., Castel R., Ivanina T., Dessauer C. W., Keren-Raifman T., Dascal N. (2011) Two distinct aspects of coupling between Gα(i) protein and G protein-activated K+ channel (GIRK) revealed by fluorescently labeled Gα(i3) protein subunits. J. Biol. Chem. 286, 33223–33235 [DOI] [PMC free article] [PubMed] [Google Scholar]
- 32. Chisari M., Saini D. K., Cho J. H., Kalyanaraman V., Gautam N. (2009) G protein subunit dissociation and translocation regulate cellular response to receptor stimulation. PLoS ONE 4, e7797. [DOI] [PMC free article] [PubMed] [Google Scholar]
- 33. Wall M. A., Coleman D. E., Lee E., Iñiguez-Lluhi J. A., Posner B. A., Gilman A. G., Sprang S. R. (1995) The structure of the G protein heterotrimer Giα1β1γ2. Cell 83, 1047–1058 [DOI] [PubMed] [Google Scholar]
- 34. Wall M. A., Posner B. A., Sprang S. R. (1998) Structural basis of activity and subunit recognition in G protein heterotrimers. Structure 6, 1169–1183 [DOI] [PubMed] [Google Scholar]