

Background: Although highly homologous to MBD2, the functional role of MBD3 remains in question.
Results: MBD3 preferentially localizes to methylated and, to a lesser degree, unmethylated CpG dinucleotides.
Conclusion: Dynamic distribution between methylated and unmethylated sites modifies the genomic localization of MBD3.
Significance: Changes in the dynamic distribution on DNA dictate functional differences between MBD proteins.
Keywords: Biophysics, DNA Binding Protein, DNA Methylation, Nuclear Magnetic Resonance, Protein Dynamics, MBD2, MBD3, Hydroxymethylated DNA, Residual Dipolar Couplings
Abstract
Although highly homologous to other methylcytosine-binding domain (MBD) proteins, MBD3 does not selectively bind methylated DNA, and thus the functional role of MBD3 remains in question. To explore the structural basis of its binding properties and potential function, we characterized the solution structure and binding distribution of the MBD3 MBD on hydroxymethylated, methylated, and unmethylated DNA. The overall fold of this domain is very similar to other MBDs, yet a key loop involved in DNA binding is more disordered than previously observed. Specific recognition of methylated DNA constrains the structure of this loop and results in large chemical shift changes in NMR spectra. Based on these spectral changes, we show that MBD3 preferentially localizes to methylated and, to a lesser degree, unmethylated cytosine-guanosine dinucleotides (CpGs), yet does not distinguish between hydroxymethylated and unmethylated sites. Measuring residual dipolar couplings for the different bound states clearly shows that the MBD3 structure does not change between methylation-specific and nonspecific binding modes. Furthermore, residual dipolar couplings measured for MBD3 bound to methylated DNA can be described by a linear combination of those for the methylation and nonspecific binding modes, confirming the preferential localization to methylated sites. The highly homologous MBD2 protein shows similar but much stronger localization to methylated as well as unmethylated CpGs. Together, these data establish the structural basis for the relative distribution of MBD2 and MBD3 on genomic DNA and their observed occupancy at active and inactive CpG-rich promoters.
Introduction
The mammalian methylcytosine-binding domain proteins (MeCP2 and MBD1–4) selectively bind symmetrically methylated CpGs through a common methylcytosine-binding domain (MBD)2 (1) and likely arose from a gene duplication event of a single common ancestral protein (MBD2/3) (2). The preference of MBD2 for methylated DNA has been retained in both invertebrates and vertebrates; (3); however, the highly homologous MBD3 shows little to no preference for methylated DNA as a result of key differences in amino acids critical for DNA contact within the MBD (4, 5). Both proteins recruit a nucleosome remodeling and deacetylase (NuRD) complex (6) but in a mutually exclusive manner (7). The MBD2-NuRD complex has been specifically shown to promote methylation-dependent gene silencing and represents a potential therapeutic target for gene reactivation (6, 8–13), whereas the function of the MBD3-NuRD complex has not been clearly delineated.
A recent study showed that MBD3 co-localizes with Tet1 and suggested preferential binding to hydroxymethylated CpGs (hmCpG) (14). Subsequent experiments, however, failed to show a binding affinity preference for hmCpG (15) but instead found that both MBD2 and MBD3 preferentially localize to transcriptional start sites with CGIs (16, 17). MBD2 predominates at methylated CGIs, and the associated genes show reduced expression, whereas MBD3 appears to favor transcriptional start sites with unmethylated CGIs and is enriched at active promoters (16).
To help elucidate the structural differences between MBD2 and MBD3 and evaluate the recently proposed hydroxymethylation selectivity (14), we determined the structure of MBD3 bound to DNA containing a single hmCpG dinucleotide. We observed that MBD3 adopts a structure very similar to that of MBD2. A critical loop connecting two anti-parallel β strands is less well defined in MBD3, but otherwise the two structures are nearly identical. Furthermore, we show that MBD3 does not specifically recognize hmCpG, but chemical shift analysis indicates that MBD3 binds differently to mCpG and spends a significant proportion of time on methylated sites. Occupancy depends on the number of unmethylated sites available, and MBD3 demonstrates chemical shift averaging indicative of fast exchange between the methylated and nonspecific binding modes. Residual dipolar coupling (RDC) analysis confirms our findings by showing that MBD3 preferentially localizes to mCpG sites and that MBD3 adopts a very similar structure on mCpG, CpG, and hmCpG DNA. As expected, MBD2 shows a strong preference for mCpG sites, exclusively localizing to the mCpG dinucleotide. We also find that MBD2 localization is influenced by unmethylated CpG density and that MBD2 shows an unanticipated additional weak localization to hmCpG.
Taken together, this information leads to a model in which the methylation specificity and occupancy of an MBD can be titrated by single amino acid substitutions. Importantly, the tendency to localize on a specific site does not necessarily translate into a global binding affinity preference. These data are consistent with recent studies showing that both MBD2 and MBD3 localize to transcription start sites associated with CGIs (16, 17). The ability to condense chromatin and silence transcription at or near methylated CGIs reflects MBD2 high affinity and stable occupancy of mCpG sites. Hence, we propose that MBD3 evolved, at least in part, to counterbalance MBD2 on unmethylated CGIs. The presence of MBD3 at unmethylated CGIs could modify the distribution of MBD2 and potentially mitigate strong silencing by the high affinity, more strongly localizing MBD2 protein, thereby preserving bivalency with respect to transcription.
EXPERIMENTAL PROCEDURES
Purification of Proteins and DNA
The methylcytosine-binding domain of MBD3 (amino acid residues 1–70) was cloned, expressed, and purified as described previously for cMBD2 (18). 17- and 27-bp complementary oligonucleotides (Table 1) were purchased (Integrated DNA Technologies), annealed, and purified as described previously (18). The sequences were derived from the p16INK4a promoter known to be a native target sequence for MBD2 (5).
TABLE 1.
DNA sequences
The lengths and nucleotide sequences are given for the different dsDNA molecules used for MBD2 and MBD3 binding studies.
| Name | Length | Sequence |
|---|---|---|
| bp | ||
| mCpG | 17 | GAGGCGCT(mC)GGCGGCAG |
| hmCpG | 17 | GAGGCGCT(hmC)GGCGGCAG |
| CpG(×3) | 17 | GAGGCGCTCGGCGGCAG |
| CpG(×1) | 17 | GAGGCCCTCGGGGGCAG |
| CpG(×0) | 17 | GAGGCCCTCTGGGGCAG |
| mCpG27 | 27 | GAGCTAGAGCGCT(mC)GGCGGCGCCAGGC |
| mCpG10 | 10 | GGAT(mC)GGCTC |
NMR Spectroscopy
Purified protein was combined with 10% excess purified dsDNA and buffer exchanged into 10 mm NaPO4, pH 6.5, 1 mm dithiothreitol, 10% 2H2O, and 0.02% sodium azide and concentrated to 0.2–1 mm. NMR spectra from standard experiments for resonance assignments, distance, and torsional angle restraints were collected on a Bruker Avance III 700-MHz instrument. The data were processed using NMRPipe (19) and analyzed with CcpNmr (20). Residual dipolar couplings were measured for complexes containing 2H,13C,15N-labeled protein using standard in-phase/anti-phase experiments and samples aligned by adding ∼12 mg/ml pf1 bacteriophage (Asla Biotech, Ltd.). For each aligned sample, a one-dimensional 2H spectrum of 2H2O was collected, and the deuterium quadrupole splitting was measured. When comparing RDC values between samples, the observed RDC values were normalized to an effective deuterium quadrupole splitting of 10 Hz.
Structure Calculations
The structure of the MBD3 MBD was calculated by simulated annealing as implemented in the Xplor-NIH software package (21) and based on NOE-derived distance constraints, torsion angle restraints, and residual dipolar couplings, as well as a torsion angle database potential of mean force (22) and a quartic van der Waals repulsion term for nonbonded contacts (23). Backbone torsional angle restraints were derived from chemical shifts using the TALOS+ software (24), and hydrogen bond distance and angle restraints were introduced based on backbone torsional angles and characteristic NOE patterns.
Binding Affinity
Binding affinities were determined by surface plasmon resonance analysis on a Biacore T100 system (GE Healthcare) as described previously (18). The binding affinity was determined from steady state analysis of the SPR relative response at varying concentrations of protein. As previously shown, the maximum steady state response (Rmax) in SPR depends on stoichiometry (n) of binding (25). Prior to fitting, the steady state response at each protein concentration (RA) was normalized (Rnorm) to the total DNA immobilized (Rl) and molecular weights of the DNA and protein (MWL and MWA, respectively).
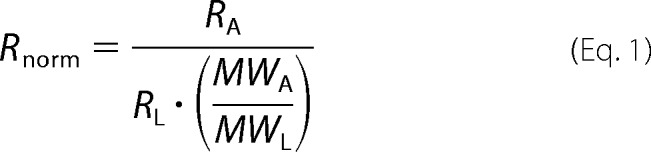 |
Final data analysis, plotting, and curve fitting were performed with pro Fit software (QuantumSoft).
RESULTS
Solution Structure of the MBD3 MBD Is Nearly Identical to That of MBD2
We determined the solution structure of the MBD from MBD3 (amino acids 1–70) bound to a 17-bp dsDNA with a central hydroxymethylated CpG dinucleotide. The structure was calculated based on 528 NOE-derived distance constraints, 120 dihedral angle restraints, and 53 residual dipolar coupling restraints (Table 2). The overall protein structure is well defined (Fig. 1, A and B) with average pairwise root mean square deviations (RMSD) of 0.7 ± 0.1 Å (backbone) and 1.2 ± 0.1 Å (all heavy atoms) for ordered regions (residues 6–23 and 34–71). As expected, the fold is very similar to that of chicken MBD2 (cMBD2; RMSD = 2.0 ± 0.1 Å) for the same ordered regions (Fig. 1D) (18).
TABLE 2.
NMR and refinement statistics
The number and type of structural constraints as well as the final refinement statistics are presented for the solution structure of MBD3 bound to hydroxymethylated DNA.
| Protein | |
|---|---|
| NMR distance and dihedral constraints | |
| Distance constraints | |
| Total NOE | 528 |
| Intraresidue | 102 |
| Inter-residue | |
| Sequential (|i − j| = 1) | 155 |
| Medium range (|i − j| ≤ 4) | 111 |
| Long range (|i − j| > 5) | 160 |
| Hydrogen bonds | 32 |
| Total dihedral angle restraints | 120 |
| φ | 54 |
| ψ | 54 |
| χ1 | 12 |
| Total RDCs | |
| NH | 53 |
| Q% | |
| NH | 7.0 |
| Structure statistics | |
| Violations (mean and S.D.) | |
| Distance constraints (Å) | 0.018 ± 0.003 |
| Dihedral angle constraints (°) | 0.4 ± 0.1 |
| Maximum dihedral angle violation (°) | 4.8 |
| Maximum distance constraint violation (Å) | 0.48 |
| Deviations from idealized geometry (mean and S.D.) | |
| Bond lengths (Å) | 0.04 ± 0.01 |
| Bond angles (°) | 0.69 ± 0.002 |
| Impropers (°) | 2.01 ± 0.006 |
| Average pairwise RMSD (Å)a | |
| Heavy | 1.2 ± 0.1 |
| Backbone | 0.7 ± 0.1 |
| Ramachandran plot summary for ordered residues | |
| Most favored regions | 92.4% |
| Additionally allowed regions | 7.4% |
| Generously allowed regions | 0.2% |
| Disallowed regions | 0.0% |
a Pairwise RMSD and S.D. from the mean was calculated among 20 (of 50) lowest energy refined structures for ordered residues (residues 6–23 and 34–71).
FIGURE 1.

Solution structure of MBD3 methyl-binding domain bound to hydroxymethylated DNA. A, stereo ribbon diagram (blue) of the MBD3 solution structure is shown for the ensemble of 20 calculated structures (Protein Data Bank code 2mb7). The loop connecting β2 and β3 (residues 24–33) is highlighted in light blue. B, ribbon diagram of the lowest energy solution structure is shown with key contact and chemical shift reporter residues depicted as sticks. C, per residue RMSD for backbone atoms is plotted for the solution structure ensemble of MBD3 (blue) and for the solution structure ensemble of cMBD2 (red) previously reported (Protein Data Bank code 2ky8) (18). D, the best fit protein alignment of the solution structures of cMBD2 (green) and MBD3 (blue) MBD is shown bound to the methylated DNA from the cMBD2-dsDNA solution structure (Protein Data Bank code 2ky8). E, diagram highlighting the cMBD2 hydrogen-bonding network while bound to methylated DNA and with key residues depicted as sticks. Structure diagrams were generated using the PyMOL program (Delano Scientific LLC).
As with all MBD proteins studied to date, the topology of the MBD comprises a four-stranded β-sheet followed by a single α-helix and a C-terminal loop. The central two strands of the β-sheet (β2 and β3) form a long finger-like projection that can extend down and across the major groove of DNA to make base specific contacts. The most notable difference between the cMBD2 and MBD3 structures is that the loop connecting the long fingerlike projection is not as well ordered in MBD3 (residues 24–33; Fig. 1, A and C) with an RMSD of 1.7 ± 0.5 Å (backbone) as compared with cMBD2 with an RMSD of 0.9 ± 0.3 Å. Residues at the base of this loop form critical DNA specific contacts and a hydrogen bond network that stabilizes the interaction with the methylated CpG dinucleotide (Fig. 1E).
Predicting backbone order parameters (S2) based on chemical shifts using the random coil index method (24, 26) confirms that this loop is less well ordered in MBD3 (Fig. 2). The difference in predicted S2 between complexes shows that residues 24–33 become progressively more ordered between the MBD3-hmCpG, MBD3-mCpG, and cMBD2-mCpG complexes, respectively. Thus in the absence of a methylation-specific binding mode, the loop connecting the central two β-strands is more flexible.
FIGURE 2.

Methyl-specific binding mode stabilizes a dynamic loop in MBD3. A, ribbon diagram of the MBD3 solution structure is shown and colored based on order parameters predicted from chemical shift index (S2; shading from blue to red reflects low to high). B, the predicted order parameters (S2) are plotted for the MBD3-hmCpG (black), MBD3-mCpG (blue dotted), and cMBD2-mCpG (red) complexes. C, bar plots are shown for the difference in order parameters (ΔS2) between the cMBD2-mCpG complex and MBD3-mCpG (black) and MBD3-hmCpG (gray) complexes. The loop connecting β2 and β3 (residues 24–33) is highlighted in light yellow in B and C.
Filtered intermolecular NOE spectra did not contain NOE cross-peaks, which is consistent with the observed line broadening for residues at the DNA interface and the overall lower affinity of MBD3 for DNA and suggests nonspecific protein-DNA interaction with dynamic exchange between binding sites. Based on subsequent analyses that indicate MBD3 preferentially localizes to methylated sites, we collected filtered NOE spectra for MBD3 bound to methylated DNA (mCpG). Likewise, we did not detect any intermolecular NOE cross-peaks with methylated DNA, indicating that MBD3 exchanges among different binding modes whether on methylated or hydroxymethylated DNA. Given the absence of informative intermolecular NOEs, we did not determine a solution structure of the protein-DNA complex. Importantly, we noted that chemical shifts of MBD3 bound to hmCpG (discussed in detail below) are more similar to MBD3 on unmethylated DNA than methylated DNA, which led us to compare spectra of MBD3 on different DNA molecules to probe both methylation-specific and nonspecific DNA association.
MBD3 Spends a Significant Portion of Time on Methylated Sites
As first described for MeCP2 (27) and later described for cMBD2 (18), a pair of highly conserved arginine residues in MBD proteins form bidentate hydrogen bonds with the symmetrically opposed guanine bases of an mCpG dinucleotide (Fig. 1E). The aliphatic portion of each arginine packs against the methyl group of the neighboring methylcytosine. Given that an unmethylated CpG contains symmetrically opposed guanines, we hypothesized that MBDs should still recognize the CpG dinucleotide, but with lower affinity. Even though MBD3 binds DNA with lower overall affinity and shows less selectivity for methylated DNA, the critical arginine residues are conserved and could provide sequence specific recognition of CpG dinucleotides.
In 15N HSQC spectra, we noted that several cross-peaks that showed unusual chemical shifts for cMBD2-mCpG did not show the same chemical shifts for MBD3-hmCpG (Fig. 3B). In particular, the 1Hϵ of Arg24, which forms a side chain hydrogen bond with Asp32 and is shifted far downfield (9.5 ppm) in cMBD2-mCpG, is only shifted to 7.5 ppm in MBD3. Likewise, Gly27 is shifted upfield in 15N to 102 ppm in cMBD2-mCpG, but not to the same degree in MBD3-hmCpG (105 ppm), and finally Ala30 is shifted upfield in 1H to 6.8 ppm in cMBD2-mCpG but only 7.6 ppm in MBD3-hmCpG.
FIGURE 3.

Preferential localization of MBD3 to mCpG sites. A, bar plots show the chemical shift distances between MBD3-dsDNA complexes. B, an overlay of 15N HSQC spectra are shown for key reporter residues of MBD3 bound to CpG(×0), CpG(×1), CpG(×3), mCpG, and hmCpG as well as MBD3KY and cMBD2 bound to mCpG. C, the derivation of a simple statistical mechanical model for the distribution of MBD3 on mCpG (top panel) is shown with a mixed rendering diagram (bottom panel) depicting MBD3 docked onto a methylated site (red) as well as four nonmethylated sites (blue) of the mCpG DNA. Arrows indicate rapid exchange between these binding modes. D, overlays of 15N HSQC spectra are shown for key reporter residues of MBD3 and MBD3KY while bound to DNA of varying lengths.
We hypothesized that these large chemical shift changes reflect a difference between methylation-specific and nonspecific binding modes. Arg24 and Asp32 are positioned at the N and C termini of the poorly structured loop in MBD3, whereas Ala30 and Gly27 also fall within this same loop. Methylation-specific binding stabilizes the Arg24–Asp32 H-bond and the loop containing Gly27 and Ala30. To test this hypothesis, we compared HSQCs for MBD3 bound to a DNA sequence with three CpG dinucleotides in which the central CpG is methylated (mCpG), hydroxymethylated (hmCpG), or unmethylated (CpG(×3)), as well as similar DNA sequences with only one (CpG(×1)) or no CpGs (CpG(×0)) (Table 1). We found that the chemical shifts of these reporter resonances fall on a line between extrema represented by cMBD2-mCpG and MBD3-CpG(×0). Importantly, the peak position for each of the reporter resonances falls at the same fractional distance between these extrema (Fig. 3B), shifting toward the position in the cMBD2-mCpG complex as the number of unmethylated CpG sites increases and with the addition of a methylated CpG. These observations strongly indicate chemical shift averaging between two binding modes (28) reflective of fast exchange between methylation-specific and nonsequence specific interaction with DNA. Furthermore, the chemical shift changes are consistent with preferential localization at the CpG and mCpG sites.
Using cMBD2 as representative of the methylation-specific binding mode could introduce structural and primary sequence differences that affect observed chemical shifts. Therefore we sought to generate an MBD3 MBD that binds with high selectivity for mCpG, which would allow us to evaluate chemical shift changes for more backbone resonances with fewer confounding sequence variations. Previous studies have established that the lack of mCpG specificity for MBD3 reflects two amino acids (His30 and Phe34) that differ from other MBD proteins (Lys32 and Tyr36 in cMBD2) (4, 5). We introduced the H30K,F34Y double mutation into MBD3 (MBD3KY), and as expected, this mutant bound with higher affinity and selectivity for mCpG comparable to cMBD2 (Fig. 7 and Table 3). Each of the reporter resonances now show chemical shifts that are very similar to those of the cMBD2-mCpG complex, confirming that the unique chemical shifts do reflect a methylation-specific binding mode.
FIGURE 7.

MBD2 and MBD3 localization does not translate into a global binding affinity preference. Steady state surface plasmon resonance measurements are shown for MBD3 (top panel) and cMBD2 (bottom panel) binding to immobilized double-stranded oligonucleotides of varying CpG content and methylation status. The steady state response was normalized to the amount of DNA immobilized (Equation 1) such that the maximum response reflects the stoichiometry of binding.
TABLE 3.
Binding affinity
The dissociation constant (KD), Rmax, and χ2 values are given for different protein and DNA complexes as determined by steady state analysis of surface plasmon resonance studies.
| Protein | DNA | KD ± S.E. | Rmaxa | χ2 (×10−3) |
|---|---|---|---|---|
| μm | ||||
| MBD3 | mCpG | 54 ± 7 | 3.2 | 25 |
| MBD3 | CpG(×3) | NDb | ||
| MBD3 | CpG(×1) | ND | ||
| MBD3 | CpG(×0) | ND | ||
| MBD3 | hmCpG | ND | ||
| MBD3KY | mCpG) | 0.13 ± 0.01 | 1.0 | 2.6 |
| MBD3KY | CpG(×3) | 17 ± 2 | 2.1 | 1.8 |
| MBD2 | mCpG | 0.11 ± 0.01 | 0.8 | 1.0 |
| MBD2 | CpG(×3) | 74 ± 4 | 4.8 | 3.8 |
| MBD2 | CpG(×1) | 78 ± 7 | 4.8 | 7.2 |
| MBD2 | CpG(×0) | 68 ± 3 | 5.4 | 5.9 |
| MBD2 | hmCpG | 54 ± 8 | 4.3 | 51 |
a Normalized such that Rmax reflects stoichiometry.
b Weak binding and solubility limits preclude accurate determination of binding affinity.
To further explore the chemical shift changes associated with the different binding modes, we assigned the backbone resonances (15N,1H) for MBD3 bound to mCpG or CpG(×3) and MBD3KY bound to mCpG. In Fig. 3A, the chemical shift distances are plotted for backbone resonances between the different complexes. The largest chemical shift changes are seen for the poorly structured loop (residues 24–33) when comparing the MBD3KY-mCpG and MBD3-mCpG complexes with the MBD3-hmCpG complex. In contrast, the 15N HSQC spectra for the MBD3-hmCpG and MBD3-CpG(×3) complexes show nearly identical chemical shifts and spectra (Fig. 4A).
FIGURE 4.

Chemical shifts do not depend on concentration or the presence of hydroxymethylation. Overlays of 15N HSQC spectra are shown comparing MBD3-hmCpG (orange) (A) with MBD3-CpG(×3) and MBD3-mCpG at 600 μm (blue) and 300 μm (red) (B). Resonances for key reporter residues Ala30 and Gly27 are labeled.
These observations strongly support a binding model in which MBD3 exhibits fast exchange between methylation-specific and nonspecific binding. Thus the observed chemical shift (σobs) reflects a weighted average of the methylation-specific (σMBD3(KY)-mCpG) and nonspecific (σMBD3-CpG(×3)) binding modes, as given by Equation 2,
where ρm is the fraction in the methylation-specific binding mode. Hence, these chemical shifts are direct measures of the average time spent on the mCpG site. Using 11 backbone 1H,15N resonances that show a clear linear relationship between chemical shift and DNA bound, we find that MBD3 spends ∼43% (±5%) of the time on the mCpG site (Fig. 3B).
These data further indicate that, despite a lack of a strong global binding affinity preference for mCpG DNA, MBD3 still spends a significant proportion of time on methylated sites. To confirm that this finding was not the result of very weak binding with chemical shift averaging between DNA bound and free MBD3, we compared HSQCs for 600 and 300 μm samples of protein on DNA. The peaks for each reporter residue show nearly identical chemical shifts at both concentrations (Fig. 5B), indicating that the observed chemical shift changes of the reporter residues were not the result of exchange between bound and free states but instead represent averaging between different bound states. The observed differences in chemical shift represent changes in the binding distribution on DNA, not changes in the distribution between bound and free states.
FIGURE 5.

MBD3 localizes to methylated DNA sites without significant conformational change. A and B, comparisons of measured 1DNH RDCs normalized to 2H2O quadrupole splitting of 10 Hz are plotted for MBD3-mCpG versus MBD3-CpG(×3) (A) and MBD3-mCpG versus MBD3KY-mCpG complexes (B). Red dotted ovals highlight those values that fall of the line of identity (gray line). C, the sum of squared residuals (SSR) is plotted as a function of ρm (Equation 3). The sum of squared residuals is minimized (red circle and arrow) at 37% mCpG bound (ρm = 0.37). D, plotting 1DNH RDCs for MBD3-mCpG observed versus predicted with ρm = 0.37 (Equation 3) shows good agreement with tight clustering around y = x. E, the measured 1DNH RDCs for each complex (MBD3-CpG(×3), MBD3KY-mCpG, and MBD3-mCpG, left to right plots, respectively) were fit to the solution structure of MBD3 by singular value decomposition, and the observed versus predicted values were plotted. The Q factors and correlation coefficients show good agreement with the solution structure indicating that the backbone structure of MBD3 does not change between complexes.
We developed a statistical-mechanical model to describe the distribution of MBD3 on methylated DNA (Fig. 3C) in which the partition function comprises a sum of Boltzmann factors (e−E(i)/kT) for methylation-specific and nonspecific binding modes, ΔE is the difference in energy between binding modes, and N is the number of nonspecific sites. The additional methylation-specific interactions formed by MBD2 lead to a larger ΔE, thereby increasing ρm and the relative selectivity for mCpG. Without these interactions, MBD3 shows a smaller ΔE, ρm is reduced but still not 0, and MBD3 distributes unevenly between mCpGs and unmethylated sites. Fig. 3C depicts a simplified structural model of this distribution in which the MBD3 structure was docked onto the 17-bp DNA fragment at the centrally methylated mCpG (red) as well as four “nonspecific” binding sites (blue). The statistical model further indicates that localizing to an mCpG depends on the number of nonspecific sites available (N) and therefore the length of DNA. We tested this latter prediction by comparing chemical shifts for the reporter residues of MBD3 on 10-, 17-, and 27-bp DNA with a single mCpG (Fig. 3D). Indeed, we found that increasing DNA length results in chemical shift changes for Gly27 and Ala30 toward the unmethylated binding mode.
Residual Dipolar Couplings Confirm MBD3 Localizes to Methylated Sites without Significant Conformational Change
As an alternative method to assess the ensemble of binding modes, we measured residual dipolar couplings (1DNH) for MBD3 bound to methylated and unmethylated DNA as well as for MBD3KY bound to methylated DNA. As can be seen in Fig. 5, the observed 1DNH are similar but not identical between the different complexes. When plotting 1DNH from the unmethylated complex against those from wild type MBD3 or MBD3KY methylated complexes, the data fall off of the line of identity (y = x), as highlighted by the red dotted ovals in Fig. 5 (A and B). Because the observed residual dipolar couplings reflect a weighted average of the different binding modes (29), the 1DNH for each residue (n) of MBD3 bound to mCpG is a linear combination of 1DNH for MBD3 bound to CpG(×3) (nonspecific binding mode) and 1DNH for MBD3KY bound to mCpG (methylation-specific binding mode).
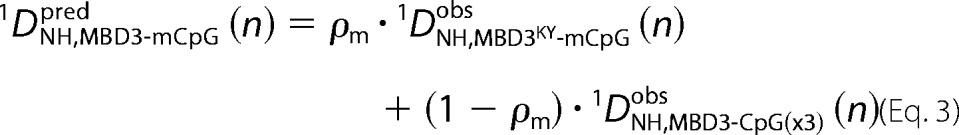 |
In Equation 3, ρm is the fraction in the mCpG specific binding mode and 1DNH(n) are the residual dipolar couplings for each residue in the MBD3-mCpG, MBD3-CpG, and MBD3KY-mCpG complexes. Fitting the observed 1DNH to Equation 3 as a function of ρm provides the fraction of MBD3 in the methylation-specific binding mode. As shown in Fig. 5C, the sum of squared residuals between predicted and observed 1DNH is minimized when ρm is 0.37. Plotting observed 1DNH,MBD3-mCpG versus predicted at ρm = 0.37 shows good agreement with tight clustering around y = x (Fig. 5D). Therefore, using RDCs as an independent measure of methylation selectivity, we find that MBD3 spends ∼37% of the time on the methylated binding site, which agrees within experimental error with the results from chemical shift analysis.
The residual dipolar couplings for each complex were fit to the solution structure of MBD3 bound to hmCpG using singular value decomposition as implemented by PALES software (30). Despite the differences in RDCs between complexes, each data set fit quite well to the MBD3 structure with Q factors of 19.9, 23.1, and 25.9% for the MBD3-mCpG, MBD3-CpG(×3), and MBD3KY-mCpG complexes, respectively (Fig. 5E). Therefore, the change between methylated and nonspecific binding modes does not involve backbone structural changes. The observed chemical shift changes likely reflect a stabilization of the dynamic loop between β2 and β3 but without significant structural rearrangements.
MBD2 and MBD3 Distribution Is Influenced by DNA Methylation Status and CpG Density
In contrast to MBD3, MBD2 appears to spend most of its time on the methylated site (Fig. 6A). The chemical shifts for reporter residues in MBD2 represent the extrema for the complexes studied. As shown in Fig. 6B, these peaks do not change with increasing DNA length, indicating that a large ΔE dominates the fraction bound to the methylated site and ρm ≈ 1 (Fig. 3C). The higher affinity and methylation selectivity of MBD2 results in exclusive occupancy of mCpG.
FIGURE 6.

MBD2 distribution is influenced by DNA methylation status and CpG density. A, an overlay of 15N HSQC spectra for key reporter residues of MBD2 bound to CpG(×0), CpG(×1), CpG(×3) ± MBD3, mCpG, and hmCpG shows that cMBD2 preferentially localizes to DNA with mCpG, hmCpG, and multiple CpG sites and that localization is modified by the presence of equimolar MBD3. B, an overlay of 15N HSQC spectra cMBD2 bound to mCpG DNA of varying lengths confirms that cMBD2 strongly prefers mCpG sites.
Comparing spectra of MBD2 and MBD3 when bound to the unmethylated oligonucleotides CpG(×0), CpG(×1), and CpG(×3) reveals that the reporter resonances shift toward the methylation-specific state with increasing numbers of CpGs (Fig. 3B; see also Fig. 7A). This finding indicates that both MBD2 and MBD3 localize to sites of increased CpG density. MBD3 shows relatively small chemical shift changes when bound to CpG(×3) as compared with CpG(×0), consistent with localizing to a CpG dinucleotide ∼9% (±3%) of the time. MBD2 shows a pronounced difference between CpG(×0) and CpG(×3) (Fig. 6A), showing that MBD2 preferentially localizes to CpG dinucleotides ∼33% (±11%) of the time. The reporter resonances also indicate that MBD2, but not MBD3, tends to localize to hmCpG and exhibits higher affinity for these sites (Fig. 6A and Table 3). To test whether MBD3 could influence how MBD2 distributes on unmethylated CpGs, we added equimolar MBD3 to 15N-MBD2 bound to CpG(×3) and found that the reporter peaks shifted toward those of the nonspecific binding mode (Fig. 6A). This finding shows that despite relatively weak overall binding affinity, MBD3 can modulate the distribution of MBD2 on CpG sites, shifting MBD2 toward the nonspecific binding mode.
Global Binding Affinity Does Not Reflect Localization Preferences on DNA
Binding affinities for each of the methylated and unmethylated sequences investigated were determined by steady state analysis of surface plasmon resonance data, as described previously (18). To allow for direct comparison of binding stoichiometry, we normalized the relative steady state response to the amount of DNA coupled to the sensor chip such that the maximum steady state response reflects the number of binding sites on the DNA (25). As can be seen in Fig. 7 and Table 3, both cMBD2 and MBD3KY bind mCpG DNA with high affinity and stoichiometry of approximately one (KD = 105 ± 7 nm and 113 ± 11 nm and Rmax = 0.83 ± 0.01 and 0.98 ± 0.02, respectively). Both bind unmethylated DNA with much lower affinity and high stoichiometry (KD = 74 ± 4 μm and 17 ± 2 μm and Rmax = 4.8 ± 0.1 and 2.1 ± 0.1, respectively) indicative of a high degree of methylation selectivity. Although NMR analyses indicate MBD3 binds DNA with sufficient affinity to be fully bound at 300 μm concentration (Fig. 4B), solubility limits of the isolated protein preclude accurate determination of binding constants by surface plasmon resonance. The qualitative results of these studies, however, are very similar to those reported previously by Hashimoto et al. (15), who determined DNA binding affinity for full-length MBD3 by fluorescence anisotropy. In those previous studies, MBD3 bound with similar low affinity to unmethylated and hydroxymethylated DNA and with a small but weak preference (∼5-fold) for methylated DNA. The current SPR data indicate a small preference for mCpG as well (Fig. 7).
Likewise, cMBD2 shows similar low affinity and high stoichiometry when binding to hydroxymethylated and unmethylated DNA with 0–3 CpG dinucleotides (Fig. 7 and Table 3). Therefore, global binding analysis reveals a marked preference for mCpG by cMBD2 and MBD3KY but only weak and nonspecific binding for all other complexes. These findings agree with several previous DNA binding analyses of MBD proteins (4, 5, 15, 18).
DISCUSSION
Although it has been established that MBD3 binds DNA with lower affinity and much less specificity for mCpG dinucleotides than MBD2, the functional role of MBD3 has not been well defined. Based on NMR structural, chemical shift, and residual dipolar coupling analyses, we have demonstrated that MBD3 binding to methylated DNA can be described by an ensemble of methylation-specific and nonspecific binding modes and that MBD3 preferentially localizes, albeit weakly, to methylated sites. In contrast, MBD3 does not distinguish between hydroxymethylated and unmethylated DNA but does show a slight preference for DNA with multiple CpG dinucleotides. A similar chemical shift analysis of cMBD2 showed that cMBD2 localizes almost exclusively to the methylated sites when present. Even on unmethylated DNA, cMBD2 preferentially localizes to CpG dinucleotides, especially as the number of available CpGs increases. Surprisingly, cMBD2 more avidly localized to a hydroxymethylated than an unmethylated site. Taken together, these findings lead to a model in which both MBD2 and MBD3 preferentially localize to DNA with multiple CpGs, whereas MBD2 more exclusively localizes to mCpGs.
Our studies lead to several novel observations and hypotheses. First, the differences in DNA binding between MBD3 and MBD2 reflect a change in the degree of selectivity for mCpG, not absolute differences in binding specificity. As we hypothesized, both MBD2 and MBD3 show a weak preference for CpG dinucleotides even the absence of methylation; however, MBD2 shows a much greater selectivity for mCpG than MBD3. These preferences are not necessarily apparent by global binding analyses but instead are reflected in the partitioning between methylation-specific and nonspecific binding modes on DNA. The observed changes in the NMR spectra arise from changes in the distribution of bound states not from changes in the distribution between bound and free states. In addition, the preference, although weak, for multiple CpG sites within the relatively small 17-base pair oligonucleotide used in these studies correlates with the whole genome analyses that show MBD2 and MBD3 localize to CGIs. Given that a CGI contains 100–1000 CpG dinucleotides, even a relatively small preference would lead to fairly strong localization at such sites. Furthermore, these findings correlate with the observations that both MBD2 and MBD3 are found at unmethylated CGIs, whereas MBD2 binds with much greater affinity and likely excludes MBD3 from methylated CGIs. Finally, these studies clearly indicate that MBD3 does not exhibit a binding preference for or a structural recognition of hmCpG DNA. From the standpoint of MBD3, hydroxymethylation is functionally equivalent to demethylation.
Genomes containing both MBD2 and MBD3 proteins emerge at the same time as the vertebrate methylation pattern, which includes largely unmethylated CGIs. This concurrence along with the preceding characterization of DNA binding by MBD3 leads us to speculate that MBD3 plays an important role in regulating genes with unmethylated CGIs. One possibility these studies raise is that MBD3 helps counterbalance the tendency of MBD2 to preferentially localize to CpG dinucleotides by competing with MBD2 at unmethylated CGIs. We found that MBD3 does modify the distribution of MBD2 on DNA such that MBD2 spends less time on CpG sites. Thus MBD3 could help prevent gene silencing by MBD2 at unmethylated gene promoters and enhancers depending on the relative concentration of the two proteins and cellular context. Indeed, recent studies have shown that knockdown of MBD3 can lead to decreased gene expression (16, 17).
Mammalian cells express multiple MBD proteins as well as different isoforms of individual MBDs. Different splice variants as well as distinct genes encode for MBD2 and MBD3 proteins, some of which lack the DNA binding domain itself. Here we have studied the solution structure and DNA binding of MBD3 by NMR. Chemical shift analyses indicate that MBD3 recognizes and preferentially localizes to both mCpG and CpG sites but not to the same extent as MBD2. Single amino acid differences dictate the degree to which these proteins localize on mCpG sites. Importantly these binding characteristics do not necessarily lead to changes in global binding affinities but rather correlate with localization of MBD2 and MBD3 to CGIs in whole cells. Hence a number of different NuRD complexes can be formed that show varying degrees of DNA methylation selectivity and provide distinct functional roles. For MBD3, these functional differences appear to reflect subtle distinctions in the behavior of the MBD when bound to methylated and unmethylated DNA. Therefore, these data establish a structural basis for the relative distribution of MBD2 and MBD3 on genomic DNA and help explain their observed occupancy at CpG-rich promoters.
This work was supported, in whole or in part, by National Institutes of Health Grants R01 GM098624 (to D. C. W.) and R01 DK029902 (to G. D. G.). NMR data were acquired using NMR instrumentation in the Virginia Commonwealth University Massey Cancer Center Structural Biology Core, and surface plasmon resonance data were acquired in the Virginia Commonwealth University Massey Cancer Center Flow Cytometry Core, both of which are supported, in part, by NCI Cancer Center Core Support Grant P30 CA016059.
The atomic coordinates and structure factors (code 2mb7) have been deposited in the Protein Data Bank (http://wwpdb.org/).
- MBD
- methylcytosine-binding domain
- CpG
- cytosine-guanosine dinucleotides
- hmCpG
- hydroxymethylated CpG
- CGI
- CpG island
- RDC
- residual dipolar coupling
- NuRD
- nucleosome remodeling and deacetylase complex
- RMSD
- root mean square deviation
- HSQC
- heteronuclear single quantum coherence.
REFERENCES
- 1. Hendrich B., Bird A. (1998) Identification and characterization of a family of mammalian methyl-CpG binding proteins. Mol. Cell Biol. 18, 6538–6547 [DOI] [PMC free article] [PubMed] [Google Scholar]
- 2. Hendrich B., Tweedie S. (2003) The methyl-CpG binding domain and the evolving role of DNA methylation in animals. Trends Genet. 19, 269–277 [DOI] [PubMed] [Google Scholar]
- 3. Matsumoto M., Toraya T. (2008) cDNA cloning, expression, and characterization of methyl-CpG-binding domain type 2/3 proteins from starfish and sea urchin. Gene. 420, 125–134 [DOI] [PubMed] [Google Scholar]
- 4. Saito M., Ishikawa F. (2002) The mCpG-binding domain of human MBD3 does not bind to mCpG but interacts with NuRD/Mi2 components HDAC1 and MTA2. J. Biol. Chem. 277, 35434–35439 [DOI] [PubMed] [Google Scholar]
- 5. Fraga M. F., Ballestar E., Montoya G., Taysavang P., Wade P. A., Esteller M. (2003) The affinity of different MBD proteins for a specific methylated locus depends on their intrinsic binding properties. Nucleic Acids Res. 31, 1765–1774 [DOI] [PMC free article] [PubMed] [Google Scholar]
- 6. Zhang Y., Ng H. H., Erdjument-Bromage H., Tempst P., Bird A., Reinberg D. (1999) Analysis of the NuRD subunits reveals a histone deacetylase core complex and a connection with DNA methylation. Genes Dev. 13, 1924–1935 [DOI] [PMC free article] [PubMed] [Google Scholar]
- 7. Le Guezennec X., Vermeulen M., Brinkman A. B., Hoeijmakers W. A., Cohen A., Lasonder E., Stunnenberg H. G. (2006) MBD2/NuRD and MBD3/NuRD, two distinct complexes with different biochemical and functional properties. Mol. Cell Biol. 26, 843–851 [DOI] [PMC free article] [PubMed] [Google Scholar]
- 8. Gnanapragasam M. N., Scarsdale J. N., Amaya M. L., Webb H. D., Desai M. A., Walavalkar N. M., Wang S. Z., Zu Zhu S., Ginder G. D., Williams D. C., Jr. (2011) p66α-MBD2 coiled-coil interaction and recruitment of Mi-2 are critical for globin gene silencing by the MBD2-NuRD complex. Proc. Natl. Acad. Sci. U.S.A. 108, 7487–7492 [DOI] [PMC free article] [PubMed] [Google Scholar]
- 9. Denslow S. A., Wade P. A. (2007) The human Mi-2/NuRD complex and gene regulation. Oncogene 26, 5433–5438 [DOI] [PubMed] [Google Scholar]
- 10. Kransdorf E. P., Wang S. Z., Zhu S. Z., Langston T. B., Rupon J. W., Ginder G. D. (2006) MBD2 is a critical component of a methyl cytosine-binding protein complex isolated from primary erythroid cells. Blood 108, 2836–2845 [DOI] [PMC free article] [PubMed] [Google Scholar]
- 11. Singal R., Wang S. Z., Sargent T., Zhu S. Z., Ginder G. D. (2002) Methylation of promoter proximal-transcribed sequences of an embryonic globin gene inhibits transcription in primary erythroid cells and promotes formation of a cell type-specific methyl cytosine binding complex. J. Biol. Chem. 277, 1897–1905 [DOI] [PubMed] [Google Scholar]
- 12. Feng Q., Zhang Y. (2001) The MeCP1 complex represses transcription through preferential binding, remodeling, and deacetylating methylated nucleosomes. Genes Dev. 15, 827–832 [DOI] [PMC free article] [PubMed] [Google Scholar]
- 13. Ng H. H., Zhang Y., Hendrich B., Johnson C. A., Turner B. M., Erdjument-Bromage H., Tempst P., Reinberg D., Bird A. (1999) MBD2 is a transcriptional repressor belonging to the MeCP1 histone deacetylase complex. Nat. Genet. 23, 58–61 [DOI] [PubMed] [Google Scholar]
- 14. Yildirim O., Li R., Hung J. H., Chen P. B., Dong X., Ee L. S., Weng Z., Rando O. J., Fazzio T. G. (2011) Mbd3/NURD complex regulates expression of 5-hydroxymethylcytosine marked genes in embryonic stem cells. Cell 147, 1498–1510 [DOI] [PMC free article] [PubMed] [Google Scholar]
- 15. Hashimoto H., Liu Y., Upadhyay A. K., Chang Y., Howerton S. B., Vertino P. M., Zhang X., Cheng X. (2012) Recognition and potential mechanisms for replication and erasure of cytosine hydroxymethylation. Nucleic Acids Res. 40, 4841–4849 [DOI] [PMC free article] [PubMed] [Google Scholar]
- 16. Baubec T., Ivánek R., Lienert F., Schübeler D. (2013) Methylation-dependent and -independent genomic targeting principles of the MBD protein family. Cell 153, 480–492 [DOI] [PubMed] [Google Scholar]
- 17. Günther K., Rust M., Leers J., Boettger T., Scharfe M., Jarek M., Bartkuhn M., Renkawitz R. (2013) Differential roles for MBD2 and MBD3 at methylated CpG islands, active promoters and binding to exon sequences. Nucleic Acids Res. 41, 3010–3021 [DOI] [PMC free article] [PubMed] [Google Scholar]
- 18. Scarsdale J. N., Webb H. D., Ginder G. D., Williams D. C., Jr. (2011) Solution structure and dynamic analysis of chicken MBD2 methyl binding domain bound to a target-methylated DNA sequence. Nucleic Acids Res. 39, 6741–6752 [DOI] [PMC free article] [PubMed] [Google Scholar]
- 19. Delaglio F., Grzesiek S., Vuister G. W., Zhu G., Pfeifer J., Bax A. (1995) NMRPipe. A multidimensional spectral processing system based on UNIX pipes. J. Biomol. NMR 6, 277–293 [DOI] [PubMed] [Google Scholar]
- 20. Vranken W. F., Boucher W., Stevens T. J., Fogh R. H., Pajon A., Llinas M., Ulrich E. L., Markley J. L., Ionides J., Laue E. D. (2005) The CCPN data model for NMR spectroscopy. Development of a software pipeline. Proteins 59, 687–696 [DOI] [PubMed] [Google Scholar]
- 21. Schwieters C. D., Kuszewski J. J., Tjandra N., Clore G. M. (2003) The Xplor-NIH NMR molecular structure determination package. J. Magn. Reson. 160, 65–73 [DOI] [PubMed] [Google Scholar]
- 22. Clore G. M., Kuszewski J. (2002) Chi1 rotamer populations and angles of mobile surface side chains are accurately predicted by a torsion angle database potential of mean force. J. Am. Chem. Soc. 124, 2866–2867 [DOI] [PubMed] [Google Scholar]
- 23. Clore G. M., Gronenborn A. M. (1998) New methods of structure refinement for macromolecular structure determination by NMR. Proc. Natl. Acad. Sci. U.S.A. 95, 5891–5898 [DOI] [PMC free article] [PubMed] [Google Scholar]
- 24. Shen Y., Delaglio F., Cornilescu G., Bax A. (2009) TALOS+. A hybrid method for predicting protein backbone torsion angles from NMR chemical shifts. J. Biomol. NMR 44, 213–223 [DOI] [PMC free article] [PubMed] [Google Scholar]
- 25. Mistrík P., Moreau F., Allen J. M. (2004) BiaCore analysis of leptin-leptin receptor interaction. Evidence for 1:1 stoichiometry. Anal. Biochem. 327, 271–277 [DOI] [PubMed] [Google Scholar]
- 26. Berjanskii M. V., Wishart D. S. (2005) A simple method to predict protein flexibility using secondary chemical shifts. J. Am. Chem. Soc. 127, 14970–14971 [DOI] [PubMed] [Google Scholar]
- 27. Ho K. L., McNae I. W., Schmiedeberg L., Klose R. J., Bird A. P., Walkinshaw M. D. (2008) MeCP2 binding to DNA depends upon hydration at methyl-CpG. Mol. Cell 29, 525–531 [DOI] [PubMed] [Google Scholar]
- 28. Tzeng S. R., Kalodimos C. G. (2012) Protein activity regulation by conformational entropy. Nature 488, 236–240 [DOI] [PubMed] [Google Scholar]
- 29. Williams D. C., Jr, Cai M., Suh J. Y., Peterkofsky A., Clore G. M. (2005) Solution NMR structure of the 48-kDa IIAMannose-HPr complex of the Escherichia coli mannose phosphotransferase system. J. Biol. Chem. 280, 20775–20784 [DOI] [PMC free article] [PubMed] [Google Scholar]
- 30. Zweckstetter M., Bax A. (2000) Prediction of sterically induced alignment in a dilute liquid crystalline phase. Aid to protein structure determination by NMR. J. Am. Chem. Soc. 122, 3791–3792 [Google Scholar]