

Background: EAAT2 glutamate transporter was suggested to modulate β-cell function.
Results: Conditional deletion of EAAT2 in pancreas was without consequences. Proteome analysis showed an abundance of neutral amino acid transporters and glutamate-metabolizing enzymes. No glutamate transporters were detected.
Conclusion: EAAT2 plays its main role in the brain. Islet glutamate is predominantly intracellularly produced.
Significance: Our work provides an overview of pancreas proteome, and conditional EAAT2 knock-out mice were generated.
Keywords: Glutamine Synthase, Immunohistochemistry, Insulin Secretion, Pancreatic Islets, Proteomics, Transgenic Mice, Excitatory Amino Acid Transporter, Glutamate Uptake, Slc1a2, VGLUT3
Abstract
Islet function is incompletely understood in part because key steps in glutamate handling remain undetermined. The glutamate (excitatory amino acid) transporter 2 (EAAT2; Slc1a2) has been hypothesized to (a) provide islet cells with glutamate, (b) protect islet cells against high extracellular glutamate concentrations, (c) mediate glutamate release, or (d) control the pH inside insulin secretory granules. Here we floxed the EAAT2 gene to produce the first conditional EAAT2 knock-out mice. Crossing with Nestin-cyclization recombinase (Cre) eliminated EAAT2 from the brain, resulting in epilepsy and premature death, confirming the importance of EAAT2 for brain function and validating the genetic construction. Crossing with insulin-Cre lines (RIP-Cre and IPF1-Cre) to obtain pancreas-selective deletion did not appear to affect survival, growth, glucose tolerance, or β-cell number. We found (using TaqMan RT-PCR, immunoblotting, immunocytochemistry, and proteome analysis) that the EAAT2 levels were too low to support any of the four hypothesized functions. The proteome analysis detected more than 7,000 islet proteins of which more than 100 were transporters. Although mitochondrial glutamate transporters and transporters for neutral amino acids were present at high levels, all other transporters with known ability to transport glutamate were strikingly absent. Glutamate-metabolizing enzymes were abundant. The level of glutamine synthetase was 2 orders of magnitude higher than that of glutaminase. Taken together this suggests that the uptake of glutamate by islets from the extracellular fluid is insignificant and that glutamate is intracellularly produced. Glutamine synthetase may be more important for islets than assumed previously.
Introduction
Accurate control of insulin secretion by pancreatic β-cells is critical for glucose homeostasis. Glutamate has been suggested to act as an intracellular messenger coupling glucose metabolism to insulin secretion (for a review, see Ref. 1). Although this model has been questioned by the demonstration of a dissociation between changes in islet glutamate and insulin secretion (2–5), glutamate is still at the crossroad between several metabolic pathways (6–8) involving both mitochondrial glutamate transporters (8) and several enzymes that are expressed in islet cells, including several transaminases, glutaminase, glutamate dehydrogenase, and glutamine synthetase (9–13). Furthermore, glutamate is claimed to modulate the pH inside secretory granules in β-cells (14) and has been suggested to be transported into the granules by means of vesicular glutamate transporters (VGLUTs).3 Such a mechanism would enable glutamate to be released by exocytosis (15–17). This linked intracellular handling of glutamate to a possible extracellular function. An extracellular messenger role was suggested by the demonstration of glutamate receptors in pancreas (1, 18). Consequently, changes in extracellular glutamate levels might alter receptor activation. This raised the question of whether excitatory amino acid (glutamate) transporters (EAATs) might limit receptor activation in similar ways as they do in the brain (19). Subsequently, mRNA encoding EAAT2 (Slc1a2) was identified in pancreas (20, 21). As these findings were potentially important, several investigators have followed up on this. However, as summarized in Table 1, there is a great deal of uncertainty. Some investigators have reported expression in the plasma membranes but have arrived at different conclusions with respect to cell types and functional roles (10, 22–25). Another study (26) proposed a radically new model in which EAAT2 colocalizes with the VGLUT3 in the membranes of insulin-containing secretory granules. VGLUT3 is suggested to transport glutamate into granules, and EAAT2 is suggested to carry glutamate out again. The net result of this proposed glutamate cycling is modulation of the pH and membrane potential of the granules. If this model is correct, it would have important implications not only from an endocrine point of view but also from a transporter biochemistry and cell biology point of view.
TABLE 1.
Reports describing the localization of EAAT2 in pancreas
All six studies agree that there is some EAAT2 in the pancreas, but the conclusions concerning localizations, expression levels, and functions are quite different. With the exception of one study (26), they all suggest that EAAT2 is in the plasma membranes.
| Localization | Species | Suggested function | Ref. |
|---|---|---|---|
| Labeling of N-glycoproteins at the cell surface resulted in detection of EAAT2 and EAAT3 in MIN6 cells but not in human islets. | Mouse MIN6 cells; man | EAAT2 is not discussed in the report but is listed in the supplemental data. | 25 |
| Both α-cells and β-cells in young mice were found to express low levels of EAAT2. EAAT2-positive cells were also found in the exocrine pancreas, the periductal areas in particular. EAAT2b was the predominant isoform. Higher labeling intensities were noted in adult mice, but the authors cautiously pointed out that the labeling could not be validated against knock-out mice. |
Mouse | EAAT2 is important for providing glutamate for glutamine synthesis in the islets. The hypothesis predicts that the EAATs are in the plasma membrane. | 10 |
| EAAT2 was selectively expressed in β-cells and was not detected in the plasma membrane. EAAT1, EAAT3, and VGLUT1 were not detected in islets. VGLUT2 was detected in α-cells. VGLUT3 was detected in both α-cells and β-cells. EAAT2 and VGLUT3 colocalized in secretory granules. Immunocytochemistry data suggested that there were several transporter complexes of each type in each granule (more than one gold particle per granule). There was also labeling in the granule core. |
Rat; mouse (C57/B6) | VGLUT3 is suggested to transport glutamate into granules, and EAAT2 is suggested to carry glutamate out again. The net result of this proposed glutamate cycling is modulation of the pH and membrane potential of the granules. Thus, the hypothesis requires the presence of both EAAT2 and VGLUT3 in the same granule. | 26 |
| EAAT2a is the only glutamate transporter in islets. EAAT2 is selectively expressed in β-cells and is targeted to the plasma membranes. |
Mouse; man; Cercopithecus monkeys | EAAT2 controls the concentration of glutamate in the extracellular fluid in islets and protects β-cells against high plasma glutamate levels. | 23 |
| Isolated rat α-cells and β-cells express mRNA for EAAT1, EAAT2, and EAAT3. The mRNA levels of EAAT1, EAAT2, and EAAT3 in β-cells were about 0.6, 0.4, and 0.5% of the levels in brain, respectively. The corresponding levels in α-cells are 1.5, 0.4, and 5%, respectively. The data were normalized using cyclophilin. |
Rat | The roles of the glutamate transporters are to release glutamate to modulate glucagon secretion from α-cells. The hypothesis predicts that the EAATs are in the plasma membrane and operate in reverse mode. | 24 |
| EAAT1, EAAT2, VGLUT1, and xCT (Slc7a11) were all detected in islet cells. The ducts also expressed xCT. EAAT3 was only found in acinar cells. |
Rats | Glutamate is secreted into the pancreatic juice, but there is no specific hypothesis for roles of the transporters in islet cells. | 22 |
The primary aim of the present investigation was to resolve these questions and thereby determine the physiological roles of EAAT2 in islets. To do this, we created conditional knock-out mice by floxing the EAAT2 gene, allowing selective deletion of EAAT2 in pancreas. This was necessary because EAAT2 is believed to be essential for brain function (19), and its absence from all cells results in epilepsy, hyperactivity, and death (27) before β-cells have acquired robust glucose responsiveness (28, 29). Unexpectedly, we did not confirm any role of EAAT2 in islets, and to ensure that this was not a false negative, we performed a full proteome analysis. This uncovered a pattern suggesting insignificant glutamate uptake in islets cells and net islet cell production of both glutamate and glutamine.
EXPERIMENTAL PROCEDURES
Materials
N,N′-Methylene bisacrylamide, acrylamide, ammonium persulfate, TEMED, and alkaline phosphatase substrates (nitroblue tetrazolium and 5-bromo-4-chloro-3-indolyl phosphate) were from Promega (Madison, WI). Sodium dodecyl sulfate (SDS) of high purity (>99% C12 alkyl sulfate), bis(sulfosuccinimidyl)suberate, SuperSignal West Dura® were from Pierce. Electrophoresis equipment was from Hoefer Scientific Instruments (San Francisco, CA). Molecular mass markers for SDS-polyacrylamide gel electrophoresis (SDS-PAGE), biotinylated anti-rabbit immunoglobulins, and nitrocellulose sheets (0.22-μm pores, 100% nitrocellulose) were from Amersham Biosciences. Paraformaldehyde and glutaraldehyde were from TAAB (Reading, UK). All other reagents were obtained from Sigma-Aldrich. Antibodies against glutamate transporters were from the same batches as described previously (Table 2). When not stated, the antibodies are directed to sequences from rat EAAT1 (30) and rat EAAT2 (31).
TABLE 2.
Antibodies to glutamate transporters
This table lists the antibodies used in the present study. These antibodies have been used in several studies (for testing, see Refs. 51 and 96).
| Antibody ID | Target protein | Splice variants | Antibody name | Animal no. | Antigen | Ref. |
|---|---|---|---|---|---|---|
| Ab148 | EAAT2 | All | Anti-B12 | 68518 | KQVEVRMHDSHLSSE-(amide) | 91 |
| Ab150 | EAAT2 | All | Anti-B12 | 68518 | KQVEVRMHDSHLSSE-(amide) | 45 |
| Ab360 | EAAT2 | All | Anti-B12 | 26970 | KQVEVRMHDSHLSSE-(amide) | 50 |
| Ab63 | EAAT2 | All | Anti-B372 | 82898 | RCLEDNLGIDK-(amide) | 51 |
| Ab95 | EAAT2 | All | Anti-B493 | 84946 | YHLSKSELDTIDSQHR-(amide) | 91 |
| Ab94 | EAAT2 | All | Anti-B518 | 84932 | TQSVYDDTKNHRESNSNQC-(amide) | 45 |
| Ab355 | EAAT2 | GLT1a | Anti-B563 | 1B0707 | SVEEEPWKREK-(free acid) | 42 |
| Ab171 | EAAT2 | All | Anti-73kDa | 85302 | EAAT2 protein purified from rat brain (92) | 93 |
| Ab531 | EAAT2 | All | 9C4 | (mouse mAb) | EAAT2 protein purified from rat brain (92) | 94 |
| Lot 118003 | EAAT2 | NCL-EAAT2 | (mouse mAb) | Recombinant C-terminal portion of human EAAT2 | 95 (Novocastra Laboratories, Newcastle, UK) | |
| Ab314 | EAAT1 | Anti-A522 | 8D0161 | PYQLIAQDNEPEKPVADSET-(amide) | 91 |
Animals
All animal experimentation was carried out in accordance with the European Communities Council Directive of November 24, 1986 (86/609/EEC) and the “Principles of Laboratory Animal Care” (National Institutes of Health publication number 85-23; revised, 1985). Formal approval to conduct the experiments described was obtained from the animal subjects review board of the Norwegian Governmental Institute of Public Health (Oslo, Norway). Care was taken to minimize the number of animals used and to avoid suffering. Mice were housed and bred exactly as described previously (32). Conventional EAAT2 knock-out mice were originally generated by K. Tanaka (27) by disrupting the part of the gene encoding the third transmembrane region of the EAAT2 (GLT1) protein. Knock-out (−/−) and wild-type (+/+) mice were produced by breeding heterozygote (+/−) mice, which had been backcrossed six to nine times with C57Black/6J mice.
Floxing of the EAAT2 Gene to Obtain Conditional Knock-out Mice
The targeting vector was constructed using the recombineering technique described previously (33). A 9,987-bp genomic DNA fragment (position Chromosome 2:102,584,270–102,594,257) containing exons 2–4 of the Slc1a2 gene was retrieved from bacterial artificial chromosome clone RP24-315H4. A loxP site was inserted into intron 2, replacing an EcoRV site. An frt-neo-frt-loxP cassette was inserted into intron 4, and an EcoRV site in intron 4 was deleted. Thus, a fragment of 4,074-bp genomic DNA containing exons 3 and 4 was floxed, and cyclization recombinase (Cre) excision will result in a frameshift deletion (Fig. 1A). The targeting vector was electroporated into D1 ES cells, which were derived from an F1 hybrid blastocyst of 129S6 × C57BL/6J by the Gene Targeting and Transgenic Facility at the University of Connecticut Health Center. The G418-resistant ES clones were screened by nested PCR using primers outside the construct paired with primers inside the neomycin cassette. The chimeric mice were generated by aggregating targeted ES cells with eight-cell embryos of CD-1 strain. The neomycin cassette was removed by breeding germ line chimeras with ROSA26FLP1 (stock number 003946, The Jackson Laboratory, Bar Harbor, ME) homozygous females. The ensuing mice with loxP sites in the EAAT2 gene are hereafter referred to as “EAAT2-flox” mice.
FIGURE 1.
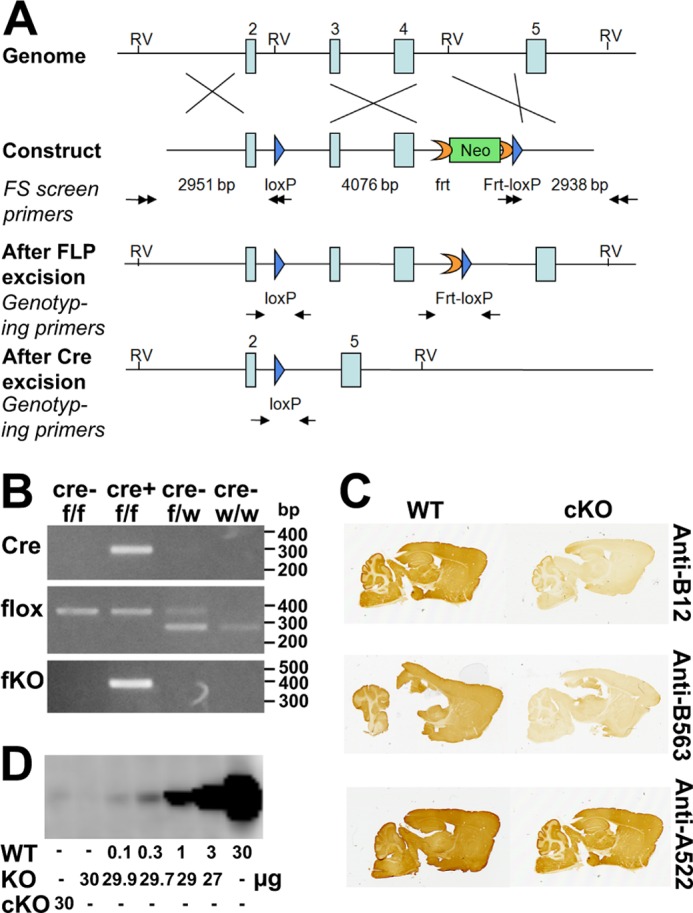
Generation and verification of the EAAT2-flox mice. A, generation of the EAAT2-flox mice. The gene-targeting construct contained exons 2–5 of the EAAT2 (Slc1a2) gene. A loxP sequence (blue arrow) was inserted into intron 2. An frt-PGKneo-frt-loxP cassette was inserted into intron 4, and an endogenous EcoRV (RV) site was deleted. The lengths of the homologous arms and of the floxed fragment are indicated below the construct. The black double arrows indicate the positions of the primers used for ES cell screening. The neomycin (Neo) cassette was removed in the EAAT2-flox mice generated from chimera × Rosa26FLP crossing. The genotyping primers are indicated by black arrows in the “After FLP excision” and “After Cre excision.” After Cre excision, the DNA encoding amino acid residues 53–187 is deleted. This region is essential for transport activity, and there will be no transport activity without it. Furthermore, the deletion causes the remaining sequences to be out of frame. B, PCR of genomic DNA of the brains from homozygote (f/f) or heterozygote (f/w) EAAT2-flox without (Cre−) or with (Cre+) Nestin11-Cre. PCR was performed to detect Cre, flox (loxP sites), and the recombination after Cre excision (fKO) as indicated. Note that when Cre is present the fKO allele emerges. Also note that the wild-type allele has lower molecular mass than the floxed allele, explaining why the there are two band in the heterozygous animals. C, peroxidase labeling of parasagittal brain sections from EAAT2-flox (WT) and conditional knock-out (cKO) mice with antibodies to the N terminus (Anti-B12; Ab360; 0.3 μg/ml) and the C terminus (Anti-B563; Ab355; 0.1 μg/ml) of EAAT2. Anti-A522 antibodies (Ab314; 0.1 μg/ml) to the C-terminal part of EAAT1 were used as a positive control. D, immunoblot analysis of the wild-type (WT) and conditional knock-out forebrain membrane fractions with antibodies to EAAT2 (Anti-B12; Ab360; 0.2 μg/ml). The WT tissue extracts were diluted in extracts from the conventional knock-out (KO) (27) to keep the total amount of protein constant at 30/per lane. Note that 30 μg from cKO gave a signal that was slightly weaker than that obtained after 1:300 dilution of the WT extract with KO extract.
Production of Conditional Knock-out Mice
To quickly verify the construction, we crossed the EAAT2-flox mice with a general deleter line (Hprt1-Cre; Ref. 34) directing Cre-mediated EAAT2 deletion in all cells. The offspring were crossed with each other to obtain mice homozygous for the deletion. Brains from 2-week-old mice were tested for content of EAAT2 protein by immunoblotting. No EAAT2 protein was detected, confirming that the EAAT2-flox construction worked as intended (data not shown). The EAAT2-flox mice were subsequently backcrossed eight generations to C57BL/6J. Then the EAAT2-flox mice were crossed with Nestin11-Cre mice (Ref. 35; catalog number 003771, The Jackson Laboratory). These mice display Cre-directed deletion in most cells of the central nervous system as well as in the peripheral nervous system, in the kidney, and in the scattered acinar cells in the exocrine pancreas, leaving the liver and endocrine islet cells unaffected (35–37). As shown (Fig. 1B), the lengths of the PCR products from brain DNA were as they should be according to the design (Fig. 1A), and immunocytochemistry (Fig. 1C) showed that only a few scattered cells in the brain still expressed EAAT2. The EAAT2 levels were estimated to be reduced to about 1% (Fig. 1D). These mice are hereafter referred to as “EAAT2-flox × Nestin11-Cre.”
In parallel, EAAT2-flox mice were crossed with transgenic mice expressing Cre either from the rat insulin promoter (RIP-Cre; Ref. 38; catalog number 003573, The Jackson Laboratory) or from the homeodomain factor IPF1/PDX1 (IPF1-Cre mice from H. Edlund, Umea, Sweden; Ref. 39) to delete EAAT2 selectively in pancreas. These mice are referred to below as “EAAT2-flox × RIP-Cre” and “EAAT2-flox × IPF1-Cre,” respectively.
Genotyping
Biopsies from ear or tail were Proteinase K-digested and subjected to PCR. The primers used to detect the EAAT2-flox genotype are 5′-CCAGCCATACTTGTGAAGAC-3′ and 5′-CCTCCAAGATGACTTGGAAC-3′. The expected PCR products are 279 bp for the wild-type allele and 365 bp for the floxed allele (see Fig. 1B, line 2). The primers used to detect the knock-out allele after Cre excision are 5′-CCAGCCATACTTGTGAAGAC-3′ and 5′-GTGACAATCTTACCTGGCTC-3′. The expected product is 367 bp for the knock-out allele (see Fig. 1B, fKO).
Measurement of Blood Glucose Levels
The mice (5–7 weeks) were fasted with water ad libitum for 12 h prior to blood sampling. Blood glucose was measured using Glucostrip® (Roche Diagnostics GmbH) attached to a glucometer (Accu-chek Aviva Nano, Roche Diagnostics GmbH).
RNA Isolation, cDNA Synthesis, and TaqMan® Assays
Pieces of tissues (5–15 mg) were collected from various organs as stated and immediately protected in RNAlater (Ambion) before homogenization and RNA extraction using RNeasy® (Qiagen). The RNA concentration was quantified by using NanoDrop® UV spectrometry (NanoDrop Technologies, Wilmington, DE). Two micrograms of RNA were converted into cDNA by using the High Capacity cDNA Archive kit (Applied Biosystems, Carlsbad, CA). Levels of mRNA were measured using TaqMan probes on a 7900HT Fast Real-Time PCR system (Applied Biosystems). The probes used to detect EAAT2, VGLUT3, glucagon (Gcg), GAPDH, and 18 S ribosomal RNA (as controls) were Mm00441457_m1, Mm00805413_m1, Mm01269055_m1, Mm03302249_g1, and Mm03928990_g1, respectively. The data from the 18 S ribosomal RNA probe were used to normalize data from brain samples with liver and pancreas samples, whereas brain and kidney samples were compared using GAPDH. The reason for this is that GAPDH levels are very similar in brain and kidney, and 18 S ribosomal RNA levels are very similar between brain, liver, and whole pancreas.
In Situ Hybridization
Tissue from Sprague-Dawley rats (200–250 g) and C57Bl/6 mice was prepared and sectioned exactly as described before (40). Non-isotopic in situ hybridization was performed using digoxigenin-labeled cRNA probes against rat GLT1 and alkaline phosphatase detection as described (41).
Electrophoresis and Immunoblotting
Tissue was homogenized in 10–20 volumes of ice-cold water. In the case of brain samples, addition of 5 mm EDTA and 1 mm phenylmethanesulfonyl fluoride was sufficient to prevent proteolysis, but in the case of pancreas samples, more inhibitors were added (5 mm EDTA, 1 mm phenylmethanesulfonyl fluoride, 1 mm 4-(2-aminoethyl)benzenesulfonyl fluoride, 0.8 μm aprotinin, 40 μm bestatin, 14 μm N-(trans-epoxysuccinyl)-l-leucine 4-guanidinobutylamide, 20 μm leupeptin, and 15 μm pepstatin A). The homogenate was centrifuged (39,000 × g, 20 min, 4 °C). The supernatants from this centrifugation contained the “water-soluble proteins.” The pellets, containing the water-insoluble proteins (including membrane proteins), were subsequently solubilized in 1% (w/v) SDS in 10 mm sodium phosphate buffer, pH 7.4 (NaPi) and protease inhibitors as above; briefly sonicated; and centrifuged (39,000 × g, 20 min, 15 °C). The supernatants from this last centrifugation are hereafter referred to as “membrane proteins.” The extracts were then subjected to SDS-polyacrylamide gel electrophoresis and immunoblotted as described (42).
Immunocytochemistry
Mice were perfusion-fixed (43) for 5 min with 4% formaldehyde in NaPi with or without 0.1% glutaraldehyde as stated. The relevant tissues were collected and immersed in the same fixative for 30–60 min at room temperature when not stated otherwise. The tissue was then submerged in 11% (w/v) gelatin in 0.1 m sodium phosphate buffer, pH 7.4 at 37 °C for 1 h with occasional gentle shaking to remove air bubbles. The gelatin was hardened by cooling on ice for 10 min. Excess gelatin was cut off, and the block was fixed (1 h) in the same fixative as used for the initial fixation. Sections (40 μm thick) were cut from the fixed unfrozen tissue using a Vibratome 1000 Plus® (Vibratome, Bannockburn, UK) or cryoprotected with sucrose and cut using a Cryotome Microm HM450 (Thermo Fisher Scientific Inc.). Sections were processed for immunoperoxidase labeling exactly as before (for details, see Ref. 42). They were treated with hydrogen peroxide to inactivate endogenous peroxidase, blocked in Tris-buffered saline containing 10% newborn calf serum, and incubated with primary antibodies overnight followed by biotinylated donkey anti-rabbit Ig and streptavidin-biotinylated horseradish peroxidase complex. Triton X-100 was included when not stated otherwise. Immunofluorescent labeling was also done exactly as before (for details, see Ref. 44). Briefly, sections were blocked in Tris-buffered saline with Triton X-100, 10% newborn calf serum, and 3% bovine serum albumin followed by incubation with primary antibodies and finally with secondary antibodies (Alexa Fluor goat anti-mouse 488, Molecular Probes, Eugene, OR) diluted 1:1,000. The sections were observed in a Zeiss Axioplan 2 microscope equipped with a Zeiss LSM 5 Pascal confocal scanner head (Zeiss, Jena, Germany). Pinhole size was around 1 area unit, optimized for each wavelength to ensure confocality. Excitation wavelengths were 488 with corresponding emission wavelengths at 520 nm.
Electron Microscopy and Estimation of Granule Surface Density
Tissue pieces were embedded in Durcupan (45). Ultrathin sections (70 nm) were contrasted by uranyl acetate (1 min) and then by lead citrate (1 min). Micrographs were taken at 6,000× magnification using a Tecnai G2 electron microscope. β-Cells were identified by containing round-oval vesicles with high density material in the center, sometimes with a bar-shaped high density crystal, surrounded by ringlike spaces. From two animals, 20 and 23 randomly selected cross-sections of β-cells, respectively, were analyzed by a computer program (Image Analysis Tool in the electronic notebook database system version 4.5 from Science Linker AS, Oslo, Norway). For each cell profile, the cross-sectional cell area, the number of vesicles seen in that area, and the average vesicle diameter were measured. The surface area density of vesicular membranes for each cell profile was calculated by multiplying the number of vesicles by the average vesicle diameter and by π, dividing by the cross-sectional cell area, and then multiplying that number by 4/π (46). The average number of vesicles/cell volume was calculated by dividing the average total vesicular surface area per cell volume by the average individual vesicle surface area.
Proteome Analysis
Proteomes of total pancreas homogenate were measured similarly to the proteome analysis of isolated pancreatic islets (for details, see Ref. 47). In brief, total pancreas tissue was excised from C57Bl/6J mice. The tissue samples were lysed in ammonium bicarbonate with PPS Silent surfactant (Protein Discovery). After reduction and alkylation, samples were digested overnight by porcine trypsin (Promega). Resulting peptide mixtures were fractionated using peptide isoelectric focusing (Agilent), concentrated on C18 StageTips, and eluted directly before LC-MS/MS measurements. The 12 fractions were measured by nano-LC coupled via a RePlay system (Advion BioSciences; Ref. 48) to an LTQ-Orbitrap mass spectrometer (Thermo Fisher). The RePlay system doubled measuring time per sample, resulting in 4-h data recordings with data-dependently collected MS/MS spectra. Data were analyzed by in-house developed MaxQuant software (97) and searched against a mouse International Protein Index database (v3.37) in Mascot (Matrix Science Ltd.) supplemented with frequently observed contaminants and concatenated with reversed copies of all sequences (2 × 51,467 entries) as described in detail before (47). Proteins were considered identified when at least two peptides were identified of which at least one was uniquely assignable to the respective sequence. The false discovery rates at the peptide level and protein level were set to 1%.
RESULTS
The Consequences of Deletion of EAAT2 in the Brain
The EAAT2-flox × Nestin11-Cre mice were similar to the wild-type mice with respect to general appearance and body weight at birth, but they gained weight slowly (Fig. 2, A and B) and became hyperactive with spontaneous seizures after about 2 weeks. The mortality rate was higher than for wild-type mice after 3 weeks with only 50% survival after 8 weeks (Fig. 2C). The survival was somewhat better than that reported for the conventional EAAT2 knock-out mice (27), but the data do not allow firm conclusions to be drawn as to whether this difference was due to differences in genetic background.
FIGURE 2.
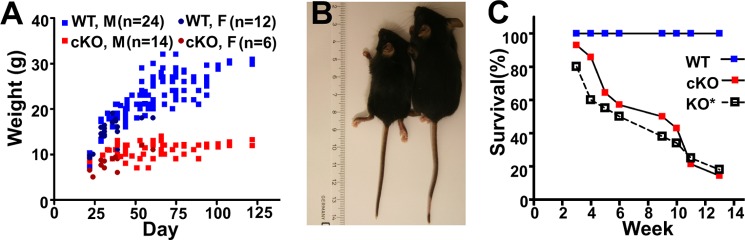
Phenotypes of brain-selective (EAAT2-flox × Nestin11-Cre) conditional knock-out mice. A, the body weights of EAAT2-flox mice (WT; 24 males and 12 females) and their littermates (cKO; 14 males and six females) were measured at different ages. Note that the body weights of the cKO mice stopped increasing after 3 weeks of age. B and C, the wild-type (EAAT2-flox) mice were larger than the brain-selective conditional knock-out mice. This was also apparent from the organs. D, the survival of the cKO mice was poor. The data are from 18 pairs of WT (EAAT2-flox) and cKO (EAAT2-flox × Nestin11-Cre) littermates. Published data (27) on the conventional knock-out (KO*) were plotted for comparison. It is not known whether the difference between the cKO and the KO is real or due to variations in the genetic background.
Deletion of EAAT2 in β-Cells Seemed to Be without Consequences
To investigate the role of EAAT2 in pancreatic β-cells, the EAAT2-flox mice were crossed with RIP-Cre mice. In parallel, EAAT2-flox mice were crossed with IPF1-Cre mice. The fKO allele was neither detectable in the EAAT2-flox mice nor in either of the two Cre lines when tested separately but became detectable in the pancreas when the EAAT2-flox mice were crossed with either of the two Cre lines (Fig. 3A), showing that recombination was occurring when the floxed gene was combined with the Cre gene. Furthermore, immunocytochemistry with antibodies to Cre protein showed that the Cre protein was expressed in nuclei of insulin-positive cells from Cre-positive mice (Fig. 3B). Together this showed that the EAAT2 gene was likely deleted in the majority of β-cells. The percentage of islet nuclei that were Cre-positive in the IPF1-Cre and in the RIP-Cre mice were 68 ± 2.0 and 62 ± 1.5%, respectively, whereas the percentages of insulin-containing cells were 76 ± 2 and 77 ± 0.7% (±S.E.), respectively. Thus, the percentages of insulin-positive cells in islets were within the normal range, and Cre was expressed in most of them. In the case of IPF1-Cre, this implies the entire pancreas because IPF1/PDX1 is initially expressed in the early mouse pancreatic anlagen, although adult expression is more restricted (39, 98). Despite this, the body weights and the general appearance of the conditional knock-out mice were similar to their wild-type littermates (Fig. 3, C and D). More importantly, there were no differences in glucose tolerance (Fig. 3, E and F). The glucose tolerance tests were performed on 5–7-week-old mice to be sure that the mice were old enough to have mature β-cells considering that β-cells mature slowly (28). Because EAAT2 has been suggested to protect against glutamate-induced β-cell death (23), the percentages of islet cells that were positive for insulin were also counted, but no differences were found between EAAT2-flox mice and conditional knock-out mice (Fig. 3, G and H).
FIGURE 3.

Characterization of EAAT2-flox mice crossed with Cre lines (RIP-Cre and IPF1-Cre) causing pancreas-selective excision. A, PCR of genomic DNA of the pancreas from homozygote (f/f) EAAT2-flox without (cre−) or with (cre+) either RIP-Cre or IPF1-Cre as indicated. Note that the fKO allele becomes detectable when Cre is present. This shows that the recombination indeed takes place. B, confocal microscopy images of pancreas sections from WT (EAAT2-flox) or cKO (either EAAT2-flox × RIP-Cre or EAAT2-flox × IPF1-Cre as indicated) labeled with antibodies either to Cre (green; 1:200) or to insulin (green; 1:500) as indicated. Note the multiple Cre-positive nuclei (panels f, j, h, and l). Arrows in f and g point to a few of them. The sections were mounted in a DAPI-containing medium to visualize cell nuclei (blue). Note that insulin was readily detectable in all sections (panels a–d), whereas Cre was only detectable in islet cells in Cre-positive (cKO) mice (panels j and i), attesting to the specificity of the antibodies. Panels e, f, g and h are merged images showing both DAPI and Cre. Panels i and j are merged to give f, and k and l are merged to give h. Also note that EAAT2 was present in the brains of both WT and cKO mice (panels m–p) as indicated. Immunoperoxidase labeling of parasagittal brain sections was carried out with anti-B563 (Ab355; 0.1 μg/ml) antibody to the C terminus of EAAT2. Scale bars, 20 μm (pancreas) and 2 mm (brain). C and D, body weights of EAAT2-flox mice (WT) and cKO mice as indicated. The mice in C were 6–7 weeks old, whereas those in D were 5–6 weeks old (M, male; F, female). E and F, glucose tolerance tests of the male WT and cKO from RIP-Cre (E) and IPF1-Cre (F). Note that WT (EAAT2-flox) and cKO have similar glucose tolerance. G and H, the percentages of insulin-positive cells in the islet were the same in EAAT2-flox mice (WT) and their cKO littermates. Error bars, S.E.
EAAT2 mRNA Is Present at Low Levels, and It Is Not Concentrated at Pancreas Islets
The lack of effect of deleting EAAT2 in β-cells needed an explanation. TaqMan real time PCR was used to measure the levels of mRNAs encoding EAAT2 in brain regions, liver, kidney, and pancreas. As shown (Fig. 4A), the levels of EAAT2 mRNA in the liver, kidney, and pancreas were about 10, 200, and 4000 times lower, respectively, than in the hippocampus. Considering that brain EAAT2 levels are high (49) and that β-cells only represent about 1% of the total pancreatic tissue, it was still possible that β-cells could contain physiologically relevant levels of EAAT2 if concentrated in the β-cells. Therefore, an attempt to localize the mRNA by in situ hybridization was made. In agreement with previous experiments (41), brain tissue was strongly labeled (data not shown), but the signal over pancreas was weak with similar intensities over the exocrine and the endocrine portions of pancreas (data not shown). Because the labeling was close to background, firm conclusions could not be made as to whether the observed labeling in the pancreas indeed represented EAAT2 or unspecific labeling. Instead, we collected tiny pieces of tissue at random from different parts of pancreas. The pieces were so small that some of them would be expected to be devoid of islets, whereas others would represent tissue enriched in islets. Then TaqMan real time PCR was performed using primers for EAAT2, glucagon, and VGLUT3. The data from each sample were sorted according to the glucagon values (Fig. 4B). If EAAT2 and VGLUT3 were concentrated in the islets, then EAAT2 and VGLUT3 mRNAs would be expected to correlate with glucagon mRNA (and thus be highest in the samples containing the most islet tissue). This, however, did not turn out to be the case, suggesting that EAAT2 was expressed independently of the islets and thereby also expressed in the exocrine pancreas. It should also be noted that the levels of VGLUT3 mRNA in the pancreas were as low as those of glucagon in the hippocampus, suggesting that it is not really expressed.
FIGURE 4.
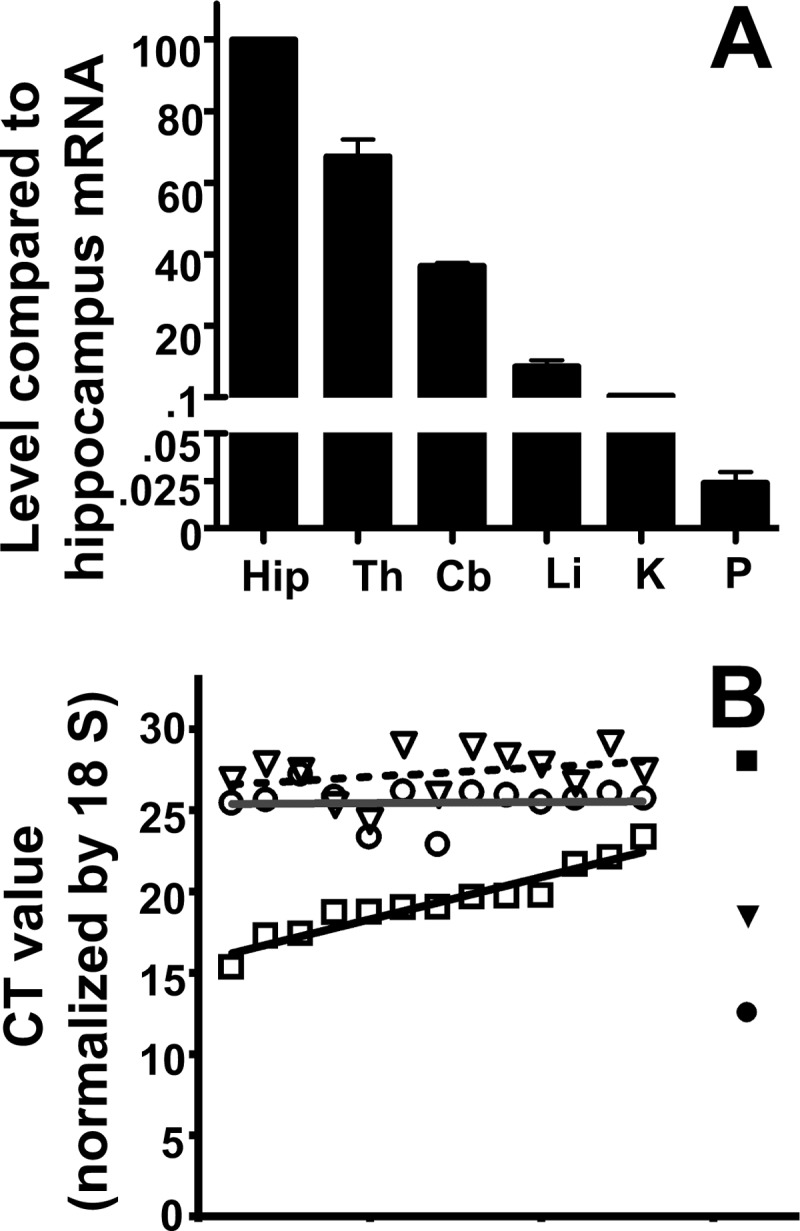
The levels of EAAT2 and VGLUT3 mRNAs are very low. A, TaqMan real time PCR was used to compare the levels of EAAT2 mRNA in brain regions (Hip, hippocampus; Th, thalamus; Cb, cerebellum) with those in liver (Li), kidney (K), and whole pancreas (P). The tissues were collected from three 6–9-week-old mice. Data were normalized to 18 S mRNA levels determined by RT-PCR. Note that the EAAT2 mRNA levels in the liver and in the whole pancreas were 10 and 4000 times lower, respectively, than in the hippocampus. B, multiple small pieces (less than 1 mg) of pancreatic tissue were collected from the body of pancreas. The levels of mRNAs encoding VGLUT3 (open triangles), EAAT2 (open circles), and glucagon (open squares) were determined, and the data (cycle threshold (CT) values) were sorted and plotted according to glucagon levels. Consequently, the graph shows increasing glucagon levels. Hippocampus was used as a control (solid symbols). Note that the EAAT2 levels in the pancreas did not correlate with the glucagon levels (the line is horizontal). Also note that the cycle threshold values for VGLUT3 in the pancreas are similar to those of glucagon in the hippocampus, indicating that VGLUT3 is close to transcription background (higher cycle threshold values means lower mRNA levels as the cycle threshold values represent the number of PCR cycles needed to reach the detection threshold). The tissues were collected from 6–7-week-old mice. The data are from two independent experiments.
EAAT2 Protein Was Not Detected in the Pancreas
Brain EAAT2 from adult wild-type mice was detectable by immunoblotting even when diluted 1:1,000 with proteins from the conventional EAAT2 knock-out mice (Fig. 5A). EAAT2 was also detectable in liver extracts, but it was not detected in the membrane fraction from pancreas (Fig. 5A). In contrast, water-soluble proteins from pancreas gave a weak reaction with both EAAT2 antibodies (Fig. 5B) and normal preimmune IgG (Fig. 5C). In the absence of good negative controls (tissue from knock-out mice), it would be easy to misinterpret this labeling as EAAT2 labeling. The facts that this labeling was not seen in the membrane fraction and that it was present in extracts from the conventional EAAT2 knock-out mice prove that it was not due to EAAT2. As we have noted before, reaction with seemingly unrelated proteins is a common problem and something that it is hard to control for without access to tissue from knock-out animals (50, 51). Immunohistochemistry on tissue sections was then performed using our array of different EAAT2 antibodies (some of which are listed in Table 2). All experiments included sections of brains from both wild-type and conventional knock-out mice as positive and negative controls, respectively. The antibodies were tested at several different concentrations. The data shown here are those obtained when the antibody concentrations were so high that the antibodies started to give rise to background labeling in sections from the knock-out mice. Despite these high antibody concentrations and the fact that a number of different fixation and staining protocols were tried, EAAT2 could not be detected in the islets (Fig. 6) or in the kidneys (not shown). Mice of different ages were used (3 weeks (Fig. 6A) and 3 months old (Fig. 6B)). Too strong fixation can reduce sensitivity, but the sections shown here (Fig. 6) were from tissue that had only been fixed for 1 h. However, the fixation was sufficiently strong to prevent loss of secretory granules because insulin was still present. It was noted that some of the antibodies cross-reacted with non-EAAT2 molecules in the islets (e.g. Ab95 and Ab63) and that the NCL-EAAT2 antibody cross-reacted mostly with epitopes in the exocrine pancreas (Fig. 6C). At higher antibody concentrations, a variety of different labeling patterns could be seen with the different antibodies, but this labeling was interpreted as cross-reactivity because no convincing differences between wild-type and knock-out mice could be demonstrated (data not shown, but see Ref. 51). Immunofluorescence and confocal microscopy are more sensitive but also resulted in variable labeling in both wild-type and EAAT2 knock-out mice (not shown).
FIGURE 5.

Western blots show that there is very little, if any, EAAT2 protein in pancreas. A, EAAT2 protein is detectable by immunoblotting in brain and liver but not in pancreas (P). Various tissues from a 50-day-old (50d) male WT mouse and from 23-day-old (23d) conventional EAAT2 KO and WT littermates were collected, homogenized in water with protease inhibitors (see “Experimental Procedures”), and centrifuged. The pellets (the water-insoluble fraction containing cell membranes) were extracted with SDS. The WT forebrain extract (50 days old) was diluted 300 or 1,000 times as indicated in the KO forebrain extract. Note that EAAT2 is detectable in the diluted WT brain extracts and in the WT liver extracts (both 23 and 50 days old) but not in the extracts from pancreas (50 days old) or in the KO liver extract. The band representing EAAT2 is the one just above the 66-kDa marker, whereas the strong 45-kDa band seen in the brain samples is due to a cross-reacting compound. The latter is strong relative to EAAT2 because it is present in both the WT and the KO extract and thereby not diluted like EAAT2. The total protein loaded in each lane was 30 μg. The blot was developed with EAAT2 anti-B12 antibodies (Ab360; 0.2 μg/ml). B, pancreas contains water-soluble proteins that bind the antibodies, and these unidentified proteins have a molecular mass similar to that of EAAT2. Pancreas from a 50-day-old WT mouse was homogenized in water with protease inhibitors (see “Experimental Procedures”) and centrifuged to separate the water-soluble (S) proteins from the membrane fraction (M). Note that there is no labeling in the lane containing the pancreas membrane fraction. All of the labeling is due to the water-soluble components. In agreement, there is similar labeling when whole pancreas (50-day-old WT, 23-day-old WT, and 23-day-old KO) were directly solubilized in SDS. The membrane fraction from WT forebrain (50 days old) diluted 1:100 with KO forebrain extract (B) was used as a positive control (the lanes on each side of the blot as indicated). Note that the 66-kDa band representing EAAT2 is stronger relative to the cross-reacting 45-kDa band than in A due to less dilution. The blot was developed with EAAT2 anti-B12 antibodies (Ab360; 0.2 μg/ml). C, a blot identical to that in B was developed with normal (preimmune) IgG (0.2 μg/ml). Note that the extracts from whole pancreas and from the water-soluble fraction contain proteins that tend to bind IgG in general. In particular, there is weak labeling of a band that can easily be mistaken for EAAT2 when high sensitivity detection systems are used. DF, dye front.
FIGURE 6.

EAAT2 was neither detectable in islets from 3-week-old mice nor from 3-month-old mice with standard immunoperoxidase technique. A and C, brain and pancreas sections from 3-week (3 w)-old conventional EAAT2 KO (27) mice and their WT littermates were labeled with eight different anti-EAAT2 antibodies (Table 2) as indicated. The brain sections were developed together with the pancreas sections as positive and negative controls, respectively. Anti-insulin antibodies were used as a positive control for islets. Note that there were no differences between the WT and KO mice. B, similar labeling experiments were also done using the same antibodies and pancreas sections from 3-month (3 mon)-old mice (WT). Tissue from both cKO (IPF1-Cre and RIP-Cre as indicated) and conventional KOs were included as negative controls. Note that EAAT2 was also undetectable in islets at 3 months. Scale bars, 2 mm (brain) and 50 μm (pancreas).
The Number of Secretory Granules in β-Cells Is High
How many EAAT2 and VGLUT3 molecules would be expected if these proteins were localized to secretory granules as suggested (26)? To answer this question, we determined the average granular surface area per β-cell volume in two wild-type C57Bl/6 mice (Fig. 7). The average surface densities were 3 ± 0.2 and 4 ± 0.3 μm2/μm3 (average ± S.E. for each mouse). The average granule diameter was 0.26 μm in both animals. From this, it could be calculated that the average numbers of granules per β-cell volume were 14 and 19/μm3, respectively. This is in good agreement with previous estimates of nine granules per μm3 and a mean granular volume of 0.012 μm3 (52), implying a mean granular membrane density of 2.2 μm2/μm3. A new study based on cultured rat islets and using high pressure freezing (53) showed that chemical fixation leads to an overestimation of granule size and number, and it was concluded that there are around seven granules and about 1.5 μm2 granule membranes per μm3 β-cell volume. Thus, these studies are in good agreement considering the methodological differences. The large number of granules explains why granule-associated proteins (e.g. zinc transporter 8; Slc30a8) are expressed at such high levels (see below). Interestingly, the density of granule membrane in β-cells is about the same as that of astroglial plasma membranes in the hippocampus (young adult rats, stratum radiatum, CA1; Ref. 49).
FIGURE 7.

A, electron micrograph from a wild-type mouse islet showing a β-cell containing secretory granules (g). Mitochondria (m) and nucleus (Nu) are indicated. B, higher magnification of granular vesicles. Mice (6–10 weeks old) were perfusion-fixed with 1.5% formaldehyde and 2.5% glutaraldehyde in 0.1 m sodium phosphate buffer, pH 7.4. Scale bar, 2 μm.
Proteome Analysis
Using in-depth proteomic analyses (47) of purified mouse islets of Langerhans and of entire pancreatic tissue, we detected about 7,000 proteins. Some of these are listed in Tables 3 and 4. The entire proteome list is available in supplemental Table S1.
TABLE 3.
Relative protein levels in mouse (C57Bl6/J) pancreas
Insulin and glucagon were among the most abundant proteins in mouse islets as expected considering that the main function of the islets is to secrete these hormones. Proteins involved in exocytosis (e.g. RAB27A) and in the filling of granules with zinc (the vesicular zinc transporter ZnT8) were also found at high levels in islets in agreement with the high number of secretory granules. Note that ASCT2 (Slc1a5) was detected in both islets and whole pancreas and that ASCT1 (Slc1a4) was detected in whole pancreas, whereas the other members of the same protein family (EAAT1–5) were not. Also note that the VGLUT1–3 and GABA (VGAT) transporters were below the detection limit. In contrast, both glutamine transporters (Slc38a2 and -3), mitochondrial glutamate carriers (AGC1, aralar1; AGC2, citrin; and GC1), and enzymes involved in glutamate metabolism (Glud1, Glul, and Gs2) were detected. Peptide numbers in the last columns indicate the maximum number of different peptides identified in one sample and indicate another rough estimate of relative protein quantities (this number does not preclude the presence of multiple peptide forms like charge states, modifications, etc.). The complete proteome list is available in supplemental Table S1. ND, not detected; iso, isoform.
| Protein name | Islets |
Whole pancreas |
Ratio islet/pancreas | No. of peptides |
|||
|---|---|---|---|---|---|---|---|
| Rank | Intensity | Rank | Intensity | Islet | Pancreas | ||
| Insulin1 | 3 | 1.22E + 08 | 459 | 1.89E + 06 | 64a | 5 | 2 |
| Glucagon | 5 | 1.06E + 08 | 537 | 1.49E + 06 | 71a | 18 | 6 |
| Insulin2 | 6 | 8.02E + 07 | 613 | 1.26E + 06 | 64a | 7 | 4 |
| RAB27A | 150 | 1.13E + 07 | 918 | 6.28E + 05 | 18a | 30 | 16 |
| Got2 | 226 | 7.65E + 06 | 371 | 2.55E + 06 | 3.0 | 25 | 18 |
| AGC1 (Slc25a12) | 256 | 6.86E + 06 | 888 | 6.56E + 05 | 10.5a | 35 | 18 |
| Glud1 | 308 | 5.28E + 06 | 271 | 4.01E + 06 | 1.3 | 27 | 26 |
| Got1 | 473 | 3.10E + 06 | 394 | 2.31E + 06 | 1.3 | 22 | 19 |
| Pycr2 | 570 | 2.45E + 06 | 570 | 1.39E + 06 | 1.8 | 14 | 13 |
| Glul | 760 | 1.62E + 06 | 3288 | 2.34E + 04 | 69a | 15 | 3 |
| ZnT8 (Slc30a8) | 768 | 1.59E + 06 | 4975 | 1.91E + 03 | >100a | 8 | 1 |
| GC1 (Slc25a22) | 1217 | 6.51E + 05 | 2476 | 5.92E + 04 | 11.0 | 12 | 4 |
| GLUT2 (Slc2a2) | 1352 | 5.19E + 05 | ND | ND | 8 | ||
| AGC2 (Slc25a13) | 1366 | 5.03E + 05 | 1575 | 2.00E + 05 | 2.5 ns | 18 | 13 |
| ZnT7 (Slc30a7) | 1377 | 4.98E + 05 | 4034 | 1.02E + 04 | 48.8 | 8 | 3 |
| Slc7a14 | 1444 | 4.58E + 05 | ND | ND | |||
| MCT10 (Slc16a10) | 1721 | 3.00E + 05 | 5354 | 1.64E + 02 | >100a | 6 | 2 |
| Aldh4a1 | 1770 | 2.85E + 05 | 1396 | 2.68E + 05 | 1.1 | 2 | 2 |
| Slc38a10 | 1938 | 2.30E + 05 | 3774 | 1.35E + 04 | 17.1 | 18 | 3 |
| SNAP25 | 2420 | 1.29E + 05 | ND | ND | 3 | ||
| ZnT6 (Slc30a6) | 2685 | 9.79E + 04 | 2879 | 3.70E + 04 | 2.64 | 3 | 2 |
| PAT1 (Slc36a1) | 2690 | 9.71E + 04 | ND | ND | 2 | ||
| SNAT2 (Slc38a2) | 3054 | 6.79E + 04 | 1904 | 1.23E + 05 | 0.55 | 2 | 3 |
| SNAT3 (Slc38a3) | 3124 | 6.35E + 04 | 1333 | 2.93E + 05 | 0.22a | 3 | 3 |
| SNAT5 (Slc38a5) iso1 | 3840 | 3.34E + 04 | 1106 | 4.25E + 05 | 0.08a | 4 | 7 |
| ASCT2 (Slc1a5) | 3956 | 2.90E + 04 | 2193 | 8.35E + 04 | 0.35 | 3 | 4 |
| SNAT4 (Slc38a4) | 4120 | 2.47E + 04 | ND | ND | 4 | ||
| NTT4 (Slc6a17) | 4250 | 2.22E + 04 | ND | ND | |||
| TAUT (Slc6a6) | 4991 | 1.01E + 04 | ND | ND | 2 | ||
| GLYT1 (Slc6a9) | 5179 | 8.78E + 03 | 2395 | 6.43E + 04 | 0.14a | 3 | 3 |
| Gls2 | 5335 | 7.35E + 03 | 2601 | 4.96E + 04 | 0.15a | 5 | 13 |
| MCT1 (Slc16a1) | 5732 | 4.40E + 03 | 4502 | 5.31E + 03 | 0.83 | 3 | 2 |
| ASCT1 (Slc1a4) | ND | ND | 3746 | 1.39E + 04 | 2 | ||
| SNAT5 (Slc38a5) iso2 | ND | ND | 4622 | 4.40E + 03 | 1 | ||
| Gls1 | ND | ND | ND | ND | |||
| VGLUT1 (Slc17a7) | ND | ND | ND | ND | |||
| VGLUT2 (Slc17a6) | ND | ND | ND | ND | |||
| VGLUT3 (Slc17a8) | ND | ND | ND | ND | |||
| EAAT1 (Slc1a3) | ND | ND | ND | ND | |||
| EAAT2 (Slc1a2) | ND | ND | ND | ND | |||
| EAAT3 (Slc1a1) | ND | ND | ND | ND | |||
| EAAT4 (Slc1a6) | ND | ND | ND | ND | |||
| EAAT5 (Slc1a7) | ND | ND | ND | ND | |||
| GAT3 (Slc6a11) | ND | ND | ND | ND | |||
| GLYT2 (Slc6a5) | ND | ND | ND | ND | |||
| VGAT (Slc32a1) | ND | ND | ND | ND | |||
| xCT (Slc7a11) | ND | ND | ND | ND | |||
a Indicates significant expression differences when comparing exclusively shared peptides.
TABLE 4.
Amino acid transporters at the plasma membranes in islet cells
The transporters are sorted according to decreasing expression levels. Essential amino acids are indicated in bold. l-dopa, l-3,4-dihydroxyphenylalanine; CIP, cation-chloride cotransporter interaction protein; T3, triiodothyronine; T4, thyroxine.
| Rank | Gene | Name | Substrates |
|---|---|---|---|
| 1721 | Slc16a10 | MCT10 (aromatic amino acid transporter1) | Phe, Tyr, Trp, T3, T4 (84) |
| 1753 | Slc7a2 | CAT-2 (cationic amino acid transporter, y + system) | Lys, Arg, ornithine (85, 86) |
| 1938 | Slc38a10 | Putative sodium-coupled neutral amino acid transporter | Unknown |
| 2488 | Slc7a5 | LAT1 (amino acid transporter light chain, L system) | His, Met, Leu, Ile, Val, Phe, Trp, Tyr, T3, T4, l-dopa (85, 86) |
| 2690 | Slc36a1 | PAT1 (proton-coupled amino acid transporter 1) | Gly, Pro, Ala, GABA, butyrate, acetate, propionate (82) |
| 2700 | Slc7a8 | LAT2 (amino acid transporter light chain, L system) | All neutral amino acids except Pro (85, 86) |
| 3054 | Slc38a2 | SNAT2 (system A amino acid transporter 2) | Ala, Cys, Ser, Gln, Asn, His, Pro, Met (81) |
| 3124 | Slc38a3 | SNAT3 (system N amino acid transporter 1) | Gln, Asn, His (81) |
| 3840 | Slc38a5 | SNAT5 (system N amino acid transporter 2) | Gln, His, Asn, Ser, Ala (81) |
| 3956 | Slc1a5 | ASCT2 (neutral amino acid transporter) | Ala, Ser, Cys, Thr, Gln (80) |
| 4120 | Slc38a4 | SNAT4 (system A amino acid transporter 3) | Gly, Ala, Cys, Ser, Asn, Met, Thr (81) |
| 4178 | Slc12a9 | CCC6 (CIP; potassium/chloride transporters) | Polyamines, amino acids |
| 4821 | Slc7a1 | CAT-1 (cationic amino acid transporter, y + system) | Lys, Arg, ornithine (85, 86) |
| 4991 | Slc6a6 | TAUT (taurine transporter) | Taurine, β-alanine (87) |
| 5179 | Slc6a9 | GLYT1 (glycine transporter 1) | Gly |
| 6136 | Slc7a6 | y + LAT2 (amino acid transporter, y + L system) | Lys, Arg, Gln, His, Met, Leu (85, 86) |
The 15 most abundant proteins in islets were histones (H4, H2, and H3), insulin (1 and 2), glucagon, β-globin, colipase precursor, two lipases (Cel and Pnlip), nucleoside-diphosphate kinase (Nme2), α-globin (Hbat1), and two 40 S ribosomal protein (Rps3 and Rps27a). The 15 most abundant proteins in whole pancreas were amylase 2, α-globin, β-globin, histones (H4 and H2B), proteases (trypsin, carboxypeptidase B1, chymotrypsinogen B, elastase-1, elastase-2A, and carboxypeptidase A1), pancreatic ribonuclease, nucleoside-diphosphate kinase, an uncharacterized protein, and chymotrypsin-like protein.
The proteins identified included more than 100 different solute carrier (Slc) proteins in islets (supplemental Tables S1 and S2) and more than 80 in whole pancreas (supplemental Table S1). The transporters identified in islets comprised 29 members of mitochondrial transporter family (Slc25). The 20 most abundantly expressed transporters in islets included 12 of the Slc25 proteins (including three mitochondrial glutamate transporters: Slc25a12, Slc25a13, and Slc25a22), two zinc transporters (ZnT8 and ZnT7), a glucose transporter (GLUT2), an aromatic amino acid transporter (Mct10), two cationic amino acid transporters (Slc7a2 and Slc7a14), and a putative sodium-coupled neutral amino acid transporter (Slc38a10) as well as the 4F2 (CD98; Slc3a2) heavy chain that forms a heterodimer with Slc7-type transporters (54). A total of seven Slc7 members were identified in islets, including two with affinity for leucine (LAT1; Slc7a5 and LAT2; Slc7a8), but the two members that transport glutamate (xCT; Slc7a11 and AGT1; Slc7a13) were not detected. Furthermore, eight members of the nucleoside transporter family (Slc35) and several transporters for sodium, potassium, chloride, and zinc (members of the Slc4, Slc9, Slc12, and Slc39 families) were identified. Despite this, none of the glutamate (excitatory amino acid) transporters (Slc1a1, Slc1a2, Slc1a3, Slc1a6, and Slc1a7) and none of the transporters in the dicarboxylate transporter family (Slc13) were identified in islets or in whole pancreas. This is unlikely to be a methodological problem because transporters for neutral amino acids (Slc1a4 and Slc1a5) belonging to the Slc1 family were detected, and all of these seven proteins have a very similar protein structure and size. The taurine transporter TauT (Slc6a6), a vesicular transporter of neutral amino acids (Slc6a17; Refs. 55 and 56), and the glycine transporter GLYT1 (Slc6a9) were detected in islets, but none of the other members of the Slc6 family (e.g. GAT3; Slc6a11) were detected. GLYT1 was the only Slc6 family member detected in the exocrine pancreas, and the levels of GLYT1 there were 7 times higher than in islets. Furthermore, none of the members of the Slc17 and Slc32 families (comprising the VGLUTs and the vesicular GABA transporter) were detected (either in islet or in whole pancreas). Failure to detect the VGLUTs is also significant considering that other granule-associated proteins (e.g. ZnT8 and several vacuolar proton pumps) and proteins involved in exocytosis (e.g. Rab27a, Rab3a, Vamp2, Syn2, Syn1, and Snap25) were among those detected at highest levels (Table 3 and supplemental Table S1). ZnT8 is selectively expressed in islets as shown here and by others (57).
Glutamate-associated enzymes were also abundantly expressed in islets (Table 3 and supplemental Table S1). The most abundant were two aspartate aminotransferases (Got1 (cytoplasmic) and Got2 (mitochondrial)), glutamate dehydrogenase (Glud), pyrroline-5-carboxylate reductase 2 (Pycr2), and glutamine synthetase (Glul). In contrast to the former four, glutamine synthetase was virtually selective for islets. This finding was confirmed by immunocytochemistry (Fig. 8). However, the glutamine synthetase levels varied greatly between cells. Another striking finding was that the highest levels of glutaminase 2 (Gls2) were found in whole pancreas and that the levels in islets were about 200 times lower than those of glutamine synthetase. Glutaminase 1 (Gls1) was not detected. In agreement with others (5), we found (supplemental Table S1) high levels of pyruvate carboxylase and dehydrogenase. Furthermore, we detected the mitochondrial, but not the cytosolic, phosphoenolpyruvate carboxykinase. Fructose-1,6-bisphosphatase 1, however, was detected in islets at moderate levels. Also, a number of enzymes for branched-chain amino acid metabolism (e.g. Dbt, Bcat2, Acadsb, Bckdha, Bckdhb, and Bckdk) were detected at high levels (supplemental Table S1).
FIGURE 8.
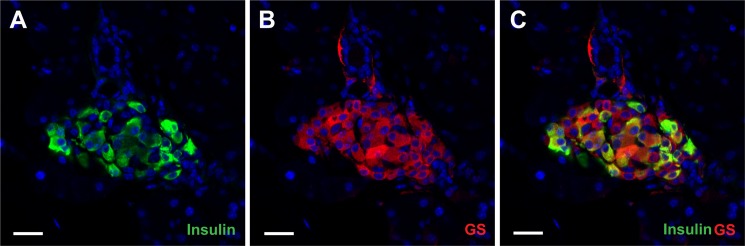
Confocal images show glutamine synthethase (GS; red; B) and insulin (green; A) distributions in young adult mouse pancreas. C is a merged image showing both glutamine synthethase and insulin. The islets were strongly labeled with anti-glutamine synthethase antibodies (Sigma G2781; 1:1,000), whereas the exocrine pancreas was virtually unlabeled in agreement with the proteome data (Table 3). Within islets the glutamine synthethase labeling was not restricted to one cell type as glutamine synthethase immunoreactivity was prominent in both insulin-positive and insulin-negative cells (anti-insulin antibody, Sigma I2018; 1:500). Furthermore, the intensity of the glutamine synthethase labeled was highly variable. Scale bar, 20 μm.
These data are also in good agreement with the microarray data from others (Fig. 9), but some differences were noted (e.g. ASCT1, SNAT3, and Gls1). Another proteome data set (58) from mouse and human islets was also analyzed (not shown). This data set contained fewer proteins, but the data are nevertheless in good agreement with our data set. EAAT2 and VGLUT3 proteins were not detected even though a number of other solute carriers were.
FIGURE 9.
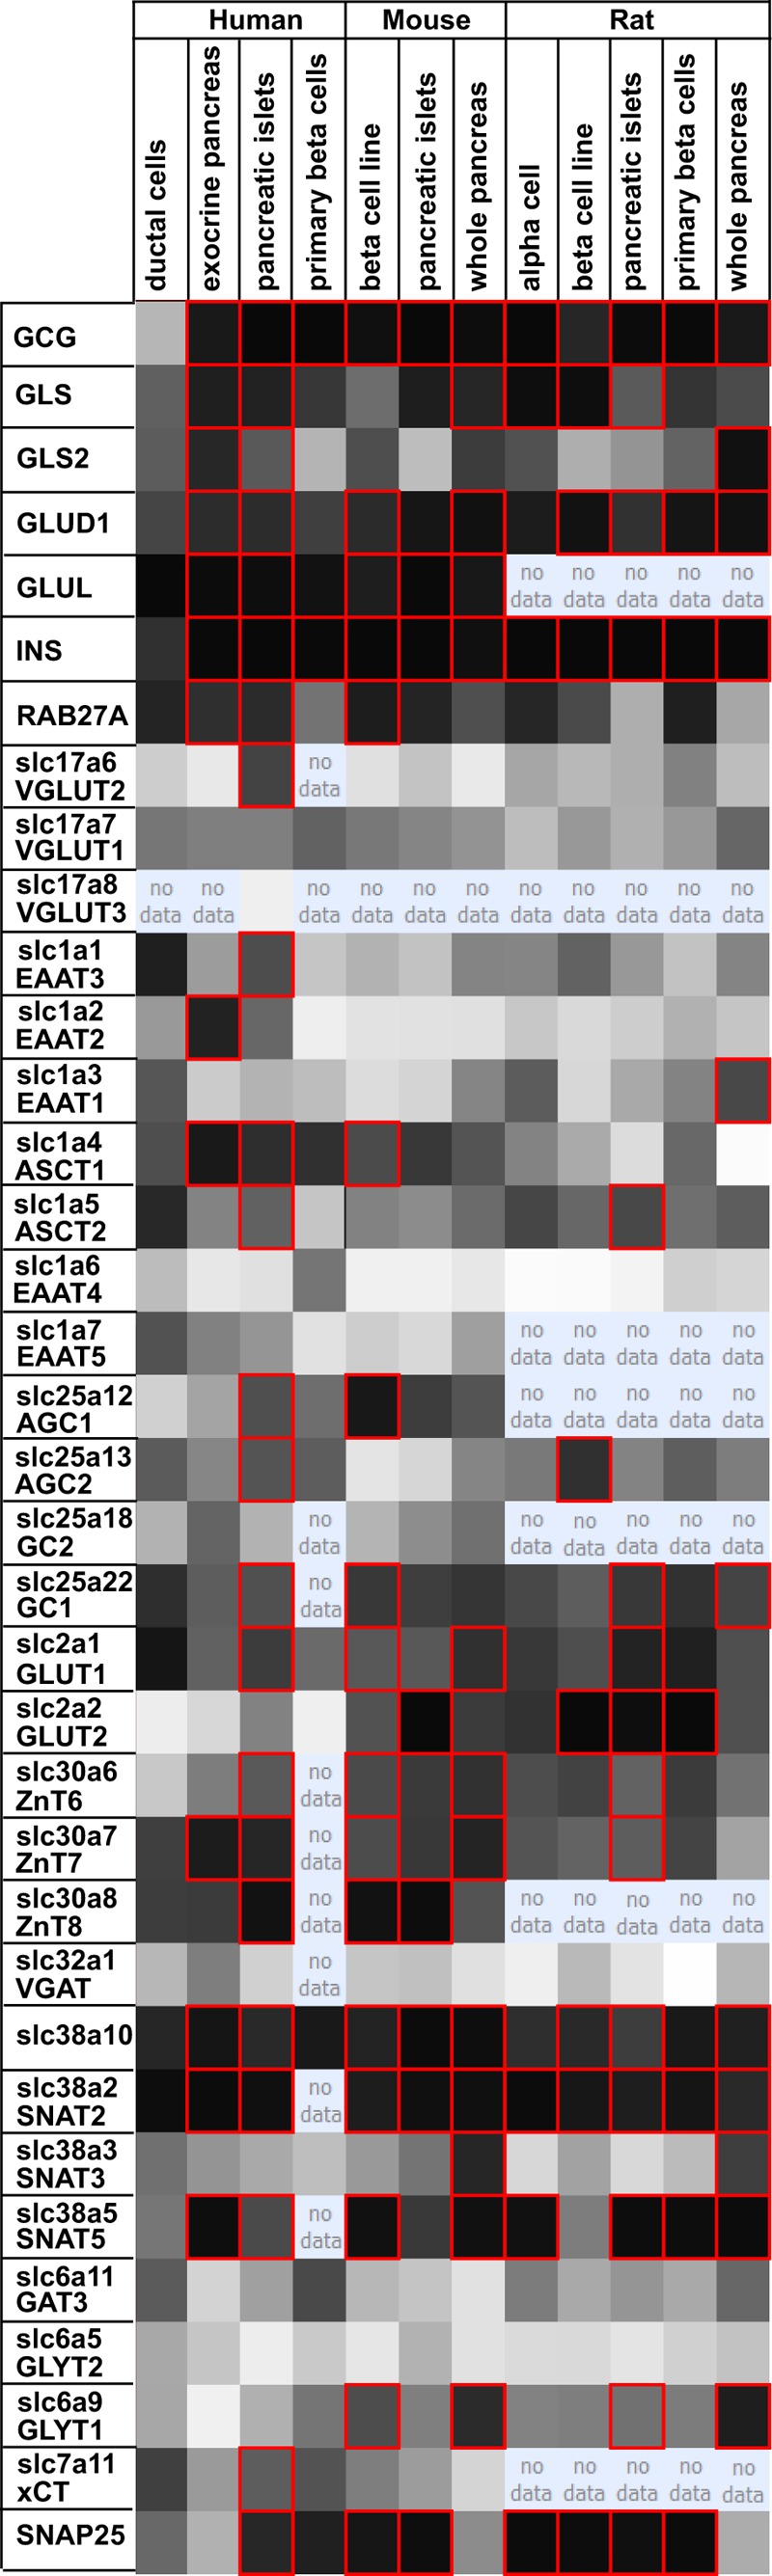
Transcriptome data do not support the notion that glutamate transporters are concentrated in islets. The figure shows a screen shot from the Beta Cell Gene Atlas (90), which contains data on basal expression of genes in different β-cell sources (pancreatic β-cells, islets, whole pancreas, and β-cell lines) from human, mouse, and rat. This database was searched for expression levels of some neurotransmitter transporters previously reported to be enriched in islets and compared with glucose transporters (GLUT1 and GLUT2) and proteins involved in exocytosis (e.g. Rab27) as well as three enzymes involved in glutamate metabolism (GLS, glutaminase; GLUD1, glutamate dehydrogenase; GLUL, glutamine synthetase). Glucagon (gcg) and insulin (INS) are shown for comparison. The latter are expressed at such high levels that they are detected in all samples due to contamination. The darker the cell color, the higher the expression levels. Genes expressed with a probability score of 0.95 or higher are designated with a red border. The column “human pancreatic islet massively parallel signature sequencing” is not shown as it did not contain data on the transcripts that were the focus of this study.
DISCUSSION
EAAT2 Is Essential for the Functioning of the Nervous System
It has been assumed, but never directly shown, that the phenotype of the conventional EAAT2 knock-out mice (27, 59) is due to loss of EAAT2 from the brain. Here we show that Nestin11-Cre-directed deletion of EAAT2 is sufficient to reproduce this phenotype. Nestin11-Cre was suitable to distinguish between the roles of EAAT2 in the nervous system and in peripheral organs because nervous tissue is the only tissue where both EAAT2 and Nestin11-Cre are expressed (see “Experimental Procedures”). Peripheral expression of EAAT2 is limited to glandular tissue (including mammary gland, lacrimal gland, and ducts and acini of the salivary glands; Ref. 40) and perivenous hepatocytes (40, 60). Thus, this confirms the prevailing view that the main roles of EAAT2 are in the brain (for reviews, see Refs. 19, 61, and 62).
Neurotransmitter Transporters Are Hardly Expressed in Islets
It is possible to detect neurotransporter mRNAs, including that of EAAT2, in islets (Fig. 9), but the expression levels are much lower than those in the brain. This conclusion is also in agreement with other data sets (63). A third data set (29) based on microarray analysis of rat β-cells excised using laser capture microdissection is also available. The latter data set suggests low level expression in the neonatal pancreas and reduced expression toward adulthood.
Furthermore, the presence of mRNA does not imply that the proteins have to be produced. The proteome data sets provided here and data sets already published (47, 58) show that both EAAT-type and the VGLUT-type proteins must be expressed at very low levels if present at all. This argues against targeting to secretory granules because there are so many granules that proteins expressed in the majority of them will have to be abundant. This argument explains why granule-associated proteins are expressed at such high levels, e.g. ZnT8, which is indispensable for zinc-insulin crystal formation (64). The only vesicular transporter detected was Slc6a17 (RxT; NTT4) which transports proline, glycine, leucine, and alanine (55, 56), but it is not known in which of the islet cell types it is expressed.
Considering that EAAT2 is expressed at low levels in glandular tissue (including mammary gland, lacrimal gland, and ducts and acini of the salivary glands; Ref. 40), a low level of expression in the exocrine pancreas would not be surprising in agreement with Meabon et al. (10). This appears to be the case in man where EAAT2 is significantly expressed in the exocrine parts (Fig. 9). The level in human islets (Fig. 9) is lower and may in part be due to contamination from the exocrine tissue. The mRNA levels for EAAT1 and EAAT3 are also low but possibly slightly higher than those of EAAT2 in mice and rats (Fig. 9).
Too Few Glutamate Transporters to Control the Extracellular Environment
Such low numbers of transporter molecules in islets are unlikely to influence the glutamate concentration in the interstitial fluid surrounding islet cells either by uptake or by release because the blood flow per tissue volume through the islets is high and the capillaries are fenestrated, allowing hormones as well as amino acids and monosaccharides to diffuse freely (65). The glutamate concentration around islet cells, therefore, is likely to reflect the plasma concentration. Furthermore, EAAT-type transporters would not be optimal for this task because the Km values (19) are so low that they would already be working at Vmax at normal plasma levels of glutamate (66–68), thereby leaving no reserve capacity.
The Disagreements with Respect to Localization Are Likely Due to Artifacts
The data shown here imply that very high sensitivity would be needed for detection of the EAAT-type transporters as well as VGLUTs. Consequently, specificity is a major challenge. Using a panel of different EAAT2 antibodies, we were able to obtain labeling similar to that reported by others (see Table 1). Some antibodies gave plasma membrane labeling, whereas others gave intracellular labeling when used in high concentrations. However, we were unable to obtain labeling that was convincingly different in wild-type and knock-out mice. A complicating factor is that there was considerable variation in labeling intensity between islets in both knock-out and wild-type mice, implying that sampling errors can easily influence the conclusions. The data presented here also cast doubt over other immunocytochemical studies that have described GAT3, GLYT2, VGAT, and other neurotransmitter transporters in islets. The present study also illustrates the advantage of having access to multiple antibodies, the importance of using knock-out animals as negative controls, the importance of combining several different methods, and the importance of performing quantitative considerations (for a discussion about validation of immunocytochemical labeling, see Refs. 51 and 69). For instance, if postembedding immunogold labeling (for method description, see Ref. 43) is specific and results in several gold particles per micrometer of granule membrane length as reported (26), thereby approaching labeling intensities obtained along astrocyte membranes in the brain (70, 71), then difficulties in detecting EAAT2 by immunoperoxidase or in situ hybridization in β-cells in tissue sections would be unexpected considering the similar densities of membranes per volume of tissue and the extremely high EAAT2 levels in the brain (49). As pointed out previously, cross-reactivity with unrelated proteins is a common problem (50, 51, 72, 73). This may very well be a problem in islets. For instance, glutamic acid decarboxylase is an efficient autoantigen (74), and such antibodies could easily be present as contaminants in antibody preparations. In fact, glutamic acid decarboxylase has a molecular mass very close to that of EAAT2, complicating interpretation of Western blots. Similarly, when using knock-out mice as negative controls, it was shown that previous reports of VGLUTs in brain astrocytes are probably wrong (75).
Glutamate Metabolism in Islets
The role of glutamate in β-cells has been intensely debated (for reviews, see Refs. 5, 8, and 76). Because the EAAT-type transporters are present only at very low levels or not at all, we searched for other transporters with affinity for glutamate. However, AGT1 (Slc7a13; Ref. 77), NaC3 (Slc13a3; Ref. 78), and CCC9A (Slc12a8; Ref. 79) were also not detected. The only one detected was ASCT2 (Slc1a5), which transports glutamate with low affinity (Km = 1.5 mm; Ref. 80). Based on this, it seems legitimate to suggest that only a small fraction of intracellular glutamate in β-cells is likely to come from outside. SNAT2 (Slc38a2; Ref. 81) and PAT1 (Slc36a1; Ref. 82) enable islets to take up histidine and proline. These compounds can be converted to glutamate. Both of the enzymes (1-pyrroline-5-carboxylate dehydrogenase and pyrroline-5-carboxylate reductase) required for the conversion of proline to glutamate are present in islets. Glutamate may also be produced from glutamine (9) because islets have SNAT-type transporters that can take up glutamine, but it is a paradox (Table 3) that the glutaminase (Gls2) levels are about 200 times lower than those of glutamine synthetase (Glul). Furthermore, both glutaminase and the transporters SNAT2, -3, and -5 and ASCT1 and -2 were detected at higher levels in whole pancreas than in islets, whereas SNAT4 was enriched in islets relative to whole pancreas. Although amounts of enzyme protein do not automatically translate into enzyme activity, the higher levels of glutamine synthetase than glutaminase argue for a significant synthesis of glutamine in islets. In fact, inhibition of glutamine synthetase with methionine sulfoximine suppressed insulin release, and this inhibition was associated with accumulation of glutamate and aspartate (13). On the other hand, addition of a glutamate dehydrogenase activator (e.g. leucine) in combination with glutamine increases islet glutamate and insulin secretion (9). However, glutamate dehydrogenase plays complex roles and is able to both metabolize glutamate to α-ketoglutarate and ammonium and produce glutamate (9). Furthermore, addition of glutamine is reported to protect pancreas during transplantation (83). Thus, the direction of glutamate metabolism appears to depend on the metabolic states. In this context, it is worth recalling that we found the glutamine synthetase expression to be highly variable between cells and not limited to insulin-positive cells. Finally, most of the glutaminase activity is reported to be in the islet mantle (12).
Islet Cells Are Able to Take Up Glucose and Neutral Amino Acids
Together, the identified plasma membrane transporters with known function (Table 4) would be expected to provide the islet cells with the ability to take up all of the essential amino acids (80, 82, 84–87) as well as glucose (with Slc2a2) and lactate (with Slc16a1). In addition to the essential amino acids, there is a considerable capacity for transporting neutral amino acids including alanine, serine, and glutamine (see Table 4). In fact, alanine has been reported to be consumed at a high rate by islets and appears to be an important β-cell fuel (88). This means that the main uptake capacity concerns compounds that can be converted to pyruvate or when combined with α-ketoglutarate can be converted to glutamate in processes catalyzed by transaminases (EC 2.6.1). As some of the enzymes in question are in mitochondria, it makes sense that the mitochondrial carriers are expressed at high levels too in agreement with previous observations (for reviews, see Refs. 5 and 8).
Species and Age Differences
When discussing protein expression in islets, it is important to keep in mind that there are species differences in islet function (89), islets are maturing relatively late during postnatal development (29), and there are changes in expression during glucose stimulation and insulin release (25, 47). However, the microarray data (Fig. 9) do not give indications of major species differences with respect to EAAT2 and VGLUT3 in islets.
Conclusions
1) Deletion of EAAT2 in the nervous system is sufficient to reproduce the phenotype of the conventional EAAT2 knock-out mice, the reduced body weight included. 2) If EAAT-type transporter proteins are expressed in pancreatic plasma membranes, then the levels must be low. Furthermore, they are unlikely to be restricted to β-cells. 3) In contrast to the glutamate transporters, glutamate-metabolizing enzymes are expressed at high levels. This suggests that islet glutamate is predominantly produced intracellularly rather than taken up from the outside. 4) The claim that EAAT2 and VGLUT3 are targeted to secretory granules (26) is not supported. 5) Islets can take up glutamine and convert it to glutamate by means of glutaminase (9). Here we show that they also have high levels of glutamine synthetase, suggesting substantial capacity for ammonia detoxification and glutamine synthesis. 6) We have produced the first conditional EAAT2 knock-out mice. These will be highly useful for studies of EAAT2 in brain and liver.
Acknowledgments
We thank Henriette Danbolt for technical assistance, Helena Edlund and Susan Bonner-Weir for discussions, Helena Edlund for providing the IPF1-Cre line (39), Kohichi Tanaka for providing the conventional EAAT2 knock-out mice (27), and Eckhard Lammert and Karolina Chwalek for providing pancreas tissue for proteome analysis. We are grateful to Matthias Mann for help and support in the proteome measurement and analysis.
This work was supported by the Norwegian Research Council (Centre of Excellence, Centre for Molecular Biology and Neuroscience, and Grants 164297-V40 and 183727-S10) and by the Norwegian Advanced Research Program (Toppforskningsprogrammet).

This article contains supplemental Tables S1 and S2.
- VGLUT
- vesicular glutamate transporter
- EAAT
- excitatory amino acid transporter
- GLUL
- glutamate-ammonia ligase (also referred to as glutamine synthetase)
- Slc
- solute carrier
- TEMED
- tetramethyleneethylenediamine
- Cre
- cyclization recombinase
- RIP
- rat insulin promoter
- Ab
- antibody
- cKO
- conditional knock-out
- SNAT
- system N amino acid transporter
- fKO
- the EAAT2-flox allele after Cre-excision
- VGAT
- vesicular GABA transporter.
REFERENCES
- 1. Moriyama Y., Hayashi M. (2003) Glutamate-mediated signaling in the islets of Langerhans: a thread entangled. Trends Pharmacol. Sci. 24, 511–517 [DOI] [PubMed] [Google Scholar]
- 2. MacDonald M. J., Fahien L. A. (2000) Glutamate is not a messenger in insulin secretion. J. Biol. Chem. 275, 34025–34027 [DOI] [PubMed] [Google Scholar]
- 3. Yamada S., Komatsu M., Sato Y., Yamauchi K., Aizawa T., Hashizume K. (2001) Glutamate is not a major conveyer of ATP-sensitive K+ channel-independent glucose action in pancreatic islet β cell. Endocr. J. 48, 391–395 [DOI] [PubMed] [Google Scholar]
- 4. Bertrand G., Ishiyama N., Nenquin M., Ravier M. A., Henquin J.-C. (2002) The elevation of glutamate content and the amplification of insulin secretion in glucose-stimulated pancreatic islets are not causally related. J. Biol. Chem. 277, 32883–32891 [DOI] [PubMed] [Google Scholar]
- 5. Jitrapakdee S., Wutthisathapornchai A., Wallace J. C., MacDonald M. J. (2010) Regulation of insulin secretion: role of mitochondrial signalling. Diabetologia 53, 1019–1032 [DOI] [PMC free article] [PubMed] [Google Scholar]
- 6. Nissim I. (1999) Newer aspects of glutamine/glutamate metabolism: the role of acute pH changes. Am. J. Physiol. Renal Physiol. 277, F493–F497 [DOI] [PubMed] [Google Scholar]
- 7. Brosnan J. T. (2000) Glutamate, at the interface between amino acid and carbohydrate metabolism. J. Nutr. 130, 988S–990S [DOI] [PubMed] [Google Scholar]
- 8. Frigerio F., Casimir M., Carobbio S., Maechler P. (2008) Tissue specificity of mitochondrial glutamate pathways and the control of metabolic homeostasis. Biochim. Biophys. Acta 1777, 965–972 [DOI] [PubMed] [Google Scholar]
- 9. Fahien L. A., Macdonald M. J. (2011) The complex mechanism of glutamate dehydrogenase in insulin secretion. Diabetes 60, 2450–2454 [DOI] [PMC free article] [PubMed] [Google Scholar]
- 10. Meabon J. S., Lee A., Meeker K. D., Bekris L. M., Fujimura R. K., Yu C.-E., Watson G. S., Pow D. V., Sweet I. R., Cook D. G. (2012) Differential expression of the glutamate transporter GLT-1 in pancreas. J. Histochem. Cytochem. 60, 139–151 [DOI] [PMC free article] [PubMed] [Google Scholar]
- 11. Baglietto-Vargas D., López-Téllez J. F., Moreno-González I., Gutiérrez A., Aledo J. C. (2004) Segregation of two glutaminase isoforms in islets of Langerhans. Biochem. J. 381, 483–487 [DOI] [PMC free article] [PubMed] [Google Scholar]
- 12. Montero F., Baglietto-Vargas D., Moreno-González I., López-Tellez J. F., Cuesta-Munoz A. L., Gutiérrez A., Aledo J. C. (2007) Glutaminase activity is confined to the mantle of the islets of Langerhans. Biochimie 89, 1366–1371 [DOI] [PubMed] [Google Scholar]
- 13. Li C., Buettger C., Kwagh J., Matter A., Daikhin Y., Nissim I. B., Collins H. W., Yudkoff M., Stanley C. A., Matschinsky F. M. (2004) A signaling role of glutamine in insulin secretion. J. Biol. Chem. 279, 13393–13401 [DOI] [PubMed] [Google Scholar]
- 14. Eto K., Yamashita T., Hirose K., Tsubamoto Y., Ainscow E. K., Rutter G. A., Kimura S., Noda M., Iino M., Kadowaki T. (2003) Glucose metabolism and glutamate analog acutely alkalinize pH of insulin secretory vesicles of pancreatic β-cells. Am. J. Physiol. Endocrinol. Metab. 285, E262–E271 [DOI] [PubMed] [Google Scholar]
- 15. Bai L., Zhang X., Ghishan F. K. (2003) Characterization of vesicular glutamate transporter in pancreatic α- and β-cells and its regulation by glucose. Am. J. Physiol. Gastrointest. Liver Physiol. 284, G808–G814 [DOI] [PubMed] [Google Scholar]
- 16. Hayashi M., Yamada H., Uehara S., Morimoto R., Muroyama A., Yatsushiro S., Takeda J., Yamamoto A., Moriyama Y. (2003) Secretory granule-mediated co-secretion of l-glutamate and glucagon triggers glutamatergic signal transmission in Islets of Langerhans. J. Biol. Chem. 278, 1966–1974 [DOI] [PubMed] [Google Scholar]
- 17. Tong Q., Ouedraogo R., Kirchgessner A. L. (2002) Localization and function of group III metabotropic glutamate receptors in rat pancreatic islets. Am. J. Physiol. Endocrinol. Metab. 282, E1324–E1333 [DOI] [PubMed] [Google Scholar]
- 18. Julio-Pieper M., Flor P. J., Dinan T. G., Cryan J. F. (2011) Exciting times beyond the brain: metabotropic glutamate receptors in peripheral and non-neural tissues. Pharmacol. Rev. 63, 35–58 [DOI] [PubMed] [Google Scholar]
- 19. Danbolt N. C. (2001) Glutamate uptake. Prog. Neurobiol. 65, 1–105 [DOI] [PubMed] [Google Scholar]
- 20. Manfras B. J., Boehm B. O. (1995) Expression of a glutamate transporter cDNA in human pancreatic islets. Exp. Clin. Endocrinol. Diabetes 103, 95–98 [DOI] [PubMed] [Google Scholar]
- 21. Kim S. Y., Chao W., Choi S. Y., Volsky D. J. (2003) Cloning and characterization of the 3′-untranslated region of the human excitatory amino acid transporter 2 transcript. J. Neurochem. 86, 1458–1467 [DOI] [PubMed] [Google Scholar]
- 22. Fukushima D., Doi H., Fukushima K., Katsura K., Ogawa N., Sekiguchi S., Fujimori K., Sato A., Satomi S., Ishida K., Fukushima K. (2010) Glutamate exocrine dynamics augmented by plasma glutamine and the distribution of amino acid transporters of the rat pancreas. J. Physiol. Pharmacol. 61, 265–271 [PubMed] [Google Scholar]
- 23. Di Cairano E. S., Davalli A. M., Perego L., Sala S., Sacchi V. F., La Rosa S., Finzi G., Placidi C., Capella C., Conti P., Centonze V. E., Casiraghi F., Bertuzzi F., Folli F., Perego C. (2011) The glial glutamate transporter 1 (GLT1) is expressed by pancreatic β-cells and prevents glutamate-induced β-cell death. J. Biol. Chem. 286, 14007–14018 [DOI] [PMC free article] [PubMed] [Google Scholar]
- 24. Feldmann N., del Rio R. M., Gjinovci A., Tamarit-Rodriguez J., Wollheim C. B., Wiederkehr A. (2011) Reduction of plasma membrane glutamate transport potentiates insulin but not glucagon secretion in pancreatic islet cells. Mol. Cell. Endocrinol. 338, 46–57 [DOI] [PubMed] [Google Scholar]
- 25. Danzer C., Eckhardt K., Schmidt A., Fankhauser N., Ribrioux S., Wollscheid B., Müller L., Schiess R., Züllig R., Lehmann R., Spinas G., Aebersold R., Krek W. (2012) Comprehensive description of the N-glycoproteome of mouse pancreatic β-cells and human islets. J. Proteome Res. 11, 1598–1608 [DOI] [PubMed] [Google Scholar]
- 26. Gammelsaeter R., Coppola T., Marcaggi P., Storm-Mathisen J., Chaudhry F. A., Attwell D., Regazzi R., Gundersen V. (2011) A role for glutamate transporters in the regulation of insulin secretion. PLoS One 6, e22960. [DOI] [PMC free article] [PubMed] [Google Scholar]
- 27. Tanaka K., Watase K., Manabe T., Yamada K., Watanabe M., Takahashi K., Iwama H., Nishikawa T., Ichihara N., Kikuchi T., Okuyama S., Kawashima N., Hori S., Takimoto M., Wada K. (1997) Epilepsy and exacerbation of brain injury in mice lacking the glutamate transporter GLT-1. Science 276, 1699–1702 [DOI] [PubMed] [Google Scholar]
- 28. Bliss C. R., Sharp G. W. (1992) Glucose-induced insulin release in islets of young rats: time-dependent potentiation and effects of 2-bromostearate. Am. J. Physiol. Endocrinol. Metab. 263, E890–E896 [DOI] [PubMed] [Google Scholar]
- 29. Jermendy A., Toschi E., Aye T., Koh A., Aguayo-Mazzucato C., Sharma A., Weir G. C., Sgroi D., Bonner-Weir S. (2011) Rat neonatal β cells lack the specialised metabolic phenotype of mature β cells. Diabetologia 54, 594–604 [DOI] [PMC free article] [PubMed] [Google Scholar]
- 30. Storck T., Schulte S., Hofmann K., Stoffel W. (1992) Structure, expression, and functional analysis of a Na+-dependent glutamate/aspartate transporter from rat brain. Proc. Natl. Acad. Sci. U.S.A. 89, 10955–10959 [DOI] [PMC free article] [PubMed] [Google Scholar]
- 31. Pines G., Danbolt N. C., Bjørås M., Zhang Y., Bendahan A., Eide L., Koepsell H., Storm-Mathisen J., Seeberg E., Kanner B. I. (1992) Cloning and expression of a rat brain L-glutamate transporter. Nature 360, 464–467 [DOI] [PubMed] [Google Scholar]
- 32. Lehre A. C., Rowley N. M., Zhou Y., Holmseth S., Guo C., Holen T., Hua R., Laake P., Olofsson A. M., Poblete-Naredo I., Rusakov D. A., Madsen K. K., Clausen R. P., Schousboe A., White H. S., Danbolt N. C. (2011) Deletion of the betaine-GABA transporter (BGT1; slc6a12) gene does not affect seizure thresholds of adult mice. Epilepsy Res. 95, 70–81 [DOI] [PMC free article] [PubMed] [Google Scholar]
- 33. Liu P., Jenkins N. A., Copeland N. G. (2003) A highly efficient recombineering-based method for generating conditional knockout mutations. Genome Res. 13, 476–484 [DOI] [PMC free article] [PubMed] [Google Scholar]
- 34. Tang S.-H. E., Silva F. J., Tsark W. M., Mann J. R. (2002) A Cre/loxP-deleter transgenic line in mouse strain 129S1/SvImJ. Genesis 32, 199–202 [DOI] [PubMed] [Google Scholar]
- 35. Tronche F., Kellendonk C., Kretz O., Gass P., Anlag K., Orban P. C., Bock R., Klein R., Schütz G. (1999) Disruption of the glucocorticoid receptor gene in the nervous system results in reduced anxiety. Nat. Genet. 23, 99–103 [DOI] [PubMed] [Google Scholar]
- 36. Treutelaar M. K., Skidmore J. M., Dias-Leme C. L., Hara M., Zhang L., Simeone D., Martin D. M., Burant C. F. (2003) Nestin-lineage cells contribute to the microvasculature but not endocrine cells of the islet. Diabetes 52, 2503–2512 [DOI] [PubMed] [Google Scholar]
- 37. Delacour A., Nepote V., Trumpp A., Herrera P. L. (2004) Nestin expression in pancreatic exocrine cell lineages. Mech. Dev. 121, 3–14 [DOI] [PubMed] [Google Scholar]
- 38. Crabtree J. S., Scacheri P. C., Ward J. M., McNally S. R., Swain G. P., Montagna C., Hager J. H., Hanahan D., Edlund H., Magnuson M. A., Garrett-Beal L., Burns A. L., Ried T., Chandrasekharappa S. C., Marx S. J., Spiegel A. M., Collins F. S. (2003) Of mice and MEN1: insulinomas in a conditional mouse knockout. Mol. Cell. Biol. 23, 6075–6085 [DOI] [PMC free article] [PubMed] [Google Scholar]
- 39. Svensson P., Bergqvist I., Norlin S., Edlund H. (2009) MFng is dispensable for mouse pancreas development and function. Mol. Cell. Biol. 29, 2129–2138 [DOI] [PMC free article] [PubMed] [Google Scholar]
- 40. Berger U. V., Hediger M. A. (2006) Distribution of the glutamate transporters GLT-1 (SLC1A2) and GLAST (SLC1A3) in peripheral organs. Anat. Embryol. 211, 595–606 [DOI] [PubMed] [Google Scholar]
- 41. Berger U. V., Hediger M. A. (1998) Comparative analysis of glutamate transporter expression in rat brain using differential double in situ hybridization. Anat. Embryol. 198, 13–30 [DOI] [PubMed] [Google Scholar]
- 42. Holmseth S., Scott H. A., Real K., Lehre K. P., Leergaard T. B., Bjaalie J. G., Danbolt N. C. (2009) The concentrations and distributions of three C-terminal variants of the GLT1 (EAAT2; slc1a2) glutamate transporter protein in rat brain tissue suggest differential regulation. Neuroscience 162, 1055–1071 [DOI] [PubMed] [Google Scholar]
- 43. Danbolt N. C., Lehre K. P., Dehnes Y., Chaudhry F. A., Levy L. M. (1998) Localization of transporters using transporter-specific antibodies. Methods Enzymol. 296, 388–407 [DOI] [PubMed] [Google Scholar]
- 44. Zhou Y., Holmseth S., Hua R., Lehre A. C., Olofsson A. M., Poblete-Naredo I., Kempson S. A., Danbolt N. C. (2012) The betaine-GABA transporter (BGT1, slc6a12) is predominantly expressed in the liver and at lower levels in the kidneys and at the brain surface. Am. J. Physiol. Renal Physiol. 302, F316–F328 [DOI] [PubMed] [Google Scholar]
- 45. Lehre K. P., Levy L. M., Ottersen O. P., Storm-Mathisen J., Danbolt N. C. (1995) Differential expression of two glial glutamate transporters in the rat brain: quantitative and immunocytochemical observations. J. Neurosci. 15, 1835–1853 [DOI] [PMC free article] [PubMed] [Google Scholar]
- 46. Weibel E. R. (1979) Stereological Methods. Vol. 1. Practical Methods for Biological Morphometry, Academic Press, Waltham, MA [Google Scholar]
- 47. Waanders L. F., Chwalek K., Monetti M., Kumar C., Lammert E., Mann M. (2009) Quantitative proteomic analysis of single pancreatic islets. Proc. Natl. Acad. Sci. U.S.A. 106, 18902–18907 [DOI] [PMC free article] [PubMed] [Google Scholar]
- 48. Waanders L. F., Almeida R., Prosser S., Cox J., Eikel D., Allen M. H., Schultz G. A., Mann M. (2008) A novel chromatographic method allows on-line reanalysis of the proteome. Mol. Cell. Proteomics 7, 1452–1459 [DOI] [PMC free article] [PubMed] [Google Scholar]
- 49. Lehre K. P., Danbolt N. C. (1998) The number of glutamate transporter subtype molecules at glutamatergic synapses: chemical and stereological quantification in young adult rat brain. J. Neurosci. 18, 8751–8757 [DOI] [PMC free article] [PubMed] [Google Scholar]
- 50. Holmseth S., Dehnes Y., Bjørnsen L. P., Boulland J. L., Furness D. N., Bergles D., Danbolt N. C. (2005) Specificity of antibodies: unexpected cross reactivity of antibodies directed against the EAAT3 (EAAC) glutamate transporter. Neuroscience 136, 649–660 [DOI] [PubMed] [Google Scholar]
- 51. Holmseth S., Zhou Y., Follin-Arbelet V. V., Lehre K. P., Bergles D. E., Danbolt N. C. (2012) Specificity controls for immunocytochemistry: the antigen pre-adsorption test can lead to inaccurate assessment of antibody specificity. J. Histochem. Cytochem. 60, 174–187 [DOI] [PMC free article] [PubMed] [Google Scholar]
- 52. Dean P. M. (1973) Ultrastructural morphometry of the pancreatic β-cell. Diabetologia 9, 115–119 [DOI] [PubMed] [Google Scholar]
- 53. Fava E., Dehghany J., Ouwendijk J., Müller A., Niederlein A., Verkade P., Meyer-Hermann M., Solimena M. (2012) Novel standards in the measurement of rat insulin granules combining electron microscopy, high-content image analysis and in silico modelling. Diabetologia 55, 1013–1023 [DOI] [PMC free article] [PubMed] [Google Scholar]
- 54. Palacín M., Nunes V., Font-Llitjós M., Jiménez-Vidal M., Fort J., Gasol E., Pineda M., Feliubadaló L., Chillarón J., Zorzano A. (2005) The genetics of heteromeric amino acid transporters. Physiology 20, 112–124 [DOI] [PubMed] [Google Scholar]
- 55. Parra L. A., Baust T., El Mestikawy S., Quiroz M., Hoffman B., Haflett J. M., Yao J. K., Torres G. E. (2008) The orphan transporter Rxt1/NTT4 (SLC6A17) functions as a synaptic vesicle amino acid transporter selective for proline, glycine, leucine, and alanine. Mol. Pharmacol. 74, 1521–1532 [DOI] [PubMed] [Google Scholar]
- 56. Zaia K. A., Reimer R. J. (2009) Synaptic vesicle protein NTT4/XT1 (SLC6A17) catalyzes Na+-coupled neutral amino acid transport. J. Biol. Chem. 284, 8439–8448 [DOI] [PMC free article] [PubMed] [Google Scholar]
- 57. Chimienti F., Devergnas S., Pattou F., Schuit F., Garcia-Cuenca R., Vandewalle B., Kerr-Conte J., Van Lommel L., Grunwald D., Favier A., Seve M. (2006) In vivo expression and functional characterization of the zinc transporter ZnT8 in glucose-induced insulin secretion. J. Cell Sci. 119, 4199–4206 [DOI] [PubMed] [Google Scholar]
- 58. Petyuk V. A., Qian W.-J., Hinault C., Gritsenko M. A., Singhal M., Monroe M. E., Camp D. G., 2nd, Kulkarni R. N., Smith R. D. (2008) Characterization of the mouse pancreatic islet proteome and comparative analysis with other mouse tissues. J. Proteome Res. 7, 3114–3126 [DOI] [PMC free article] [PubMed] [Google Scholar]
- 59. Kiryk A., Aida T., Tanaka K., Banerjee P., Wilczynski G. M., Meyza K., Knapska E., Filipkowski R. K., Kaczmarek L., Danysz W. (2008) Behavioral characterization of GLT1 (+/−) mice as a model of mild glutamatergic hyperfunction. Neurotox. Res. 13, 19–30 [DOI] [PubMed] [Google Scholar]
- 60. Pollard M., McGivan J. (2000) The rat hepatoma cell line H4-II-E-C3 expresses high activities of the high-affinity glutamate transporter GLT-1A. FEBS Lett. 484, 74–76 [DOI] [PubMed] [Google Scholar]
- 61. Beart P. M., O'Shea R. D. (2007) Transporters for L-glutamate: an update on their molecular pharmacology and pathological involvement. Br. J. Pharmacol. 150, 5–17 [DOI] [PMC free article] [PubMed] [Google Scholar]
- 62. Tzingounis A. V., Wadiche J. I. (2007) Glutamate transporters: confining runaway excitation by shaping synaptic transmission. Nat. Rev. Neurosci. 8, 935–947 [DOI] [PubMed] [Google Scholar]
- 63. Harada T., Chelala C., Crnogorac-Jurcevic T., Lemoine N. R. (2009) Genome-wide analysis of pancreatic cancer using microarray-based techniques. Pancreatology 9, 13–24 [DOI] [PubMed] [Google Scholar]
- 64. Kambe T. (2011) An overview of a wide range of functions of ZnT and Zip zinc transporters in the secretory pathway. Biosci. Biotechnol. Biochem. 75, 1036–1043 [DOI] [PubMed] [Google Scholar]
- 65. In't Veld P., Marichal M. (2010) Microscopic anatomy of the human islet of Langerhans. Adv. Exp. Med. Biol. 654, 1–19 [DOI] [PubMed] [Google Scholar]
- 66. Bertrand G., Puech R., Loubatieresmariani M. M., Bockaert J. (1995) Glutamate stimulates insulin secretion and improves glucose tolerance in rats. Am. J. Physiol. Endocrinol. Metab. 32, E551–E556 [DOI] [PubMed] [Google Scholar]
- 67. Graham T. E., Sgro V., Friars D., Gibala M. J. (2000) Glutamate ingestion: the plasma and muscle free amino acid pools of resting humans. Am. J. Physiol. Endocrinol. Metab. 278, E83–E89 [DOI] [PubMed] [Google Scholar]
- 68. Zlotnik A., Ohayon S., Gruenbaum B. F., Gruenbaum S. E., Mohar B., Boyko M., Klin Y., Sheiner E., Shaked G., Shapira Y., Teichberg V. I. (2011) Determination of factors affecting glutamate concentrations in the whole blood of healthy human volunteers. J. Neurosurg. Anesthesiol. 23, 45–49 [DOI] [PubMed] [Google Scholar]
- 69. Holmseth S., Lehre K. P., Danbolt N. C. (2006) Specificity controls for immunocytochemistry. Anat. Embryol. 211, 257–266 [DOI] [PubMed] [Google Scholar]
- 70. Chaudhry F. A., Lehre K. P., van Lookeren Campagne M., Ottersen O. P., Danbolt N. C., Storm-Mathisen J. (1995) Glutamate transporters in glial plasma membranes: highly differentiated localizations revealed by quantitative ultrastructural immunocytochemistry. Neuron 15, 711–720 [DOI] [PubMed] [Google Scholar]
- 71. Furness D. N., Dehnes Y., Akhtar A. Q., Rossi D. J., Hamann M., Grutle N. J., Gundersen V., Holmseth S., Lehre K. P., Ullensvang K., Wojewodzic M., Zhou Y., Attwell D., Danbolt N. C. (2008) A quantitative assessment of glutamate uptake into hippocampal synaptic terminals and astrocytes: new insights into a neuronal role for excitatory amino acid transporter 2 (EAAT2). Neuroscience 157, 80–94 [DOI] [PMC free article] [PubMed] [Google Scholar]
- 72. Rhodes K. J., Trimmer J. S. (2006) Antibodies as valuable neuroscience research tools versus reagents of mass distraction. J. Neurosci. 26, 8017–8020 [DOI] [PMC free article] [PubMed] [Google Scholar]
- 73. Lorincz A., Nusser Z. (2008) Specificity of immunoreactions: the importance of testing specificity in each method. J. Neurosci. 28, 9083–9086 [DOI] [PMC free article] [PubMed] [Google Scholar]
- 74. Baekkeskov S., Aanstoot H. J., Christgau S., Reetz A., Solimena M., Cascalho M., Folli F., Richter-Olesen H., De Camilli P. (1990) Identification of the 64K autoantigen in insulin-dependent diabetes as the GABA-synthesizing enzyme glutamic acid decarboxylase. Nature 347, 151–156 [DOI] [PubMed] [Google Scholar]
- 75. Li D., Hérault K., Silm K., Evrard A., Wojcik S., Oheim M., Herzog E., Ropert N. (2013) Lack of evidence for vesicular glutamate transporter expression in mouse astrocytes. J. Neurosci. 33, 4434–4455 [DOI] [PMC free article] [PubMed] [Google Scholar]
- 76. Newsholme P., Abdulkader F., Rebelato E., Romanatto T., Pinheiro C. H., Vitzel K. F., Silva E. P., Bazotte R. B., Procopio J., Curi R., Gorjao R., Pithon-Curi T. C. (2011) Amino acids and diabetes: implications for endocrine, metabolic and immune function. Front. Biosci. 16, 315–339 [DOI] [PubMed] [Google Scholar]
- 77. Matsuo H., Kanai Y., Kim J. Y., Chairoungdua A., Kim D. K., Inatomi J., Shigeta Y., Ishimine H., Chaekuntode S., Tachampa K., Choi H. W., Babu E., Fukuda J., Endou H. (2002) Identification of a novel Na+-independent acidic amino acid transporter with structural similarity to the member of a heterodimeric amino acid transporter family associated with unknown heavy chains. J. Biol. Chem. 277, 21017–21026 [DOI] [PubMed] [Google Scholar]
- 78. Chen X., Tsukaguchi H., Chen X. Z., Berger U. V., Hediger M. A. (1999) Molecular and functional analysis of SDCT2, a novel rat sodium-dependent dicarboxylate transporter. J. Clin. Investig. 103, 1159–1168 [DOI] [PMC free article] [PubMed] [Google Scholar]
- 79. Daigle N. D., Carpentier G. A., Frenette-Cotton R., Simard M. G., Lefoll M.-H., Noël M., Caron L., Noël J., Isenring P. (2009) Molecular characterization of a human cation-Cl− cotransporter (SLC12A8A, CCC9A) that promotes polyamine and amino acid transport. J. Cell. Physiol. 220, 680–689 [DOI] [PubMed] [Google Scholar]
- 80. Utsunomiya-Tate N., Endou H., Kanai Y. (1996) Cloning and functional characterization of a system ASC-like Na+-dependent neutral amino acid transporter. J. Biol. Chem. 271, 14883–14890 [DOI] [PubMed] [Google Scholar]
- 81. Mackenzie B., Erickson J. D. (2004) Sodium-coupled neutral amino acid (system N/A) transporters of the SLC38 gene family. Pflugers Arch. 447, 784–795 [DOI] [PubMed] [Google Scholar]
- 82. Thwaites D. T., Anderson C. M. (2011) The SLC36 family of proton-coupled amino acid transporters and their potential role in drug transport. Br. J. Pharmacol. 164, 1802–1816 [DOI] [PMC free article] [PubMed] [Google Scholar]
- 83. Avila J. G., Tsujimura T., Oberholzer J., Churchill T., Salehi P., Shapiro A. M., Lakey J. R. (2003) Improvement of pancreatic islet isolation outcomes using glutamine perfusion during isolation procedure. Cell Transplant. 12, 877–881 [PubMed] [Google Scholar]
- 84. Halestrap A. P., Meredith D. (2004) The SLC16 gene family—from monocarboxylate transporters (MCTs) to aromatic amino acid transporters and beyond. Pflugers Arch. 447, 619–628 [DOI] [PubMed] [Google Scholar]
- 85. Verrey F., Closs E. I., Wagner C. A., Palacin M., Endou H., Kanai Y. (2004) CATs and HATs: the SLC7 family of amino acid transporters. Pflugers Arch. 447, 532–542 [DOI] [PubMed] [Google Scholar]
- 86. Bröer S., Palacín M. (2011) The role of amino acid transporters in inherited and acquired diseases. Biochem. J. 436, 193–211 [DOI] [PubMed] [Google Scholar]
- 87. Liu Q.-R., López-Corcuera B., Nelson H., Mandiyan S., Nelson N. (1992) Cloning and expression of a cDNA encoding the transporter of taurine and β-alanine in mouse brain. Proc. Natl. Acad. Sci. U.S.A. 89, 12145–12149 [DOI] [PMC free article] [PubMed] [Google Scholar]
- 88. Dixon G., Nolan J., McClenaghan N., Flatt P. R., Newsholme P. (2003) A comparative study of amino acid consumption by rat islet cells and the clonal β-cell line BRIN-BD11—the functional significance of L-alanine. J. Endocrinol. 179, 447–454 [DOI] [PubMed] [Google Scholar]
- 89. MacDonald M. J., Longacre M. J., Stoker S. W., Kendrick M., Thonpho A., Brown L. J., Hasan N. M., Jitrapakdee S., Fukao T., Hanson M. S., Fernandez L. A., Odorico J. (2011) Differences between human and rodent pancreatic islets: low pyruvate carboxylase, ATP citrate lyase, and pyruvate carboxylation and high glucose-stimulated acetoacetate in human pancreatic islets. J. Biol. Chem. 286, 18383–18396 [DOI] [PMC free article] [PubMed] [Google Scholar]
- 90. Kutlu B., Burdick D., Baxter D., Rasschaert J., Flamez D., Eizirik D. L., Welsh N., Goodman N., Hood L. (2009) Detailed transcriptome atlas of the pancreatic β cell. BMC Med. Genomics 2, 3. [DOI] [PMC free article] [PubMed] [Google Scholar]
- 91. Beckstrøm H., Julsrud L., Haugeto O., Dewar D., Graham D. I., Lehre K. P., Storm-Mathisen J., Danbolt N. C. (1999) Interindividual differences in the levels of the glutamate transporters GLAST and GLT, but no clear correlation with Alzheimer's disease. J. Neurosci. Res. 55, 218–229 [DOI] [PubMed] [Google Scholar]
- 92. Danbolt N. C., Pines G., Kanner B. I. (1990) Purification and reconstitution of the sodium- and potassium-coupled glutamate transport glycoprotein from rat brain. Biochemistry 29, 6734–6740 [DOI] [PubMed] [Google Scholar]
- 93. Danbolt N. C., Storm-Mathisen J., Kanner B. I. (1992) An [Na+K+]coupled L-glutamate transporter purified from rat brain is located in glial cell processes. Neuroscience 51, 295–310 [DOI] [PubMed] [Google Scholar]
- 94. Levy L. M., Lehre K. P., Rolstad B., Danbolt N. C. (1993) A monoclonal antibody raised against an [Na+K+]coupled L-glutamate transporter purified from rat brain confirms glial cell localization. FEBS Lett. 317, 79–84 [DOI] [PubMed] [Google Scholar]
- 95. Milton I. D., Banner S. J., Ince P. G., Piggott N. H., Fray A. E., Thatcher N., Horne C. H., Shaw P. J. (1997) Expression of the glial glutamate transporter EAAT2 in the human CNS: an immunohistochemical study. Brain Res. Mol. Brain Res. 52, 17–31 [DOI] [PubMed] [Google Scholar]
- 96. Li Y., Zhou Y., Danbolt N. C. (2012) The rates of postmortem proteolysis of glutamate transporters differ dramatically between cells and between transporter subtypes. J. Histochem. Cytochem. 60, 811–821 [DOI] [PMC free article] [PubMed] [Google Scholar]
- 97. Cox J., Mann M. (2008) MaxQuant enables high peptide identification rates, individualized p.p.b.-range mass accuracies and proteome-wide protein quantification. Nat. Biotechnol. 26, 1367–1372 [DOI] [PubMed] [Google Scholar]
- 98. Ahlgren U., Jonsson J., Jonsson L., Simu K., Edlund H. (1998) β-Cell-specific inactivation of the mouse Ipf1/Pdx1 gene results in loss of the β-cell phenotype and maturity onset diabetes. Genes Dev. 12, 1763–1768 [DOI] [PMC free article] [PubMed] [Google Scholar]