

Background: Mitochondrial calcium overload triggers permeability transition pore formation, fatty acid release, and necrotic cell death.
Results: Pyrrophenone and KT195 inhibit cell death by blocking mitochondrial calcium uptake.
Conclusion: Serine hydrolase inhibitors block mitochondrial calcium uptake but do not directly inhibit the enzyme releasing fatty acids during pore formation.
Significance: Serine hydrolase inhibitors have potential to block necrotic cell death associated with disease.
Keywords: Arachidonic Acid, Calcium, CaMKII, Fatty Acid, Mitochondria, Mitochondrial Permeability Transition, Phospholipase A, Cyclosporin A, Pyrrophenone, Serine Hydrolase
Abstract
Perturbation of calcium signaling that occurs during cell injury and disease, promotes cell death. In mouse lung fibroblasts A23187 triggered mitochondrial permeability transition pore (MPTP) formation, lactate dehydrogenase (LDH) release, and necrotic cell death that were blocked by cyclosporin A (CsA) and EGTA. LDH release temporally correlated with arachidonic acid release but did not involve cytosolic phospholipase A2α (cPLA2α) or calcium-independent PLA2. Surprisingly, release of arachidonic acid and LDH from cPLA2α-deficient fibroblasts was inhibited by the cPLA2α inhibitor pyrrophenone, and another serine hydrolase inhibitor KT195, by preventing mitochondrial calcium uptake. Inhibitors of calcium/calmodulin-dependent protein kinase II, a mitochondrial Ca2+ uniporter (MCU) regulator, also prevented MPTP formation and arachidonic acid release induced by A23187 and H2O2. Pyrrophenone blocked MCU-mediated mitochondrial calcium uptake in permeabilized fibroblasts but not in isolated mitochondria. Unlike pyrrophenone, the diacylglycerol analog 1-oleoyl-2-acetyl-sn-glycerol and CsA blocked cell death and arachidonic acid release not by preventing mitochondrial calcium uptake but by inhibiting MPTP formation. In fibroblasts stimulated with thapsigargin, which induces MPTP formation by a direct effect on mitochondria, LDH and arachidonic acid release were blocked by CsA and 1-oleoyl-2-acetyl-sn-glycerol but not by pyrrophenone or EGTA. Therefore serine hydrolase inhibitors prevent necrotic cell death by blocking mitochondrial calcium uptake but not the enzyme releasing fatty acids that occurs by a novel pathway during MPTP formation. This work reveals the potential for development of small molecule cell-permeable serine hydrolase inhibitors that block MCU-mediated mitochondrial calcium overload, MPTP formation, and necrotic cell death.
Introduction
Cells undergo a number of death pathways such as apoptosis, necroptosis, necrosis, and autophagic forms (1). Different forms of cell death are distinguished by morphological characteristics, requirement for ATP, gene expression, and unique biochemical pathways although there is considerable heterogeneity and overlap. Apoptosis occurs during normal developmental processes and is important in tissue homeostasis (2). Necrosis is a prevalent form of cell death that contributes to the pathogenesis of a variety of diseases such as neurodegenerative disorders, cardiac disease, and cancer (3–5).
Cell injury and death are often associated with dysfunctional calcium signaling (6–8). Perturbations in calcium homeostasis and mitochondria function contribute to necrotic cell death (9). Primary necrosis is driven by oxidative stress and calcium overload of the mitochondria that triggers formation of the mitochondrial permeability transition pore (MPTP),2 a non-selective reversible pore in the inner mitochondrial membrane (10). MPTP formation is inhibited by cyclosporin A (CsA), which targets cyclophilin D, a mitochondrial peptidyl prolylisomerase (11). Although the molecular identity of the MPTP has not been resolved, cyclophilin D is a critical regulator of pore formation and necrotic cell death (10, 12, 13). The MPTP has a physiological function in regulating mitochondrial Ca2+ homeostasis, however, its irreversible opening occurs in response to extreme environmental insults or during disease resulting in mitochondria swelling, depolarization, ATP depletion, and plasma membrane permeabilization (10, 14). For example, MPTP formation and necrotic cell death due to calcium accumulation and oxidative stress contribute to ischemia/reperfusion injury of the heart and other organs (9, 10). By blocking MPTP formation, CsA protects from myocardial reperfusion injury (15, 16). The MPTP may also contribute to the pathogenesis of chronic diseases such as neurological disorders and heart failure (17).
Although necrosis was historically considered to be “accidental” from exposure to harsh treatments, there is now evidence that it can be a regulated process. A number of signaling pathways have been identified that regulate MPTP formation and necrosis (18). Excessive activation of calcium/calmodulin-dependent protein kinase II (CaMKII) promotes mitochondrial calcium uptake and MPTP formation, which contribute to ischemia reperfusion injury and myocardial death (19, 20). A number of downstream targets for CaMKII have been identified including the mitochondrial calcium uniporter (MCU), which is phosphorylated and activated by CaMKII (20). The MCU is a 40-kDa calcium channel in the inner mitochondrial membrane responsible for ruthenium red/RU360-sensitive calcium uptake into the mitochondria (21, 22). Recent identification of the MCU provides an important pharmacologic target for development of inhibitors to prevent the deleterious consequences of excess mitochondrial calcium (23, 24).
Activation of phospholipases A2 (PLA2) is implicated in regulating MPTP formation because release of fatty acids accompanies MPTP formation in isolated mitochondria, and can facilitate pore opening (25–27). There is evidence that calcium-independent PLA2 (iPLA2), which localizes to mitochondria, regulates MPTP formation based on the use of the iPLA2 inhibitor bromoenolactone and using mitochondria from iPLA2γ knock-out mice (28–31). The Group IVA cytosolic PLA2 (cPLA2α) is also suggested to regulate MPTP formation and cell death by releasing arachidonic acid (32, 33). Calcium regulates cPLA2α by promoting its translocation from the cytosol to intracellular membranes although there is no evidence that it localizes to mitochondria (34, 35).
In this study we investigated if cPLA2α played a role in regulating MPTP formation and cell death in lung fibroblasts by using the cPLA2α serine hydrolase inhibitor pyrrophenone and comparing fibroblasts from cPLA2α wild type and knock-out mice. We found that A23187 stimulates a similar cell death pathway in cPLA2α wild type and knock-out lung fibroblasts with characteristics of primary necrosis including mitochondrial calcium overload, cyclophilin D-dependent MPTP formation, and regulation by CaMKII. Although A23187-stimulated MPTP formation is accompanied by fatty acid release it does not involve either cPLA2α or iPLA2. However, cell death and fatty acid release in A23187-stimulated fibroblasts lacking cPLA2α are prevented by serine hydrolase inhibitors, pyrrophenone, and the triazole urea inhibitor KT195. The inhibitors act by blocking calcium loading of the mitochondria but do not directly inhibit fatty acid release that occurs by a novel pathway during MPTP formation (Fig. 12).
FIGURE 12.

Regulation of necrotic cell death in lung fibroblasts. A23187 stimulates cell death in mouse lung fibroblasts with characteristics of primary necrosis including MPTP formation, release of fatty acids and LDH that are blocked by chelating extracellular calcium with EGTA, and by the cyclophilin D (CyD) inhibitor cyclosporin A (CsA). The serine hydrolase inhibitors pyrrophenone and KT195 block MPTP formation by inhibiting calcium loading of the mitochondria through the RU360-sensitive MCU. MPTP formation, fatty acid release, and cell death are also blocked by KN93, an inhibitor of the MCU regulator calmodulin-dependent protein kinase II. CsA and the diacylglycerol analog OAG block fatty acid release and cell death by directly inhibiting MPTP formation without blocking mitochondrial calcium loading suggesting that fatty acid release accompanies MPTP formation. This model is supported by results showing that MPTP formation, fatty acid release, and cell death stimulated by high concentrations of thapsigargin are blocked by OAG and CsA but not inhibited by KN93, EGTA, pyrrophenone, or KT195.
EXPERIMENTAL PROCEDURES
Materials
[5,6,8,9,11,12,14,15-3H]Arachidonic acid (specific activity 100 Ci/mmol), [1-C14]linoleic acid (specific activity 58.2 mCi/mmol), and [9,10-3H]oleic acid (specific activity 26.3 Ci/mmol) were from PerkinElmer Life Sciences. Dulbecco's modified Eagle's medium (DMEM) was from Lonza. Fetal bovine serum (FBS) was from Hyclone. Protease inhibitor tablets were from Roche Applied Science. Penicillin, streptomycin, l-glutamine, thapsigargin, Fura Red-AM, Rhod-2-AM, MitoTracker Green-FM, calcein-AM, Lipofectamine 2000, propidium iodide, Calcium Green-5N, probenecid, TaqMan Fast Universal PCR Master Mix, and TaqMan assay probes were from Invitrogen. A23187, RU360, CsA, autocamtide-2-related inhibitory peptide II (autocamtide), and Z-VAD(OMe)-fmk were purchased from EMD Millipore. EGTA, imidazole, Hepes, dithiothreitol, Fraction V BSA, hydrogen peroxide (H2O2) solution, and Tris-HCl were purchased from Sigma. The Qiagen RNeasy Minikit was used for RNA isolation. The Fermentas Maxima First Strand cDNA Synthesis Kit was from Thermo Scientific. The BCA protein assay kit was from Pierce. Pyrrophenone, bromoenolactone, KML29, KN93, and KN92 were from Cayman Chemical Co. 1-Oleoyl-2-acetyl-sn-glycerol (OAG) was from Avanti Polar Lipids. The PLA2 inhibitor Wyeth-1 was produced as previously described (36). The abhydrolase domain containing 6 (ABHD6) inhibitor KT195 and BODIPY-labeled probe HT-01 used for activity based protein profiling (ABPP) assays were synthesized as previously described (37).
Preparation of Pyrrophenone-OH
Pyrrophenone (100 μg) was dissolved in 60 μl of dry dimethylformamide and 200 μl of dry methanol. A small amount of sodium borohydride (a few crystals, ∼10 μg) was added, and the mixture was stirred at room temperature for 2 h. Analysis by electrospray ionization mass spectrometry showed complete reduction of the ketone to the alcohol. The entire mixture was injected onto the C18 reverse-phase HPLC column (Waters, YMC-Pack ODS-A, 100 × 20 mm, S-5 μm particles). The solvent program was 90% A (water), 10% B (acetonitrile) to 90% B over 25 min, then to 100% B over 30 s, then hold at 100% B for 10 min. The desired alcohol eluted at 15.4 min as confirmed by mass spectrometry and proton-NMR analysis. This program produces baseline separation of alcohol from ketone. The alcohol-containing fraction was concentrated to dryness under vacuum and then submitted to quantitative proton-NMR using N,N-dimethylformamide as an internal standard to determine the amount of alcohol.
Generation of cPLA2ζ Knock-out Mice
A conditional knock-out mouse of Group IVF PLA2 (cPLA2ζ) was generated by inGenious Targeting Laboratory, Inc. (Stony Brook, NY). A 12.5-kb region used to construct the targeting vector was first subcloned from a positively identified C57BL/6 BAC clone (RPCI23) using homologous recombination. The region was designed such that the short homology arm extends 2.5 kb to 5′ of loxP/FRT flanked Neo cassette. The long homology arm ends on the 5′ single loxP side (∼7.8 kb long). The single loxP site was inserted upstream of exon 12, and the loxP/FRT-flanked Neo cassette inserted downstream of exon 12. The target region is 2.2 kb including exon 12. Exon 12 contains the active site residues Ser-393 and Arg-365. The BAC was subcloned into a ∼2.4-kb pSP72 (Promega) backbone vector containing an ampicillin selection cassette for retransformation of the construct prior to electroporation. A pGK-gb2 loxP/FRT-flanked Neomycin cassette was inserted into the gene and the targeting construct was linearized using NotI prior to electroporation into ES cells. The total size of the targeting construct (including vector backbone) was ∼16.7 kb. Targeted iTL BA1 (C57BL/6 × 129/SvEv) hybrid embryonic stem cells were microinjected into C57BL/6 blastocysts. Resulting chimeras with a high percentage agouti coat color were mated to wild type C57BL/6 mice to generate F1 heterozygous offspring. Tail DNA was analyzed as described below from pups with agouti or black coat color. Primer sets used to screen F1 mice include LAN1 (5′-CCAGAGGCCACTTGTGTAGC-3′), which anneals inside the Neo cassette, and A3 (5′-AAGTCCTTCATGGGTGTGAGCTG-3′), which anneals 3′ to the short homology arm, outside the region used to create the targeting construct. A3/LAN1 amplifies a fragment of 2.9 kb in length. The expanded positive ES cell clone was used as a positive control. An F1 heterozygous mouse was identified for targeted integration and the third loxP site confirmed by amplification and sequencing, and mated with wild-type mice. F2 heterozygous mice were identified for targeted integration and confirmed with the third loxP site. F2 heterozygous mice were mated to X-linked CMV-Cre mice (129-Gt(ROSA)26Sortm1(cre/Esr1)Nat/J) to remove the loxP-flanked Neo cassette and exon 12 for generation of cPLA2ζ knock-out mice. F3 heterozygous CMV-Cre cPLA2ζ knock-out mice were mated to wild type C57BL/6 mice to generate mice without Cre and then heterozygous cPLA2ζ knock-out mice were backcrossed to wild type Balb/c mice for at least 10 generations to get cPLA2ζ knock-out Balb/c mice.
Cell Culture and Fatty Acid Release Assay
Mouse lung fibroblasts (MLF) were isolated from wild type cPLA2α (MLFα+/+) or cPLA2ζ (MLFζ+/+), and knock-out cPLA2α (MLFα−/−) or cPLA2ζ (MLFζ−/−), mice using lung tissue explants as previously described (38). Primary MLF were used between 4 and 6 passages. SV40 immortalized MLFα (IMLFα+/+ and IMLFα−/−) were generated as previously described (39). MLF (0.5 × 10⁴ cells/cm2) and IMLF (1.25 × 10⁴ cells/cm2) were plated in 250 μl of DMEM containing 10% FBS, 0.1% nonessential amino acids, 1 mm sodium pyruvate, 100 units/ml of penicillin, 100 μg/ml of streptomycin, 0.29 mg/ml of glutamine (growth media) in 48-well plates. After incubation for 24 (MLF) or 6 h (IMLF) in 5% CO2 at 37 °C, cells were washed with, and incubated in, serum-free DMEM (250 μl) containing 0.1% BSA (stimulation media) and 0.1 μCi of [3H]arachidonic acid, [3H]oleic acid, or [14C]linoleic acid. Cells were incubated overnight, washed twice, and fresh stimulation media added. Cells were stimulated with 1 μg/ml of A23187 for 30 min or for the times indicated. In experiments to determine the effect of H2O2 on fatty acid release and cell death, MLF were incubated in stimulation media containing 0.1 μCi of [3H]arachidonic acid for 6 h, washed, and then treated with 1 mm H2O2 for 18 h. Inhibitors were added 30 min before stimulation or as indicated.
To measure the amount of fatty acid released, the culture medium was collected after stimulation, centrifuged for 10 min at 13,000 × g, and the radioactivity in the supernatant determined. Floating cells recovered in the pellet after centrifuging the culture medium were solubilized with 0.1% Triton X-100 and combined with the adherent cells remaining in the well to determine the total cell-associated radioactivity. The amount of [3H]arachidonic acid released into the culture media was calculated as a percentage of total radioactivity (cells plus media) in each well. In separate control experiments, the culture medium was extracted according to Bligh and Dyer (40), and the radioactivity was confirmed to migrate as free fatty acid when analyzed by thin-layer chromatography (41).
Cell Death Assays
As a measure of cell death the level of LDH released into the culture medium was determined. The culture medium collected from the fatty acid release assays after centrifugation as described above was assayed (50 μl) using the Cyto-Tox ONE homogeneous membrane integrity assay kit (Promega) according to the manufacturer's protocol using an LS55 spectrofluorometer (PerkinElmer Life Sciences). The level of LDH released into the medium was expressed as a percentage of total cellular LDH. Cell death was also evaluated using propidium iodide staining. IMLFα−/− were stimulated with A23187 for the times indicated followed by staining with 0.5 μg/ml of propidium iodide. Images were captured on a Marianas 200 spinning disk confocal microscope using 561/617 nm excitation/emission using Intelligent Imaging Innovation Inc. (3I) software (Slidebook 5.0).
Silencing of Abhd6
Retroviral plasmids (pGFP-V-RS) containing four Abhd6 specific or scrambled negative control (TR30013) shRNAs were prepared as described by the manufacturer's protocol (Origene). To produce retroviruses, Gryphon retroviral packaging cells (Allele Biotechnology) were transfected with retroviral expression plasmids using Lipofectamine 2000 and incubated for 48 h. The culture media containing the retroviruses were collected and centrifuged at 2000 × g for 5 min. IMLFα−/− were incubated in the culture media containing the retroviruses and stable cell lines expressing shRNAs were selected using 10 μg/ml of puromycin according to the manufacturer's protocol. The most effective shRNA for silencing Abhd6 was identified (GI570346) by comparing levels of Abhd6 mRNA using real-time PCR. Clones were isolated by limiting dilution and knockdown confirmed by real-time PCR and by ABPP assay for determining ABHD6 activity in membrane proteomes as described below.
ABPP Assay for ABHD6
IMLFα−/− were plated at 1 × 10⁴ cells/cm2 in growth media, incubated for 24 h in 5% CO2 at 37 °C, then washed and incubated overnight in serum-free DMEM containing 0.1% BSA. Cells were treated with inhibitors KT109, KT195, or pyrrophenone for 30 min at 37 °C, washed twice with ice-cold PBS, then harvested and lysed in PBS by sonication at 4 °C. Lysates were centrifuged at 100,000 × g at 4 °C for 1 h. The membrane pellet (proteome) was resuspended in PBS by sonication and the protein concentration was determined by BCA assay. Proteome samples (50 μg of protein in 50 μl of total reaction volume) were incubated with 1 μm HT-01 for 30 min at 37 °C. In some experiments the proteomes were prepared from untreated cells and then incubated with inhibitors in vitro prior to adding the probe. SDS-PAGE loading buffer was added and the samples boiled for 10 min. After separation by SDS-PAGE (10% acrylamide), bands were visualized by in-gel fluorescence scanning using a Typhoon FLA 9500 (GE Healthcare).
Real-time PCR
RNA was isolated from MLF and IMLF, treated with DNase to remove contaminating genomic DNA, and cDNA generated using 1 μg of RNA. PCR contained 10 μl of 2× TaqMan fast universal master mixture, 1 μl of 20× TaqMan assay/probe, and 9 μl of cDNA (75–100 ng) in RNase-free water. The Thermal Fast cycle program was: 20 s at 95 °C followed by 40 cycles of 1 s at 95 °C and 20 s at 60 °C using the StepOne Plus real-time PCR system (Applied Biosystems). Triplicate reactions were analyzed for each sample. TaqMan assay probes to determine mRNA expression for the enzymes monoglyceride lipase (MGLL) (Mgll Mm 00449274_m1), β-glucuronidase (Gusb Mm01197698_ml), and ABHD6 (Abhd6 Mm00481199_ml) were used. The housekeeping gene Gusb was used for normalization. For analysis of Mgll expression a calibrator containing a mixture of RNA from IMLFα+/+ and IMLFα−/−, or MLFα+/+ and MLFα−/−, was also used for normalization. Threshold cycle values (CT) were determined and used for 2ΔΔCT analysis of relative gene expression (42).
Calcium Imaging
IMLFα−/− were plated at 1 × 10⁴ cells/cm2 in growth media in glass-bottomed MatTek plates and incubated overnight. Cells were loaded at 37 °C with Fura Red-AM (5 μm) for 15 min to measure cytosolic calcium, and with Rhod-2-AM (1 μm) together with MitoTracker Green (0.5 μm) for 10 min to measure the mitochondrial calcium, in the presence of 0.02% pluronic acid F-127. After washing, cells were incubated for 30 min at 37 °C in phenol red-free stimulation medium containing 25 mm Hepes, pH 7.4, and 2 mm probenecid followed by incubation with inhibitors (or DMSO) for 30 min (or as indicated). After adding A23187 (1 μg/ml) images were captured every 5 s for Fura Red-loaded cells and every 20 s for Rhod-2-loaded cells. Microscopy was conducted at 37 °C on an inverted Zeiss 200M microscope driven by Intelligent Imaging Innovations Inc. (3I) software (Slidebook 4.2). For cytosolic calcium analysis, fluorescence of Fura Red was recorded for bound/unbound calcium fluorescence intensities during consecutive 400-ms pulses using 403/490 nm excitation and 660 nm emission. The ratio of fluorescence at each time point (Rt) from cells excluding the nucleus was calculated after correcting for background fluorescence. Fluorescence data (Rt/R0) represents the fold-increase at Rt relative to the ratio of fluorescence at time 0 (R0) set at 1. For mitochondrial calcium analysis, the fluorescence of Rhod-2 was recorded during consecutive 500-ms pulses at 550/590 nm excitation/emission. Rhod-2 fluorescence was analyzed by selecting regions of interest where MitoTracker Green and Rhod-2 co-localized (43). Fluorescence intensity at each time (Ft) was calculated after correcting for background and differential bleaching. Fluorescence data (Ft/F0) represents the fold-increase at Ft relative to the fluorescent value at time 0 (F0) set at 1.
For measuring mitochondrial calcium uptake in permeabilized IMLFα−/−, the cells were loaded with 1 μm Rhod-2-AM and 0.5 μm MitoTracker Green in extracellular buffer (10 mm Hepes, 140 mm NaCl, 5 mm KCl, 1 mm MgCl2, 2 mm CaCl2, 10 mm glucose, pH 7.2) for 15 min at room temperature. Cells were washed then permeabilized with 3 μm digitonin for 90 s at room temperature in an intracellular buffer (20 mm Hepes, 1 mm K2HPO4, 130 mm KCl, 10 mm NaCl, 1 mm ATP, 0.02 mm ADP, 2 mm succinic acid, 2 mm MgCl2, 0.25 mm EGTA, pH 6.8). Cells were washed and incubated in intracellular buffer with inhibitors for 10 min at 37 °C and then CaCl2 was added to achieve 300 μm free calcium (calculated using the MAXCHELATOR Ca2+-EGTA calculator program). Images were captured every 20 s to monitor changes of mitochondrial calcium.
Calcein Assay for Determining MPTP Formation
IMLFα−/− were plated at 1 × 10⁴ cells/cm2 in glass-bottomed MatTek plates and MLF were plated at 0.5 × 10⁴ cells/cm2 in 35-mm dishes in growth media. After incubation for 6 (IMLFα−/−) or 24 h (MLF), cells were washed and incubated in stimulation media overnight (IMLF) or 6 h (MLF), and then loaded for 30 min with 5 μm calcein-AM in the presence of 0.02% pluronic F-127. Cells were washed, incubated for 60 min at 37 °C, and then stimulated with A23187 for 30 min, or 1 mm H2O2 for 18 h, at 37 °C followed by incubation in 1 mm CoCl2 for 15 min to quench cytosolic calcein fluorescence. Images were taken using a Marianas 200 spinning disk confocal microscope (488 nm/525 nm excitation/emission) using Intelligent Imaging Innovations Inc. (3I) software (Slidebook 5.0).
Calcium Uptake and Swelling Assays in Isolated Mitochondria
Mitochondria were prepared as described previously (44). Confluent IMLFα−/− (10, 150-mm dishes) were trypsinized and washed with PBS. Cells were homogenized in mitochondria isolation buffer (225 mm mannitol, 75 mm sucrose, 0.1 mm EGTA, 30 mm Tris-HCl, pH 7.4) with a Teflon homogenizer and the homogenate was centrifuged for 5 min at 600 × g at 4 °C. The supernatant was collected and centrifuged for 10 min at 7,000 × g. The pellet was resuspended in mitochondrial isolation buffer without EGTA and centrifuged for 10 min at 12,000 × g. The mitochondrial pellet was resuspended in isolation buffer and protein content was determined. Mitochondrial calcium uptake was assayed by monitoring the decrease in extramitochondrial calcium using the fluorescent indicator Calcium Green-5N. Isolated mitochondria (0.1 mg/ml) were incubated in 100 μl of assay buffer (5 mm MOPS, 120 mm KCl, 5 mm KH2PO4, 5 mm glutamate, 5 mm malate, 5 mm succinate, pH 7.4) containing 1 μm Calcium Green-5N. After addition of calcium (25 μm) changes in fluorescence at 488/532 nm excitation/emission were measured. Mitochondrial swelling that occurs during calcium-induced MPTP formation in isolated mitochondria was assayed by monitoring a decrease in mitochondrial light scattering. Isolated mitochondria were incubated in 200 μl of assay buffer and the decrease in absorbance at 530 nm to measure swelling was monitored after addition of calcium (25 μm). To test the effect of inhibitors on calcium uptake and swelling, mitochondria were incubated with inhibitors for 5 min before calcium addition. Recordings were made every 1 min at room temperature in 96-well plates using a Wallac Victor2 1420 Multilabel Counter. Assays were adapted from protocols as described (45).
Statistical Analysis
Statistics were calculated in GraphPad using unpaired t test to obtain two-tailed p values.
RESULTS
Arachidonic Acid Release That Accompanies A23187-stimulated Necrotic Cell Death in Lung Fibroblasts Is Not Mediated by cPLA2α or iPLA2
MLF isolated from cPLA2α+/+ and cPLA2α−/− mice, then immortalized with SV40 (IMLF), were used to investigate if cPLA2α activation and arachidonic acid release regulate necrotic cell death. IMLFα+/+ and IMLFα−/− were treated with the calcium ionophore A23187, which is a well described inducer of necrotic cell death due to cellular calcium overload and MPTP formation resulting in plasma membrane rupture and LDH release (10, 46). We previously reported that A23187 stimulated [3H]arachidonic acid release from IMLFα+/+ and to a lesser extent from IMLFα−/−, but we had not monitored cell death (38). A23187 stimulated release of LDH to a similar extent in IMLFα+/+ and IMLFα−/− excluding a role for cPLA2α (Fig. 1a). CsA and chelating extracellular calcium with EGTA inhibited LDH release in both cell lines consistent with a role for cyclophilin D-dependent MPTP formation due to calcium overload (Fig. 1a). CsA also inhibited arachidonic acid release from IMLFα+/+ and to a slightly greater extent from IMLFα−/− (Fig. 1b). The effect of A23187 concentration and incubation time on arachidonic acid release and cell death was determined to further probe the relationship between these processes in IMLFα−/−. There was a concentration dependent increase in arachidonic acid release from IMLFα−/− that correlated with LDH release (Fig. 1c). The time course of arachidonic acid release also correlated with LDH release occurring most rapidly from 10 to 30 min after addition of A23187 (Fig. 1d). Similar results were also obtained with the calcium ionophore, ionomycin (data not shown). The data suggest that A23187-stimulated cell death and arachidonic acid release in lung fibroblasts requires extracellular calcium and is mediated by cyclophilin-D-dependent MPTP formation but does not involve cPLA2α.
FIGURE 1.

A23187 induces necrotic cell death and [3H]arachidonic acid release independent of cPLA2α. Release of LDH (a) and [3H]arachidonic acid (b) from IMLFα+/+ (open bars) and IMLFα−/− (black bars) stimulated with A23187 (1 μg/ml) for 30 min was determined. Cells were treated with CsA or incubated in medium containing EGTA, for 30 min prior to stimulation with A23187. The results are from 3 independent experiments ± S.E. (p < 0.0001 when compared with A23187 stimulated IMLFα+/+ (*) or IMLFα−/− (**) without inhibitors). c, the release of [3H]arachidonic acid correlates with LDH release as a function of A23187 concentration in IMLFα−/− stimulated for 30 min. d, A23187 induced a time-dependent release of [3H]arachidonic acid and LDH from IMLFα−/−. The results are from 3 independent experiments ± S.E.
Serine Hydrolase Inhibitors Block Arachidonic Acid Release, MPTP Formation, and Cell Death
We previously reported that arachidonic acid release from A23187-stimulated IMLFα−/− was unexpectedly inhibited by two structurally different cPLA2α inhibitors (pyrrophenone and Wyeth-1) (41). These serine hydrolase inhibitors also blocked LDH release from A23187-stimulated IMLFα−/−, but the iPLA2 inhibitor bromoenolactone was ineffective (Fig. 2a). We investigated the effect of the inhibitors on A23187-stimulated MPTP formation using an established method that monitors calcein fluorescence in mitochondria (47). Cells are loaded with calcein-AM, which is de-esterified in the cytosol and then diffuses into cellular organelles including the mitochondria. Cobalt is added, which quenches calcein fluorescence in all compartments except the mitochondria where it is excluded. When MPTP forms, cobalt gains access to the mitochondria and quenches calcein fluorescence. As shown in Fig. 2b, there was a decrease in mitochondrial calcein fluorescence in A23187-treated IMLFα−/−, consistent with MPTP formation, which was inhibited by pyrrophenone, Wyeth-1, and CsA. The bright field images show the effect of A23187 on cell morphology consistent with cell death and protection by inhibitors that block MPTP formation. Wyeth-1 inhibited release of arachidonic acid and LDH at 10 μm but it was a weaker inhibitor (IC50 ∼4 μm) than pyrrophenone (IC50 ∼0.5 μm) and it was not further used.
FIGURE 2.
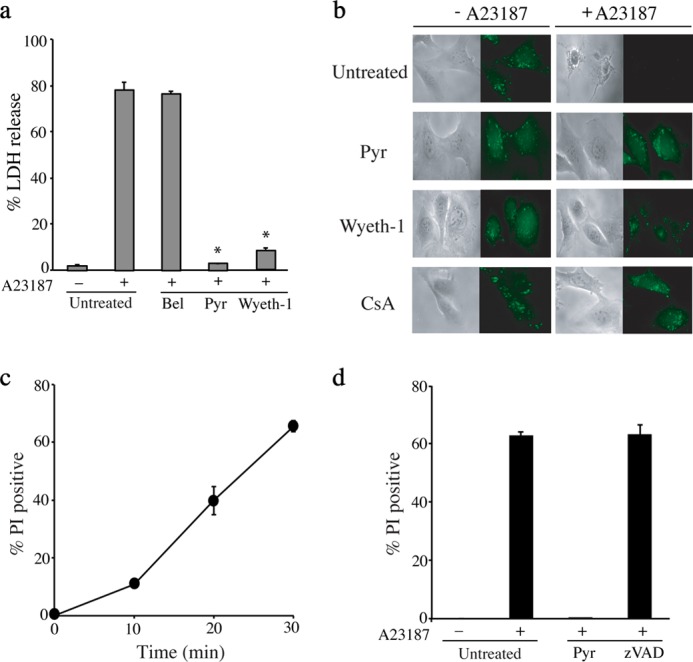
A23187-stimulated MPTP formation and cell death in IMLFα−/− are blocked by pyrrophenone and Wyeth-1 but not bromoenolactone or Z-VAD(OMe)-fmk. a, IMLFα−/− incubated with DMSO (untreated), 10 μm pyrrophenone (Pyr), Wyeth-1, or bromoenolactone (Bel) for 30 min were stimulated with A23187 for 30 min and LDH release was determined (n = 3 ± S.E., *, p < 0.0001 when compared with A23187-stimulated IMLFα−/− without inhibitors). b, calcein-labeled IMLFα−/− were treated with vehicle (DMSO), or 10 μm Pyr, Wyeth-1, or CsA for 30 min and then stimulated with A23187 for 30 min. After adding cobalt, fluorescence microscopy was used to monitor calcein fluorescence in the mitochondria, and bright field microscopy was used to evaluate cell integrity. Images are from a representative experiment and results confirmed in 3 independent experiments. c, IMLFα−/− stimulated with A23187 for the times indicated were stained with propidium iodide (PI). d, IMLFα−/− were treated with vehicle, 2 μm Pyr, or 100 μm Z-VAD(OMe)-fmk for 30 min and then stimulated with A23187 for 30 min followed by staining with PI. The results in c and d are the average % PI-stained cells from 3 independent experiments ±S.E.
Cell death was also evaluated by staining IMLFα−/− with the vital dye propidium iodide, which is taken up by cells when the integrity of the plasma membrane is disrupted. There was an increase in propidium iodide staining after A23187 treatment that occurred over a similar time frame as the release of LDH (Fig. 2c). Propidium iodide staining was inhibited by pyrrophenone but was not affected by the pan-caspase inhibitor Z-VAD(OMe)-fmk (Fig. 2d). The rapid induction of LDH release and propidium iodide staining, and lack of caspase involvement, suggests that A23187 induces primary necrosis and not secondary necrosis following apoptosis.
A23187-stimulated Cell Death in Primary Lung Fibroblasts Is Not Mediated by cPLA2α or cPLA2ζ
The cell death pathway was also induced by A23187 in primary lung fibroblasts from cPLA2α+/+ (MLFα+/+) and cPLA2α−/− mice (MLFα−/−) (Fig. 3a). A23187 stimulated more arachidonic acid release from MLFα+/+ than MLFα−/−, but similar levels of LDH release, which were inhibited by CsA and pyrrophenone. The results indicate that cPLA2α contributes to A23187-stimulated arachidonic acid release but not cell death. We previously reported that pyrrophenone inhibits mouse GIVF cPLA2ζ, which has similar specific activity, inhibitor sensitivity, and calcium dependence as cPLA2α (41). cPLA2ζ−/− mice were generated and a comparison of MLFζ+/+ and MLFζ−/− showed no differences in the amount of arachidonic acid and LDH release, or responses to pyrrophenone and CsA, ruling out a role for cPLA2ζ (Fig. 3b). A comparison of MLF from wild type and cPLA2α/cPLA2ζ double knock-out mice additionally confirmed that these PLA2s do not mediate cell death induced by A23187 (data not shown).
FIGURE 3.

A23187-stimulated cell death and [3H]arachidonic acid release occur in primary MLF and are not mediated by cPLA2ζ. a, MLFα+/+ (open bars) and MLFα−/− (black bars), or b, MLFζ+/+ (open bars) and MLFζ−/− (black bars), were stimulated with A23187 for 30 min and [3H]arachidonic acid (left panels) and LDH (right panels) release was determined. Cells were treated with CsA or pyrrophenone (Pyr) for 30 min prior to stimulation with A23187. The results in a are from 3 independent experiments ± S.E. (*, p < 0.05 when compared with A23187-stimulated MLFα+/+ without inhibitors; and **, p < 0.05 when compared with A23187-stimulated MLFα−/− without inhibitors). The results in b are the average of 2 independent experiments.
Effect of Pyrrophenone and the Triazole Urea Inhibitor KT195 on A23187-stimulated Arachidonic Acid Release and Cell Death
An alternative pathway for arachidonic acid release involves the hydrolysis of arachidonic acid from the endocannabinoid 2-arachidonylglycerol by MGLL (48). This pathway is initiated by activation of diacylglycerol (DAG) lipases that hydrolyze the sn-1 acyl chain of DAG to form 2-arachidonylglycerol (49). Real-time PCR revealed that MLFα−/− and IMLFα−/− expressed higher levels of Mgll than cells expressing cPLA2α perhaps reflecting a compensatory response (Fig. 4a). We tested inhibitors of MGLL (KML29) and ABHD6 (KT195), another enzyme that hydrolyzes 2-arachidonylglycerol, to determine whether these serine hydrolases mediated A23187-stimulated arachidonic acid release from IMLF−/− (37, 50). The most effective inhibitors were the triazole urea ABHD6 inhibitor KT195 (IC50 ∼ 0.7 μm) (Fig. 4b), and pyrrolidine-containing inhibitor pyrrophenone (IC50 ∼ 0.5 μm) (Fig. 4c). Inhibition of arachidonic acid release and LDH release displayed very similar does responses. The MGLL inhibitor (KML29) had little effect on LDH and arachidonic acid release (Fig. 4b).
FIGURE 4.

Serine hydrolase inhibitors block A23187-stimulated release of arachidonic acid and LDH. a, relative expression of Mgll in MLFα+/+, MLFα−/−, IMLFα+/+, and IMLFα−/− was determined by real-time PCR as described under “Experimental Procedures.” The results for MLF are the average of 3 independent experiments ± S.E. Expression of Mgll (*, p < 0.0001) was significantly higher in MLFα−/− than MLFα+/+. The results for IMLF are the average of 2 independent experiments. b and c, release of [3H]arachidonic acid (solid symbols) and LDH (open symbols) from IMLFα−/− was determined 30 min after stimulation with A23187. Cells were treated with the indicated concentrations of (b) KML29 or KT195, and (c) pyrrophenone (Pyr) or pyrrophenone-OH (Pyr-OH) for 30 min prior to stimulation with A23187 (n = 3 ± S.E., *, p < 0.05 compared with A23187-stimulated IMLFα−/− without inhibitors). d, release of [3H]arachidonic acid from IMLFα+/+ was determined 10 min after stimulation with 5% serum. Cells were treated with the indicated concentrations of Pyr or Pyr-OH 30 min prior to serum stimulation (n = 3 ± S.E. *, p < 0.0001 compared with serum-stimulated IMLFα+/+ without inhibitors).
Pyrrophenone likely inhibits cPLA2α via formation of a hemiketal between its ketone carbonyl and the active site serine of the enzyme based on the ability of polarized ketones to form stable hemiketals with serine proteases and esterases (51–53). To provide support for this mechanism we tested the effect of pyrrophenone-OH in which the ketone was reduced to the secondary alcohol. Serum-stimulated arachidonic acid release from IMLFα+/+, which is mediated by cPLA2α (41), was poorly inhibited by pyrrophenone-OH compared with pyrrophenone (IC50 0.05 μm) (Fig. 4d). Similarly pyrrophenone-OH was ineffective at blocking cell death and arachidonic acid release from IMLFα−/− (Fig. 4c). The results suggest that pyrrophenone acts to prevent cell death by targeting a serine at the active site of an esterase or amidase.
ABPP assays were carried out to determine whether there was a correlation between concentrations of KT195 and pyrrophenone that inhibited cell death and arachidonic acid release, with concentrations that inhibited ABHD6 in cells. IMLFα−/− were treated with KT195 and pyrrophenone, followed by preparation of membrane proteomes that were probed with BODIPY-labeled HT-01 to detect ABHD6 (37). The effect of the inhibitors added directly to the proteome in vitro was also tested. The ABPP assay in IMLFα−/− proteome showed strong reactivity of ABHD6 (∼35 kDa) with the BODIPY-labeled HT-01 probe detected by in-gel fluorescence scanning (Fig. 5, a and b). Pyrrophenone added in situ or added to the proteome in vitro prior to adding the probe did not block the binding of HT-01 to ABHD6 indicating that it does not inhibit this serine hydrolase (Fig. 5a). However, binding of HT-01 to ABHD6 was completely blocked by pre-treating IMLFα−/− with 0.2–2 μm KT195 in situ (Fig. 5b), which is not unexpected because the IC50 of KT195 for ABHD6 in other cells is less than 0.2 μm (37). When added directly to the proteome in vitro KT195 showed a dose-dependent inhibition of HT-01 binding to ABHD6 with an IC50 of ∼25 nm (Fig. 5b). The fact that 0.2 μm KT195, and even higher concentrations of KML29, had little effect on release of arachidonic acid and LDH from IMLFα−/− suggests that neither MGLL nor ABHD6 play a role in mediating arachidonic acid release and cell death in IMLFα−/− in response to A23187.
FIGURE 5.

ABHD6 does not regulate A23187-induced cell death. The ability of pyrrophenone (Pyr) (a) or KT195 (b) to bind ABHD6 was determined by competitive ABPP assay of proteomes from IMLFα−/− prepared as described under “Experimental Procedures.” The serine hydrolase inhibitors were added at the indicated concentrations either to IMLFα−/− in situ prior to preparing membrane proteomes, or added to the proteomes in vitro, followed by incubation with BODIPY-labeled HT-01 probe. Bands were visualized on SDS-polyacrylamide gels by in-gel fluorescence scanning. A representative experiment of 2–3 independent experiments is shown. c, knockdown of Abhd6 mRNA was determined by real-time PCR analysis of RNA from IMLFα−/− stably expressing Abhd6 shRNA or scrambled negative control. d, knockdown of ABHD6 protein was determined by competitive ABPP assay of membrane proteomes from IMLFα−/− stably expressing control or Abhd6 shRNA. The relative amount of BODIPY-labeled HT-01 probe binding to ABHD6 was determined by measuring the intensity of the fluorescent signal of the ABHD6 band on SDS-polyacrylamide gels using ImageQuant TL software (GE Healthcare) and expressed as the % of control. Results from two independent experiments (E1 and E2) are shown. e, IMLFα−/− stably expressing control or Abhd6 shRNA were treated with 2 μm Pyr or 2 μm KT195 for 30 min, stimulated with A23187 for 30 min, and then the release of [3H]arachidonic acid and LDH was determined. The results are from 3 independent experiments ± S.E.
Further evidence that ABHD6 does not mediate A23187-stimulated fatty acid release and cell death was provided by results using shRNA knockdown of Abhd6 (Fig. 5). We selected stable clones of IMLFα−/− after transfection with retrovirus containing Abhd6 shRNA and identified a clone with significant reduction (∼70%) in Abhd6 mRNA expression compared with a clone expressing control shRNA (Fig. 5c). ABPP assays of proteomes from control and Abhd6 shRNA clones showed 70–80% decrease in BODIPY-labeled HT-01 binding compared with control consistent with reduced levels of ABHD6 protein in the Abhd6 shRNA clone (Fig. 5d). Despite ABHD6 knockdown, A23187-stimulated LDH and arachidonic acid release were not significantly different in control and Abhd6 shRNA expressing IMLFα−/− and both were similarly inhibited by pyrrophenone and KT195 (Fig. 5e). The results suggest that ABHD6 does not play a role in mediating A23187-stimulated cell death and fatty acid release. However, these experiments led to the identification of the triazole urea compound KT195 as another serine hydrolase inhibitor, in addition to pyrrophenone, which blocks A23187-stimulated cell death.
Serine Hydrolase Inhibitors Block Mitochondrial Calcium Uptake
To understand how pyrrophenone and KT195 block MPTP formation and cell death, we investigated their effect on regulating calcium mobilization in the cytosol and mitochondria of A23187-stimulated IMLFα−/− by live-cell imaging. Pyrrophenone (2 μm) partially lowered increases in cytosolic calcium induced by A23187 (Fig. 6a, left panels). A23187 also stimulated an increase in mitochondrial calcium that began at ∼2 min, peaked at ∼7–12 min, and then decreased by 15 min (Fig. 6a, right panel, solid lines). Pyrrophenone completely blocked the increase in mitochondrial calcium induced by A23187 (Fig. 6a, right panel, hatched lines). Similar effects on cytosolic and mitochondrial calcium were obtained with KT195 (Fig. 6b). We investigated the effect of washing the cells after the 30-min preincubation with pyrrophenone prior to adding A23187. Following washout of pyrrophenone, the increase in mitochondrial calcium was delayed for ∼10 min after addition of A23187 but increased at 15–20 min to levels seen in A23187-stimulated cells not treated with inhibitor (Fig. 6c). Similar results were obtained with KT195 (data not shown). The washed cells were not protected from cell death, and released LDH and arachidonic acid 30 min after A23187 (Fig. 6d). The results show a direct correlation between mitochondrial calcium loading, cell death, and arachidonic acid release.
FIGURE 6.

Serine hydrolase inhibitors block mitochondrial calcium uptake. IMLFα−/− were loaded with Fura Red-AM to measure changes in cytosolic calcium or with Rhod-2-AM/MitoTracker to measure mitochondrial calcium. Cells were treated with 2 μm pyrrophenone (a) or KT195 (b) for 30 min prior to stimulation with A23187. For cytosolic calcium measurements two independent experiments (E1 and E2) are shown in separate panels, and for mitochondrial calcium 3 independent experiments each represented by different color lines are shown. The line traces are the average fold-changes in cytosolic or mitochondrial calcium over time after adding A23187 (time 0) from five individual cells treated with (hatched lines) or without (solid lines) inhibitors. c, IMLFα−/− were loaded with Rhod-2-AM/MitoTracker to measure mitochondrial calcium. Cells were treated with DMSO (solid lines) or 2 μm pyrrophenone (hatched lines) for 30 min, then washed to remove the inhibitor prior to stimulation with A23187 (0 time). The results show 2 independent experiments represented by different color lines. The line traces are the average fold-changes in mitochondrial calcium over time after adding A23187 from five individual cells. d, IMLFα−/− were incubated with 2 or 10 μm pyrrophenone (Pyr) or KT195 for 30 min at which time cells were either washed or not washed to remove the inhibitor. Cells were then stimulated with A23187 for 30 min and the release of [3H]arachidonic acid (left panel) or LDH (right panel) was determined (n = 3 ± S.E.). Results are from 3 independent experiments.
The results suggest that pyrrophenone and KT195 inhibit MPTP formation and cell death by preventing mitochondrial calcium overload, which has been shown to occur in cells treated with calcium ionophores through the MCU (46). As an alternative approach for inducing mitochondrial calcium loading and investigating the effect of pyrrophenone, digitonin-permeabilized IMLFα−/− were used. This approach also provided a system to test the effect of the MCU inhibitor RU360, which is not permeable in many cell types (54, 55). Incubating permeabilized IMLFα−/− in intracellular buffer containing calcium induced an increase in mitochondrial calcium, which was inhibited by pyrrophenone and by RU360 (Fig. 7a). We also measured calcium uptake and MPTP formation in isolated mitochondria from IMLFα−/− to determine whether the serine hydrolase inhibitors had a direct effect on mitochondria. Isolated mitochondria incubated in buffer containing the calcium indicator Calcium Green-5N showed calcium uptake as measured by a decrease in Calcium Green-5N fluorescence in the buffer (Fig. 7b). Calcium uptake was completely blocked by the MCU inhibitor RU360 but was not blocked by pyrrophenone, KT195, or CsA.
FIGURE 7.

Pyrrophenone blocks mitochondrial calcium uptake in permeabilized cells but not in isolated mitochondria. a, IMLFα−/− were loaded with Rhod-2-AM/MitoTracker and permeabilized with digitonin in intracellular buffer as described under “Experimental Procedures.” After incubation with inhibitors for 10 min, calcium was added and then images were captured every 20 s to monitor changes of mitochondrial calcium. The line traces are the average fold-changes in mitochondrial calcium over time after adding calcium (time 0) from five individual cells treated with 2 μm pyrrophenone (red hatched lines), 2 μm RU360 (blue hatched lines), or without inhibitors (black solid lines). The results from 3 independent experiments each represented by different line colors are shown. b, to measure calcium uptake, isolated mitochondria were incubated in buffer containing Calcium Green-5N (CaG5N) and treated with DMSO (black), 2 μm pyrrophenone (Pyr) (red), 2 μm CsA (yellow), 2 μm KT195 (green) (inset), or 1 μm RU360 (blue) for 5 min. After addition of calcium (25 μm) to the buffer (0 time), the extramitochondrial CaG5N fluorescence peaks in ∼1–2 min followed by a decrease in fluorescence due to mitochondrial calcium uptake. CaG5N fluorescence is normalized to the peak value (set at 1). The results of a representative experiment are shown. c, to measure MPTP formation (swelling), isolated mitochondria were incubated with DMSO (black), 2 μm Pyr (red), 2 μm CsA (yellow), 2 μm KT195 (green), or 1 μm RU360 (blue). Calcium (25 μm) was added (0 time) and absorbance at 530 nm was measured at 1-min intervals. The gray line shows absorbance at 530 nm of mitochondria incubated without calcium. The effect of the inhibitors on mitochondrial swelling 10 min after adding calcium relative to control mitochondria treated with calcium but without inhibitors (set at 100%) is shown in the bar graph (n = 3, S.E., *, p < 0.05).
MPTP formation in isolated mitochondria triggered by addition of calcium (25 μm) to the buffer was assayed by measuring absorbance at 530 nm, which decreases due to swelling of the mitochondria. A decrease in absorbance occurred for 15 min after adding calcium, which was blocked by RU360 and CsA, but not by pyrrophenone or KT195 (Fig. 7c). There was a significant reduction in calcium-induced mitochondrial swelling by RU360 and CsA as shown for the 10-min time point (Fig. 7c, bar graph). The data indicate that mitochondrial calcium uptake occurred through the MCU and triggered cyclophilin D-dependent MPTP formation. However, the serine hydrolase inhibitors did not have a direct effect on blocking calcium uptake in isolated mitochondria in contrast to the results using intact or permeabilized cells. Pyrrophenone has also been shown not to inhibit calcium-induced swelling of isolated mitochondria from mouse liver (31).
CaMKII Regulates Cell Death
We also tested the effect of CaMKII inhibitors on A23187-stimulated cell death and arachidonic acid release because CaMKII phosphorylates and enhances MCU function (20). The CaMKII inhibitors KN93, but not the inactive control KN92, and autocamtide dose dependently inhibited LDH and arachidonic acid release from IMLFα−/− stimulated with A23187 (Fig. 8, a and b). Using the calcein assay to monitor MPTP formation we found that autocamtide prevented the loss of calcein fluorescence from IMLFα−/− treated with A23187 suggesting that it inhibited cell death and arachidonic acid release by blocking MPTP formation (Fig. 8c). The results suggest that pyrrophenone inhibits cell death by blocking calcium uptake in IMLFα−/− that is mediated by the MCU and is regulated by CaMKII (see Fig. 12).
FIGURE 8.

CaMKII inhibitors block A23187-stimulated arachidonic acid release, LDH release, and MPTP formation. IMLFα−/− were incubated with the indicated concentrations of the CaMKII inhibitors KN93 (a) (or KN92 control, hatched lines) or autocamtide (b) for 30 min. Cells were stimulated with A23187 for 30 min and the release of [3H]arachidonic acid (solid symbols) and LDH (open symbols) was determined (n = 3 ± S.E., *, p < 0.001 compared with A23187-stimulated IMLFα−/− without inhibitors). c, calcein-labeled IMLFα−/− were treated with 10 μm autocamtide or vehicle (untreated) for 30 min, and then stimulated with or without A23187 for 30 min. After adding cobalt, fluorescence microscopy was used to monitor calcein fluorescence in the mitochondria. Images are from a representative experiment and results confirmed in 2 independent experiments.
Cell Permeant DAG Analog Blocks A23187-stimulated Cell Death
Mitochondrial calcium is also regulated by DAG as shown in studies using the cell permeable DAG analog, OAG (56, 57). We found that OAG inhibited release of arachidonic acid and LDH from IMLFα−/− stimulated with A23187 (Fig. 9a). The decrease of calcein fluorescence from A23187-stimulated IMLFα−/− was blocked by OAG suggesting it prevented MPTP formation (Fig. 9b). OAG also inhibited A23187-stimulated LDH release from IMLF+/+ (Fig. 9c, right panel). However, in contrast to IMLF−/−, OAG increased arachidonic acid release in IMLFα+/+ treated with and without A23187 (Fig. 9c, left panel), which is likely due to the ability of OAG to activate PKC, a known activator of cPLA2α (58–60). This is consistent with our previous findings that the PKC activator phorbol 12-myristate 13-acetate stimulates arachidonic acid release from IMLFα+/+ and enhances responses to A23187 (38). However, in contrast to OAG, phorbol 12-myristate 13-acetate treatment of IMLFα−/− did not block the release of arachidonic acid or LDH in response to A23187.3 Experiments were carried out to determine whether OAG blocked cell death in response to A23187 by inhibiting mitochondrial calcium uptake. In contrast to the serine hydrolase inhibitors, OAG enhanced mitochondrial calcium in A23187-stimulated IMLFα−/− (Fig. 9d). A similar increase in mitochondrial calcium occurred when A23187-stimulated IMLFα−/− were treated with CsA (Fig. 9e). By targeting cyclophilin D, CsA blocks calcium leakage from the MPTP resulting in enhanced mitochondrial calcium levels (46). The results suggest that OAG has a direct effect on blocking MPTP formation.
FIGURE 9.

Effect of OAG on A23187-stimulated release of arachidonic acid, cell death, and mitochondrial calcium uptake. a, IMLFα−/− were incubated with the indicated concentrations of OAG for 5 min, stimulated with A23187 for 30 min, and the release of [3H]arachidonic acid (left panels) and LDH (right panels) was determined (n = 3 ± S.E., *, p < 0.05 compared with A23187-stimulated IMLFα−/− without inhibitors). b, calcein-labeled IMLFα−/− were treated with vehicle (DMSO) or 250 μm OAG for 5 min and then stimulated with A23187 for 30 min. After adding cobalt, fluorescence microscopy was used to monitor calcein fluorescence in the mitochondria. Images are shown from a representative experiment and results confirmed in 2 independent experiments. c, IMLFα+/+ were incubated with the indicated concentrations of OAG for 5 min, stimulated with A23187 for 30 min, and the release of [3H]arachidonic acid (left panels) and LDH (right panels) was determined (n = 3 ± S.E., **, p < 0.01 compared with A23187 stimulated IMLFα+/+ without inhibitors, *, p < 0.01 compared with unstimulated IMLFα+/+ without inhibitors). The effect of OAG (d) and CsA (e) on mitochondrial calcium uptake was determined in IMLFα−/− loaded with Rhod-2-AM/MitoTracker. Cells were treated with (hatched lines) or without (solid lines) 250 μm OAG or 10 μm CsA for 30 min then treated with A23187. As a control, the effect of OAG and CsA added to cells not treated with A23187 is shown (gray lines). Independent experiments are each represented by different color lines. The line traces are the average fold-changes over time in mitochondrial calcium from five individual cells after adding A23187 (time 0).
Fatty Acid Release Occurs during MPTP Formation
The ability of OAG and CsA to inhibit arachidonic acid release without blocking mitochondrial calcium uptake suggests that fatty acid release occurs during MPTP formation. This was tested by treating IMLFα−/− with a high concentration of thapsigargin, which induces MPTP formation by a direct effect on mitochondria that does not involve an increase in cytosolic calcium (61). Thapsigargin (20 μm) induced release of LDH and arachidonic acid from IMLFα−/− between 15 and 90 min after stimulation (Fig. 10a). A slightly lower concentration of thapsigargin (10 μm) was ∼50% as effective and concentrations (<1 μm) that inhibit SERCA had no effect (data not shown). Thapsigargin also stimulated release of oleic acid and linoleic acid from IMLFα−/− (Fig. 10b), as we previously reported for A23187-stimulated IMLFα−/− (41). However, unlike A23187, the release of arachidonic acid and LDH induced by thapsigargin was not inhibited by pyrrophenone, KT195, KN93, or EGTA (Fig. 10c). The iPLA2 inhibitor bromoenolactone also did not inhibit release of arachidonic acid or LDH. Importantly, the release of arachidonic acid and LDH stimulated by thapsigargin was inhibited by CsA (Fig. 10c) and OAG (Fig. 10d) suggesting that cell death induced by thapsigargin was due to MPTP formation. The results demonstrate that the serine hydrolase inhibitors prevent MPTP formation, fatty acid release, and cell death by blocking mitochondrial calcium loading but do not directly inhibit the enzyme responsible for fatty acid release that accompanies MPTP formation.
FIGURE 10.

Thapsigargin-induced cell death and arachidonic acid release are inhibited by CsA and OAG but not by pyrrophenone or EGTA. a, IMLFα−/− were treated with (circles) or without (triangles) 20 μm thapsigargin for the indicated times, and release of [3H]arachidonic acid (black symbols) and LDH (open symbols) was determined (n = 3 ± S.E.). b, IMLFα−/− labeled overnight with either [3H]oleic acid (18:1) or [14C]linoleic acid (18:2) were stimulated with (black bars) or without (open bars) 20 μm thapsigargin for 60 min and fatty acid release was determined (n = 3 ± S.E.). c, IMLFα−/− treated with CsA, bromoenolactone (Bel), EGTA, pyrrophenone (Pyr), KN93, or KT195 for 30 min were stimulated with 20 μm thapsigargin for 60 min and the release of [3H]arachidonic acid (left panel) and LDH (right panel) was determined (n = 3 ± S.E., *, p < 0.0001 compared with thapsigargin-stimulated IMLFα−/− without inhibitors). d, IMLFα−/− were incubated with the indicated concentrations of OAG for 5 min, stimulated with thapsigargin for 60 min and the release of [3H]arachidonic acid (left panels) and LDH (right panels) was determined (n = 3 ± S.E., *, p < 0.05 compared with thapsigargin-stimulated IMLFα−/− without OAG).
Serine Hydrolase Inhibitors Block Cell Death Induced by H2O2
To determine whether the serine hydrolase inhibitors blocked cell death trigged by other agents we tested their effect in fibroblasts treated with H2O2. A number of cell death pathways are triggered by H2O2 including necrotic cell death involving cyclophilin D-dependent MPTP formation (46, 62–64). The ability of H2O2 (1 mm) to stimulate release of arachidonic acid and LDH from primary MLFα+/+ and MLFα−/− was compared (Fig. 11). After stimulation for 18 h with H2O2, MLFα+/+ released more [3H]arachidonic acid (37%) due to the presence of cPLA2α than MLFα−/− (25%) (Fig. 11a). MLFα+/+ and MLFα−/− released similar levels of LDH in response to H2O2 indicating no role for cPLA2α in mediating cell death (Fig. 11a). All the inhibitors that blocked A23187-stimulated release of arachidonic acid and LDH including the serine hydrolase inhibitors (pyrophenone and KT195), the cyclophilin D inhibitor CsA, and the CaMKII inhibitor (KN93) blocked H2O2-stimulated arachidonic acid release from MLFα−/− (∼55%) and MLFα+/+ (36–44%) (Fig. 11a). Release of LDH from MLFα+/+ and MLFα−/− was also blocked (45–50%) by the inhibitors. The ability of CsA to inhibit H2O2-induced cell death suggested that it occurred in part due to cyclophilin D-dependent MPTP formation. There was a loss of calcein fluorescence from mitochondria in H2O2-stimulated MLFα−/− consistent with MPTP formation that was inhibited by pyrrophenone, KT195, CsA, and KN93 (Fig. 11b).
FIGURE 11.

Serine hydrolase inhibitors block release of arachidonic acid and LDH from MLF stimulated with H2O2. a, MLFα+/+ (open bar) or MLFα−/− (black bar) were stimulated with 1 mm H2O2 for 18 h and release of [3H]arachidonic acid (left panel) and LDH (right panel) was determined. Cells were treated with CsA, pyrrophenone (Pyr), KT195, or KN93 for 30 min prior to stimulation with H2O2. The results are from 3 independent experiments ± S.E. (p < 0.05 when compared with H2O2 stimulated MLFα+/+ (*) or MLFα−/− (**) without inhibitors). b, MLFα−/− were loaded with calcein prior to incubation with inhibitors for 30 min and then stimulated with 1 mm H2O2 for 18 h. The results are from 3 independent experiments ± S.E. (*, p < 0.0005 when compared with MLFα−/− without H2O2; **, p < 0.005 when compared with H2O2 stimulated MLFα−/− without inhibitors). Images showing the effect of inhibitors on calcein fluorescence in MLFα−/− treated with and without H2O2 (right panel) are from a representative experiment and results confirmed in 2 independent experiments.
DISCUSSION
This study describes a cell death pathway induced in mouse lung fibroblasts by A23187 with characteristics of primary necrosis involving rapid formation of MPTP due to calcium overload and plasma membrane rupture resulting in LDH release. There is a direct correlation between the release of LDH and fatty acids, which occurs at a later step after mitochondrial calcium loading and correlates with MPTP formation (Fig. 12). This is supported by data showing that CsA and OAG inhibit fatty acid release without blocking mitochondrial calcium uptake in response to A23187. By directly blocking MPTP formation, CsA and OAG actually enhance levels of mitochondrial calcium. In addition, micromolar concentrations of thapsigargin that directly trigger MPTP formation stimulate fatty acid release that is blocked by CsA. The mechanism involved in the direct induction of MPTP by thapsigargin is not known, but it is not dependent on extramitochondrial calcium and may be due to an increase in mitochondrial Ca2+ released from binding sites in the mitochondrial matrix (61). Our results in intact cells also suggest that thapsigargin induces MPTP independent of extramitochondrial calcium because it occurs when extracellular calcium is chelated with EGTA, and is not blocked by serine hydrolase inhibitors that prevent uptake of cytosolic calcium into the mitochondria.
A comparison of lung fibroblasts from wild type and knock-out mice demonstrated that fatty acid release that accompanies MPTP formation is not mediated by cPLA2α or cPLA2ζ. Several studies have strongly implicated iPLA2γ (PNPLA8) in regulating calcium-induced MPTP formation based on genetic ablation and use of the iPLA2γ enantioselective inhibitor R-bromoenolactone (28, 29, 31). However, we found that racemic bromoenolactone, which inhibits iPLA2γ (PNPLA8) and iPLA2β, did not inhibit A23187-induced MPTP formation or fatty acid release. Arachidonic acid released by cPLA2α has been suggested to mediate cell death and MPTP formation (32, 33). The comparison of A23187-stimulated IMLFα+/+ and IMLFα−/− showed no role for cPLA2α and no correlation in actual levels of arachidonic acid released with A23187-stimulated cell death. The results using OAG show that despite enhancing cPLA2α-mediated arachidonic acid release in IMLFα+/+, OAG-treated cells are protected from A23187-stimulated cell death. The ability of OAG and CsA to inhibit fatty acid release and necrotic cell death may reflect an important role for site-specific lipid hydrolysis in regulating MPTP formation. Identification of the enzyme responsible for fatty acid release is important for determining how mitochondrial membrane lipid changes regulate MPTP formation.
Our results have uncovered a novel pathway implicating a serine hydrolase in regulating mitochondrial calcium uptake. This is supported by results showing that reduction of the ketone carbonyl in pyrrophenone greatly reduced its ability to block A23187-stimulated cell death. In addition, mitochondrial calcium uptake in permeabilized cells mediated by the MCU, based on RU360 inhibition, is blocked by pyrrophenone. The inhibition by pyrrophenone occurred at concentrations often used (1–2 μm) to “selectively” inhibit cPLA2α complicating its use to investigate the role of cPLA2α in mediating calcium-induced arachidonic acid release. The other small molecule inhibitor that blocked cell death, KT195, is a derivative of 1,2,3-triazole urea that inhibits serine hydrolases by covalent, irreversible carbamoylation of the active site serine nucleophile (37, 65). The triazole ureas show promise for the development of selective serine hydrolase inhibitors (65). Other classes of serine hydrolase inhibitors were ineffective such as methyl-arachidonoyl fluorophosphonate (data not shown), which broadly targets a large number of serine hydrolases (66).
The serine hydrolase inhibitors block mitochondrial calcium uptake in cells stimulated with A23187 and in permeabilized cells but not in isolated mitochondria. Calcium uptake and MPTP formation (mitochondrial swelling) in isolated mitochondria were blocked by RU360 suggesting they were mediated by the MCU. A serine residue has been identified in the MCU as the site necessary for RU360 inhibition (22). The inability of pyrrophenone and KT195 to block MCU-mediated calcium uptake in isolated mitochondria suggests that they are not directly targeting serine residues in the MCU, and that the regulatory step targeted by the inhibitors is lost in isolated mitochondria.
The serine hydrolase inhibitors also blocked MPTP formation and necrotic cell death induced by H2O2. Pyrrophenone, KT195, CsA, and KN93 only partially blocked arachidonic acid release and cell death suggesting that other cell death pathways are triggered by H2O2. The cell death pathway in lung fibroblasts triggered by A23187 and H2O2 that involves MPTP formation is a regulated process mediated by activation of CaMKII. Pathophysiological stress conditions promote activation of CaMKII leading to mitochondrial calcium overload and MPTP formation (19). CaMKII activation mediates the pathological effects of ischemia/reperfusion injury and promotes cardiovascular diseases (67, 68). A recent report demonstrated a direct role for CaMKII in promoting MPTP formation by phosphorylating and increasing the MCU current (20). Developing small molecule cell-permeable inhibitors that block excess calcium uptake have potential for controlling the deleterious affects on the mitochondria and preventing necrotic cell death (22).
This work was supported, in whole or in part, by National Institutes of Health Grants HL61378, HL34303, HL50040, DA009789, DA033760, and MH084512 and a Hewitt Foundation Postdoctoral Fellowship.
B. Yun, H.-J. Lee, and C. C. Leslie, unpublished data.
- MPTP
- mitochondrial permeability transition pore
- ABHD6
- abhydrolase domain containing 6
- ABPP
- activity based protein profiling
- autocamtide
- autocamtide-2-related inhibitory peptide
- CaMKII
- calcium/calmodulin-dependent protein kinase II
- cPLA2
- cytosolic phospholipase A2
- CsA
- cyclosporin A
- iPLA2
- calcium-independent PLA2
- LDH
- lactate dehydrogenase
- MGLL
- monoglyceride lipase
- MCU
- mitochondrial calcium uniporter
- MLF
- mouse lung fibroblasts
- IMLF
- immortalized MLF
- OAG
- 1-oleoyl-2-acetyl-sn-glycerol
- DAG
- diacylglycerol
- DMSO
- dimethyl sulfoxide
- Z-VAD(OMe)-fmk
- N-Benzyloxycarbonyl-Val-Ala-Asp(O-Me) fluoromethyl ketone.
REFERENCES
- 1. Galluzzi L., Vitale I., Abrams J. M., Alnemri E. S., Baehrecke E. H., Blagosklonny M. V., Dawson T. M., Dawson V. L., El-Deiry W. S., Fulda S., Gottlieb E., Green D. R., Hengartner M. O., Kepp O., Knight R. A., Kumar S., Lipton S. A., Lu X., Madeo F., Malorni W., Mehlen P., Nuñez G., Peter M. E., Piacentini M., Rubinsztein D. C., Shi Y., Simon H. U., Vandenabeele P., White E., Yuan J., Zhivotovsky B., Melino G., Kroemer G. (2012) Molecular definitions of cell death subroutines. Recommendations of the Nomenclature Committee on Cell Death 2012. Cell Death Differ. 19, 107–120 [DOI] [PMC free article] [PubMed] [Google Scholar]
- 2. Yuan J., Kroemer G. (2010) Alternative cell death mechanisms in development and beyond. Genes Dev. 24, 2592–2602 [DOI] [PMC free article] [PubMed] [Google Scholar]
- 3. Baines C. P. (2010) The cardiac mitochondrion. Nexus of stress. Annu. Rev. Physiol. 72, 61–80 [DOI] [PubMed] [Google Scholar]
- 4. Surmeier D. J., Guzman J. N., Sanchez-Padilla J. (2010) Calcium, cellular aging, and selective neuronal vulnerability in Parkinson's disease. Cell Calcium 47, 175–182 [DOI] [PMC free article] [PubMed] [Google Scholar]
- 5. Noch E., Khalili K. (2009) Molecular mechanisms of necrosis in glioblastoma. The role of glutamate excitotoxicity. Cancer Biol. Ther. 8, 1791–1797 [DOI] [PMC free article] [PubMed] [Google Scholar]
- 6. Dong Z., Saikumar P., Weinberg J. M., Venkatachalam M. A. (2006) Calcium in cell injury and death. Annu. Rev. Pathol. 1, 405–434 [DOI] [PubMed] [Google Scholar]
- 7. Zhivotovsky B., Orrenius S. (2011) Calcium and cell death mechanisms. A perspective from the cell death community. Cell Calcium 50, 211–221 [DOI] [PubMed] [Google Scholar]
- 8. Lemasters J. J., Theruvath T. P., Zhong Z., Nieminen A. L. (2009) Mitochondrial calcium and the permeability transition in cell death. Biochim. Biophys. Acta 1787, 1395–1401 [DOI] [PMC free article] [PubMed] [Google Scholar]
- 9. Baines C. P. (2011) The mitochondrial permeability transition pore and the cardiac necrotic program. Pediatr. Cardiol. 32, 258–262 [DOI] [PubMed] [Google Scholar]
- 10. Halestrap A. P. (2010) A pore way to die. The role of mitochondria in reperfusion injury and cardioprotection. Biochem. Soc. Trans. 38, 841–860 [DOI] [PubMed] [Google Scholar]
- 11. Crompton M., Ellinger H., Costi A. (1988) Inhibition by cyclosporin A of a Ca2+-dependent pore in heart mitochondria activated by inorganic phosphate and oxidative stress. Biochem. J 255, 357–360 [PMC free article] [PubMed] [Google Scholar]
- 12. Griffiths E. J., Halestrap A. P. (1993) Protection by Cyclosporin A of ischemia/reperfusion-induced damage in isolated rat hearts. J. Mol. Cell Cardiol. 25, 1461–1469 [DOI] [PubMed] [Google Scholar]
- 13. Duchen M. R., McGuinness O., Brown L. A., Crompton M. (1993) On the involvement of a cyclosporin A sensitive mitochondrial pore in myocardial reperfusion injury. Cardiovasc. Res. 27, 1790–1794 [DOI] [PubMed] [Google Scholar]
- 14. Elrod J. W., Wong R., Mishra S., Vagnozzi R. J., Sakthievel B., Goonasekera S. A., Karch J., Gabel S., Farber J., Force T., Brown J. H., Murphy E., Molkentin J. D. (2010) Cyclophilin D controls mitochondrial pore-dependent Ca2+ exchange, metabolic flexibility, and propensity for heart failure in mice. J. Clin. Invest. 120, 3680–3687 [DOI] [PMC free article] [PubMed] [Google Scholar]
- 15. Piot C., Croisille P., Staat P., Thibault H., Rioufol G., Mewton N., Elbelghiti R., Cung T. T., Bonnefoy E., Angoulvant D., Macia C., Raczka F., Sportouch C., Gahide G., Finet G., André-Fouët X., Revel D., Kirkorian G., Monassier J. P., Derumeaux G., Ovize M. (2008) Effect of cyclosporine on reperfusion injury in acute myocardial infarction. N. Engl. J. Med. 359, 473–481 [DOI] [PubMed] [Google Scholar]
- 16. Hausenloy D. J., Duchen M. R., Yellon D. M. (2003) Inhibiting mitochondrial permeability transition pore opening at reperfusion protects against ischaemia-reperfusion injury. Cardiovasc. Res. 60, 617–625 [DOI] [PubMed] [Google Scholar]
- 17. Lemasters J. J. (1999) The mitochondrial permeability transition and the calcium, oxygen and pH paradoxes. One paradox after another. Cardiovasc. Res. 44, 470–473 [DOI] [PubMed] [Google Scholar]
- 18. Rasola A., Sciacovelli M., Pantic B., Bernardi P. (2010) Signal transduction to the permeability transition pore. FEBS Lett. 584, 1989–1996 [DOI] [PMC free article] [PubMed] [Google Scholar]
- 19. Timmins J. M., Ozcan L., Seimon T. A., Li G., Malagelada C., Backs J., Backs T., Bassel-Duby R., Olson E. N., Anderson M. E., Tabas I. (2009) Calcium/calmodulin-dependent protein kinase II links ER stress with Fas and mitochondrial apoptosis pathways. J. Clin. Invest. 119, 2925–2941 [DOI] [PMC free article] [PubMed] [Google Scholar]
- 20. Joiner M. L., Koval O. M., Li J., He B. J., Allamargot C., Gao Z., Luczak E. D., Hall D. D., Fink B. D., Chen B., Yang J., Moore S. A., Scholz T. D., Strack S., Mohler P. J., Sivitz W. I., Song L. S., Anderson M. E. (2012) CaMKII determines mitochondrial stress responses in heart. Nature 491, 269–273 [DOI] [PMC free article] [PubMed] [Google Scholar]
- 21. De Stefani D., Raffaello A., Teardo E., Szabò I., Rizzuto R. (2011) A forty-kilodalton protein of the inner membrane is the mitochondrial calcium uniporter. Nature 476, 336–340 [DOI] [PMC free article] [PubMed] [Google Scholar]
- 22. Baughman J. M., Perocchi F., Girgis H. S., Plovanich M., Belcher-Timme C. A., Sancak Y., Bao X. R., Strittmatter L., Goldberger O., Bogorad R. L., Koteliansky V., Mootha V. K. (2011) Integrative genomics identifies MCU as an essential component of the mitochondrial calcium uniporter. Nature 476, 341–345 [DOI] [PMC free article] [PubMed] [Google Scholar]
- 23. Raffaello A., De Stefani D., Rizzuto R. (2012) The mitochondrial Ca2+ uniporter. Cell Calcium 52, 16–21 [DOI] [PubMed] [Google Scholar]
- 24. Gouriou Y., Demaurex N., Bijlenga P., De Marchi U. (2011) Mitochondrial calcium handling during ischemia-induced cell death in neurons. Biochimie 93, 2060–2067 [DOI] [PubMed] [Google Scholar]
- 25. Pfeiffer D. R., Schmid P. C., Beatrice M. C., Schmid H. H. (1979) Intramitochondrial phospholipase activity and the effects of Ca2+ plus N-ethylmaleimide on mitochondrial function. J. Biol. Chem. 254, 11485–11494 [PubMed] [Google Scholar]
- 26. Broekemeier K. M., Pfeiffer D. R. (1995) Inhibition of the mitochondrial permeability transition by cyclosporin A during long time frame experiments. Relationship between pore opening and the activity of mitochondrial phospholipases. Biochemistry 34, 16440–16449 [DOI] [PubMed] [Google Scholar]
- 27. Blum J. L., Kinsey G. R., Monian P., Sun B., Cummings B. S., McHowat J., Schnellmann R. G. (2011) Profiling of fatty acids released during calcium-induced mitochondrial permeability transition in isolated rabbit kidney cortex mitochondria. Toxicol. in Vitro 25, 1001–1006 [DOI] [PMC free article] [PubMed] [Google Scholar]
- 28. Kinsey G. R., McHowat J., Patrick K. S., Schnellmann R. G. (2007) Role of Ca2+-independent phospholipase A2γ in Ca2+-induced mitochondrial permeability transition. J. Pharmacol. Exp. Ther. 321, 707–715 [DOI] [PubMed] [Google Scholar]
- 29. Broekemeier K. M., Iben J. R., LeVan E. G., Crouser E. D., Pfeiffer D. R. (2002) Pore formation and uncoupling initiate a Ca2+-independent degradation of mitochondrial phospholipids. Biochemistry 41, 7771–7780 [DOI] [PubMed] [Google Scholar]
- 30. Williams S. D., Gottlieb R. A. (2002) Inhibition of mitochondrial calcium-independent phospholipase A2 (iPLA2) attenuates mitochondrial phospholipid loss and is cardioprotective. Biochem. J. 362, 23–32 [DOI] [PMC free article] [PubMed] [Google Scholar]
- 31. Moon S. H., Jenkins C. M., Kiebish M. A., Sims H. F., Mancuso D. J., Gross R. W. (2012) Genetic ablation of calcium-independent phospholipase A2γ (iPLA2γ) attenuates calcium-induced opening of the mitochondrial permeability transition pore and resultant cytochrome c release. J. Biol. Chem. 287, 29837–29850 [DOI] [PMC free article] [PubMed] [Google Scholar]
- 32. Scorrano L., Penzo D., Petronilli V., Pagano F., Bernardi P. (2001) Arachidonic acid causes cell death through the mitochondrial permeability transition. Implications for tumor necrosis factor-α aopototic signaling. J. Biol. Chem. 276, 12035–12040 [DOI] [PubMed] [Google Scholar]
- 33. Penzo D., Petronilli V., Angelin A., Cusan C., Colonna R., Scorrano L., Pagano F., Prato M., Di Lisa F., Bernardi P. (2004) Arachidonic acid released by phospholipase A2 activation triggers Ca2+-dependent apoptosis through the mitochondrial pathway. J. Biol. Chem. 279, 25219–25225 [DOI] [PubMed] [Google Scholar]
- 34. Evans J. H., Spencer D. M., Zweifach A., Leslie C. C. (2001) Intracellular calcium signals regulating cytosolic phospholipase A2 translocation to internal membranes. J. Biol. Chem. 276, 30150–30160 [DOI] [PubMed] [Google Scholar]
- 35. Leslie C. C., Gangelhoff T. A., Gelb M. H. (2010) Localization and function of cytosolic phospholipase A2α at the Golgi. Biochimie 92, 620–626 [DOI] [PMC free article] [PubMed] [Google Scholar]
- 36. Ni Z., Okeley N. M., Smart B. P., Gelb M. H. (2006) Intracellular action of group IIA secreted phospholipase A2 and group IVA cytosolic phospholipase A2 contribute to arachidonic acid release and prostaglandin production in rat gastric mucosal cells and transfected human embryonic kidney cells. J. Biol. Chem. 281, 16245–16255 [DOI] [PMC free article] [PubMed] [Google Scholar]
- 37. Hsu K. L., Tsuboi K., Adibekian A., Pugh H., Masuda K., Cravatt B. F. (2012) DAGLβ inhibition perturbs a lipid network involved in macrophage inflammatory responses. Nat. Chem. Biol. 8, 999–1007 [DOI] [PMC free article] [PubMed] [Google Scholar]
- 38. Ghosh M., Stewart A., Tucker D. E., Bonventre J. V., Murphy R. C., Leslie C. C. (2004) Role of cytosolic phospholipase A2 in prostaglandin E2 production by lung fibroblasts. Am. J. Respir. Cell Mol. Biol. 30, 91–100 [DOI] [PubMed] [Google Scholar]
- 39. Stewart A., Ghosh M., Spencer D. M., Leslie C. C. (2002) Enzymatic properties of human cytosolic phospholipase A2γ. J. Biol. Chem. 277, 29526–29536 [DOI] [PubMed] [Google Scholar]
- 40. Bligh E. G., Dyer W. J. (1959) A rapid method of total lipid extraction and purification. Can. J. Biochem. Physiol. 37, 911–917 [DOI] [PubMed] [Google Scholar]
- 41. Ghosh M., Loper R., Ghomashchi F., Tucker D. E., Bonventre J. V., Gelb M. H., Leslie C. C. (2007) Function, activity and membrane targeting of cytosolic phospholipase A2ζ in mouse lung fibroblasts. J. Biol. Chem. 282, 11676–11686 [DOI] [PMC free article] [PubMed] [Google Scholar]
- 42. Livak K. J., Schmittgen T. D. (2001) Analysis of relative gene expression data using real time quantitative PCR and the 2-ΔΔCT method. Methods 25, 402–408 [DOI] [PubMed] [Google Scholar]
- 43. Mignen O., Brink C., Enfissi A., Nadkarni A., Shuttleworth T. J., Giovannucci D. R., Capiod T. (2005) Carboxyamidotriazole-induced inhibition of mitochondrial calcium import blocks capacitative calcium entry and cell proliferation in HEK-293 cells. J. Cell Sci. 118, 5615–5623 [DOI] [PubMed] [Google Scholar]
- 44. Wieckowski M. R., Giorgi C., Lebiedzinska M., Duszynski J., Pinton P. (2009) Isolation of mitochondria-associated membranes and mitochondria from animal tissues and cells. Nat. Protoc. 4, 1582–1590 [DOI] [PubMed] [Google Scholar]
- 45. Wong R., Steenbergen C., Murphy E. (2012) Mitochondrial permeability transition pore and calcium handling. Methods Mol. Biol. 810, 235–242 [DOI] [PMC free article] [PubMed] [Google Scholar]
- 46. Nakagawa T., Shimizu S., Watanabe T., Yamaguchi O., Otsu K., Yamagata H., Inohara H., Kubo T., Tsujimoto Y. (2005) Cyclophilin D-dependent mitochondrial permeability transition regulates some necrotic but not apoptotic cell death. Nature 434, 652–658 [DOI] [PubMed] [Google Scholar]
- 47. Petronilli V., Miotto G., Canton M., Brini M., Colonna R., Bernardi P., Di Lisa F. (1999) Transient and long-lasting openings of the mitochondrial permeability transition pore can be monitored directly in intact cells by changes in mitochondrial calcein fluorescence. Biophys. J. 76, 725–734 [DOI] [PMC free article] [PubMed] [Google Scholar]
- 48. Nomura D. K., Morrison B. E., Blankman J. L., Long J. Z., Kinsey S. G., Marcondes M. C., Ward A. M., Hahn Y. K., Lichtman A. H., Conti B., Cravatt B. F. (2011) Endocannabinoid hydrolysis generates brain prostaglandins that promote neuroinflammation. Science 334, 809–813 [DOI] [PMC free article] [PubMed] [Google Scholar]
- 49. Bisogno T., Howell F., Williams G., Minassi A., Cascio M. G., Ligresti A., Matias I., Schiano-Moriello A., Paul P., Williams E. J., Gangadharan U., Hobbs C., Di Marzo V., Doherty P. (2003) Cloning of the first sn1-DAG lipases points to the spatial and temporal regulation of endocannabinoid signaling in the brain. J. Cell Biol. 163, 463–468 [DOI] [PMC free article] [PubMed] [Google Scholar]
- 50. Marrs W. R., Blankman J. L., Horne E. A., Thomazeau A., Lin Y. H., Coy J., Bodor A. L., Muccioli G. G., Hu S. S., Woodruff G., Fung S., Lafourcade M., Alexander J. P., Long J. Z., Li W., Xu C., Möller T., Mackie K., Manzoni O. J., Cravatt B. F., Stella N. (2010) The serine hydrolase ABHD6 controls the accumulation and efficacy of 2-AG at cannabinoid receptors. Nat. Neurosci. 13, 951–957 [DOI] [PMC free article] [PubMed] [Google Scholar]
- 51. Gelb M. H., Svaren J. P., Abeles R. H. (1985) Fluoro ketone inhibitors of hydrolytic enzymes. Biochemistry 24, 1813–1817 [DOI] [PubMed] [Google Scholar]
- 52. Street I. P., Lin H. K., Laliberté F., Ghomashchi F., Wang Z., Perrier H., Tremblay N. M., Huang Z., Weech P. K., Gelb M. H. (1993) Slow- and tight-binding inhibitors of the 85-kDa human phospholipase A2. Biochemistry 32, 5935–5940 [DOI] [PubMed] [Google Scholar]
- 53. Barbayianni E., Stephens D., Grkovich A., Magrioti V., Hsu Y. H., Dolatzas P., Kalogiannidis D., Dennis E. A., Kokotos G. (2009) 2-Oxoamide inhibitors of phospholipase A2 activity and cellular arachidonate release based on dipeptides and pseudodipeptides. Bioorg. Med. Chem. 17, 4833–4843 [DOI] [PMC free article] [PubMed] [Google Scholar]
- 54. Matlib M. A., Zhou Z., Knight S., Ahmed S., Choi K. M., Krause-Bauer J., Phillips R., Altschuld R., Katsube Y., Sperelakis N., Bers D. M. (1998) Oxygen-bridged dinuclear ruthenium amine complex specifically inhibits Ca2+ uptake into mitochondria in vitro and in situ in single cardiac myocytes. J. Biol. Chem. 273, 10223–10231 [DOI] [PubMed] [Google Scholar]
- 55. Contreras L., Drago I., Zampese E., Pozzan T. (2010) Mitochondria. The calcium connection. Biochim. Biophys. Acta 1797, 607–618 [DOI] [PubMed] [Google Scholar]
- 56. Knox C. D., Belous A. E., Pierce J. M., Wakata A., Nicoud I. B., Anderson C. D., Pinson C. W., Chari R. S. (2004) Novel role of phospholipase C-δ1. Regulation of liver mitochondrial Ca2+ uptake. Am. J. Physiol. Gastrointest. Liver Physiol. 287, G533–540 [DOI] [PubMed] [Google Scholar]
- 57. Chinopoulos C., Starkov A. A., Grigoriev S., Dejean L. M., Kinnally K. W., Liu X., Ambudkar I. S., Fiskum G. (2005) Diacylglycerols activate mitochondrial cationic channel (s) and release sequestered Ca2+. J. Bioenerg. Biomembr. 37, 237–247 [DOI] [PMC free article] [PubMed] [Google Scholar]
- 58. Qiu Z.-H., Leslie C. C. (1994) Protein kinase C-dependent and -independent pathways of mitogen-activated protein kinase activation in macrophages by stimuli that activate phospholipase A2. J. Biol. Chem. 269, 19480–19487 [PubMed] [Google Scholar]
- 59. Leslie C. C. (1997) Properties and regulation of cytosolic phospholipase A2. J. Biol. Chem. 272, 16709–16712 [DOI] [PubMed] [Google Scholar]
- 60. Nishizuka Y. (1986) Studies and perspectives of protein kinase C. Science 233, 305–312 [DOI] [PubMed] [Google Scholar]
- 61. Korge P., Weiss J. N. (1999) Thapsigargin directly induces the mitochondrial permeability transition. Eur. J. Biochem. 265, 273–280 [DOI] [PubMed] [Google Scholar]
- 62. McGee A. M., Baines C. P. (2011) Complement 1q-binding protein inhibits the mitochondrial permeability transition pore and protects against oxidative stress-induced death. Biochem. J. 433, 119–125 [DOI] [PMC free article] [PubMed] [Google Scholar]
- 63. Vaseva A. V., Marchenko N. D., Ji K., Tsirka S. E., Holzmann S., Moll U. M. (2012) p53 opens the mitochondrial permeability transition pore to trigger necrosis. Cell 149, 1536–1548 [DOI] [PMC free article] [PubMed] [Google Scholar]
- 64. Baines C. P., Kaiser R. A., Purcell N. H., Blair N. S., Osinska H., Hambleton M. A., Brunskill E. W., Sayen M. R., Gottlieb R. A., Dorn G. W., Robbins J., Molkentin J. D. (2005) Loss of cyclophilin D reveals a critical role for mitochondrial permeability transition in cell death. Nature 434, 658–662 [DOI] [PubMed] [Google Scholar]
- 65. Adibekian A., Martin B. R., Wang C., Hsu K. L., Bachovchin D. A., Niessen S., Hoover H., Cravatt B. F. (2011) Click-generated triazole ureas as ultrapotent in vivo-active serine hydrolase inhibitors. Nat. Chem. Biol. 7, 469–478 [DOI] [PMC free article] [PubMed] [Google Scholar]
- 66. Hoover H. S., Blankman J. L., Niessen S., Cravatt B. F. (2008) Selectivity of inhibitors of endocannabinoid biosynthesis evaluated by activity-based protein profiling. Bioorg. Med. Chem. Lett. 18, 5838–5841 [DOI] [PMC free article] [PubMed] [Google Scholar]
- 67. Erickson J. R., He B. J., Grumbach I. M., Anderson M. E. (2011) CaMKII in the cardiovascular system. Sensing redox states. Physiol. Rev. 91, 889–915 [DOI] [PMC free article] [PubMed] [Google Scholar]
- 68. Salas M. A., Valverde C. A., Sánchez G., Said M., Rodriguez J. S., Portiansky E. L., Kaetzel M. A., Dedman J. R., Donoso P., Kranias E. G., Mattiazzi A. (2010) The signalling pathway of CaMKII-mediated apoptosis and necrosis in the ischemia/reperfusion injury. J. Mol. Cell Cardiol. 48, 1298–1306 [DOI] [PMC free article] [PubMed] [Google Scholar]