

At all but the slowest growth rates, the E. coli chromosome is segregated into daughter cells while DNA replication is still ongoing. Here, Austin and colleagues measure the positions of marked DNA foci and replication forks to examine the behavior of the E. coli chromosome in overlapping cell cycle conditions. This study solves the chromosome organization, structural dynamics, and segregation of this constantly replicating chromosome and extends our understanding of the bacterial chromosome to rapid growth conditions.
Keywords: bacterial cell cycle, bacterial chromosome, chromosome organization, chromosome segregation, multifork replication
Abstract
At all but the slowest growth rates, Escherichia coli cell cycles overlap, and its nucleoid is segregated to daughter cells as a forked DNA circle with replication ongoing—a state fundamentally different from eukaryotes. We have solved the chromosome organization, structural dynamics, and segregation of this constantly replicating chromosome. It is locally condensed to form a branched donut, compressed so that the least replicated DNA spans the cell center and the newest DNA extends toward the cell poles. Three narrow zones at the cell center and quarters contain both the replication forks and nascent DNA and serve to segregate the duplicated chromosomal information as it flows outward. The overall pattern is smoothly self-replicating, except when the duplicated terminus region is released from the septum and recoils to the center of a sister nucleoid. In circular cross-section of the cell, the left and right arms of the chromosome form separate, parallel structures that lie in each cell half along the radial cell axis. In contrast, replication forks and origin and terminus regions are found mostly at the center of the cross section, balanced by the parallel chromosome arms. The structure is consistent with the model in which the nucleoid is a constrained ring polymer that develops by spontaneous thermodynamics. The ring polymer pattern extrapolates to higher growth rates and also provides a structural basis for the form of the chromosome during very slow growth.
The circular 4.6-Mb Escherichia coli chromosome must replicate once in each cell generation, and the daughter molecules must be accurately segregated to daughter cells before cell division. At 1.5 mm in length, the chromosomal DNA is nearly a thousand times the length of the cell and must be highly folded in vivo. A long-standing question concerns how the duplicated chromosomes are organized and separated such that they each occupy one half of the cell prior to division. The problem is all the more challenging because, except under the conditions of slowest growth, the E. coli chromosomes replicate continuously, and the cell cycles overlap (Fig. 1A; Cooper and Helmstetter 1968). This “multifork” replication represents a fundamental difference from eukaryotes, in which replication and segregation are separated in time. As a result, a eukaryotic-like apparatus that pushes or pulls replicated parts of the sister chromosomes to the opposite side of the cell seems unlikely in bacteria. Such mechanisms may even be harmful to the bacterial cell during multifork replication (Jun and Wright 2010).
Figure 1.

The cell cycle and experimental approach. (A) At the slowest growth rates, the chromosome rests in B/G1 before the replication period C/S starts. This is as in eukaryotes. At faster growth rates, however, replication is continuous, and the B/G1 period disappears. The growth condition in our study is such that a new round of replication is initiated just before the previous one is terminated, as illustrated in the right panel. (B) We constructed a set of strains with two independent fluorescent chromosome markers. One type of parS sequence (pMT1 parS) was inserted at either 22′ or 98′ to serve as a reference marker, and another type of parS sequence (P1 parS) was inserted at one of the 13 positions on the map. Each strain has a pair of parS sequences and a matching pair of ParB proteins fused to CFP and YFP (CFP-P1DOParB and yGFP-pMT1D23ParB). (C) Cell size distributions of a population of cells growing under steady-state growth conditions in this study (the color of the lines matches the chromosome marker in B). Typically, we analyzed 104–105 cells per strain. Approximately 106 cells were studied in this work. This was sufficient to obtain reproducible actual cell size distributions from each strain. Both the tails of the distributions and the Gaussian-looking dividing cell size distributions indicate significant intrinsic stochasticity of growth and cell cycle regulation. The black dashed line is the theoretical distribution in the absence of cell-to-cell variation. The inset graph also illustrates the stochasticity of the cell cycle. There is a considerable variation in the length of dividing cells, defined in the measurement program as cells with a central constriction with <90% of the average cell diameter of the rest of the cell. (D) A typical field of view of one of the strains (22′ and 54.2′ markers) grown under overlapping cell cycle condition is shown. Due to multifork replication, many cells contain multiple fluorescent foci per locus.
A general chromosome segregation mechanism in bacteria should account for all growth and cell cycle conditions. Currently, most of our knowledge of the organization and segregation of the E. coli chromosome comes from studies of nonoverlapping cell cycles at slow growth rates (Gordon et al. 1997; Hiraga 2000; Bates and Kleckner 2005; Wang et al. 2005, 2006; Nielsen et al. 2006a,b; Mercier et al. 2008; Wiggins et al. 2010; Fisher et al. 2013). Under these conditions, daughter chromosomes segregate progressively as they are replicated (Nielsen et al. 2006a). The nucleoid mass is not randomly organized. The origin of replication occupies the cell center, and the two chromosome arms are separated on the cell long axis and extend into opposite cell halves (Nielsen et al. 2006a,b; Wang et al. 2006). Individual chromosomal loci are arranged roughly in map order, with origin-proximal loci near the cell center and terminus-proximal loci adjacent to the cell poles. This fits with the conclusion that the chromosome is folded into a self-adherent macrofilament (Wiggins et al. 2010; Yazdi et al. 2012). At faster growth rates, duplicated genomic loci also separate progressively and linearly with time (Nielsen et al. 2007). However, little was previously known of how constantly replicating chromosomes are organized within the nucleoid or how segregation is assured with branched structures.
To understand the general principle underlying chromosome organization and segregation, we measured the positions of marked DNA foci and replication forks in large numbers of individual cells (∼106). The overlapping cell cycle conditions are illustrated in Figure 1A. The large amounts of data allowed us to obtain reproducible distribution histograms during cell growth. From the seemingly complex histograms, simple novel patterns and organization principles emerged.
The continuously replicating E. coli chromosome is a compressed, branched donut such that the newly replicated DNA extends toward the cell poles, and the terminus region spans the cell center. Newly replicated genomic loci separate at three narrow zones at the cell center and quarters, where the replication forks are active. The overall pattern is smoothly self-replicating, except when the duplicated terminus region is released from the septum and recoils to the center of each sister nucleoid. In a circular cross-section of the cell, the left and right arms of the chromosome form parallel structures and occupy each cell half along the radial cell axis. This pattern is constant regardless of the replication state of the chromosome. Replication forks and origin are mostly found at the center of the cross-section, balanced by the parallel chromosome arms, whereas the terminus appears to be near the membrane.
At first, these findings appear to be radically different from the chromosome organization in slow-growing conditions. However, when combined with the measured micromechanical properties of the chromosome under similar conditions in vitro (Pelletier et al. 2012) and polymer physics for the organization of large circular molecules constrained within cylindrical spaces such as the envelope of the E. coli cell (Jung et al. 2012), our results provide a complete description of the organization, dynamics, and segregation of the bacterial chromosome under all growth and cell cycle conditions.
Results
The cell cycle and experimental approach
At the slowest growth rates, the completed chromosomes rest before the next round of replication, as in eukaryotes (Fig. 1A, left panel; Nielsen et al. 2006a). At faster growth rates, however, replication is continuous, and the newborn cell contains a significantly replicated chromosome (Fig. 1A, right panel; Nielsen et al. 2007). The cell cycles in our study overlap such that a new round of replication is initiated just before the previous one is terminated (glucose casamino acids medium, 55-min generation time at 32°C) (Fig. 1A, right panel; Nielsen et al. 2007).
In order to understand the mechanism of organization, structural development, and segregation of the chromosome during multifork replication, we constructed a set of strains with two independent fluorescent chromosome markers: a reference marker at 22′ or 98′ on the right arm of the chromosome and a second marker at 13 positions, including ori and ter, distributed around the genetic map (Fig. 1B). A typical field of cells is shown in Figure 1D. Analysis of the cell images in large populations of such cells, typically 104–105 per strain, showed highly reproducible cell length and segregation data. For instance, the cell length distributions measured from all 13 strains collapsed onto a single master curve (Fig. 1C). Furthermore, the segregation of the reference 22′ marker occurred within a small window of the cell cycle in all strains (data not shown). Thus, our method for determining the average segregation time for markers in a given population is accurate and reproducible, and the distributions obtained from different markers can be compared directly.
The meaning of population distribution histograms of focus positions
Our study measures the positions of marked DNA loci in large numbers of individual cells in the population. In order to search for patterns during the cell cycle, we show the data as distribution histograms of the individual positions relative to the ages of individual cells (as estimated from cell length) (Fig. 1C). We used relative cell long axis position in the belief that key positions in the cell are determined by mechanisms that measure relative distance along the cell axis rather than absolute distances (Meinhardt and de Boer 2001). With noted exceptions, the long axis positions of the foci were measured from one end of the cell or the other at random. Some caution is needed in interpreting such distributions. For example, one-focus cells can result in more than one peak because of the random left–right orientation of the cells. For the same reason, two-foci cells always produce two distribution peaks, with maxima symmetrically placed, one in each cell half. This would be true even if the foci were randomly distributed within the cells. It is only when two symmetrically disposed distributions overlap minimally or not at all that we can conclude that most cells have one focus in one cell half and the other in the other half.
The use of double chromosome markers partially alleviates the limitations of the population distribution approach. For example, by scoring the relative positions of two different markers in each cell, we can clearly understand their relative spatial relationship in the population. The structural development of the replicating chromosomes emerges naturally as we follow the cells of different age classes.
Chromosomal information flows outward from the cell center along the cell long axis
Figure 2A shows our analysis of cells marked on the left chromosomal arm. The five columns represent five cell age groups equally spaced between 0 and 1. The four rows display the cell long axis histograms for each focus number group. In the youngest age group (0.0–0.2), virtually all cells contain only one or two foci, as predicted from the cell cycle diagram in Figures 1A (right panel) and 2C. Because ter is the last locus to be replicated, most of the one-focus distributions represent the loci closer to ter, whereas most of the two-foci distributions come from the loci closer to ori. The area under each distribution represents the fraction of the cells within the population. This allows us to deduce the DNA distribution along the cell long axis by summing all histograms within the age group, weighted by the length of DNA between the two nearest neighbor labeled loci (Fig. 2B).
Figure 2.

Cell long axis histograms show outward information flow during multifork replication. (A) The histograms are grouped based on the number of foci of the locus and the age of the cell (throughout this study, the color of the lines matches the chromosome marker in Fig. 1B). The area below each distribution reflects the fraction of the group of cells within the population. Notice that the terminus is localized at the cell center until it splits into two, except in some new cells (e.g., age 0.0–0.2). Peaks of other distributions also split into two after replication and drift away from each other (indicated by arrows). The significant fraction of the three-foci cells implies significant stochasticity of initiation of replication; ∼20% (∼10 min) of the 55-min generation time (see the Materials and Methods). Except for the three-foci cells, the cells are randomly oriented, and the histograms are symmetric (see Supplemental Fig. 1 for unsorted three-foci histograms). (B) The population average of DNA distribution within the age group can be obtained by summing up the weighted histograms in A (see the Materials and Methods). (C) Schematic development of the chromosome organization during replication along the cell long axis. This summarizes the natural flow of structural development of the replicating chromosome seen in the histograms in A.
The positional histograms show a flow of information during replication along the cell long axis. In the one-focus histograms, single peaks are at the cell center (except for ter in some newborn cells) (see below). In the two-foci histograms, the earlier the locus replicates, the farther the two distributions are apart. They are placed symmetrically; one either side of the cell center.
As replication continues, the patterns evolve naturally. The three- and four-foci cells appear (e.g., in age groups 0.2–0.4 and 0.4–0.6). The fraction of one-focus and two-foci cells decreases accordingly. The three-foci cells show the intrinsic stochasticity of the cell cycle: One of the two homologous loci located in the sister chromosomes replicates and separates earlier than the other. The duplicated loci drift away from each other in the order of replication, forming the symmetric peaks seen in all multifoci histograms. The ter sequences remain at the cell center even after duplication. Only after the cell starts to constrict do the duplicated ter sequences split apart. The three ter peaks in the one-focus histograms in the youngest cells (age group 0.0–0.2) converge to a single peak as the cells grow (age group 0.2–0.4). This suggests that ter is located at the cell pole in a newborn cell and subsequently moves toward the cell center. The terminus transition can be seen directly in time-lapse microscopy (see “The Terminus Transition” below). Finally, markers on the left arm of the chromosome and markers in comparable positions on the right arm have similar patterns of distribution (Supplemental Fig. 1). This shows that the two chromosome arms are organized together with regard to their long axis positions.
Stochasticity of growth and the cell cycle is worth noting. Cell size distributions show significant tails from a theoretical, exponential distribution for deterministic processes (Fig. 1C). In addition, cell length at the time of cell division varies considerably (Fig. 1C inset; Wang et al. 2010). The mere existence of three-foci cells in Figure 2A is also a strong indication of stochastic firing of replication origins, since, in this case, only one of the two origins in the cell has fired. The degree of asynchrony is ∼10 min, or 20% of the 55-min generation time (see the Materials and Methods; Wang et al. 2011). Thus, while cell size and apparent age are approximate indicators of the cell cycle progression, the patterns seen in the five age groups are representative of the population development. A typical variance is 10%–20% of the mean (Wang et al. 2010).
The data in Figure 2 suggest that there is an orderly flow of information with time (Fig. 2A,C). DNA is duplicated and segregated bidirectionally from the vicinity of the cell center to form two foci, migrates to the vicinity of the cell quarters, and then segregates bidirectionally again to form four well-spaced copies that are placed roughly at the cell eighth positions.
Replicated loci separate in three limited zones where the replication forks are active
Comparison of the distributions in Figure 2A show that peaks split at the cell center or cell quarters. For example, the single-peak ter distribution splits into two at the cell center in the two-foci distributions in the dividing cells (cell age group 0.8–1.0). A similar relationship is evident between the three-foci and four-foci distributions, in which a solo focus peak splits into two at the cell quarters. We hypothesized that the three zones of segregation are where the loci are replicated. To test this hypothesis, we mapped the positions of foci formed by the single-stranded binding protein Ssb. Ssb binds specifically to replication forks because it protects the single-stranded regions produced by the discontinuous synthesis of the lagging DNA strand (Meyer and Laine 1990). Strain SJ173 expresses Ssb as fluorescent derivative Ssb-GFP (a generous gift from Andrew Wright) from its normal chromosomal locus (Fig. 3A, left column).
Figure 3.
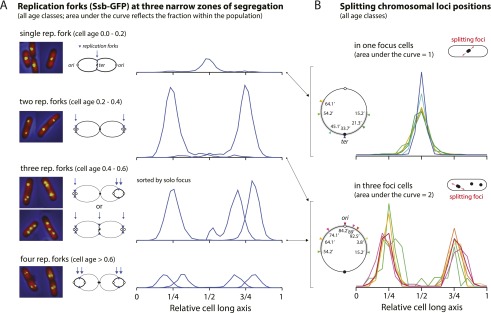
Replicated loci separate in three limited zones where the replication forks are active. (A) Replication forks show narrow distributions centered around either the cell center or the cell quarters. Their long axis distributions match well with the distribution of duplicated loci in the action of separation inferred by the elongated shape of the splitting foci. (B) The position and dynamics of the replication forks are likely the consequence of the spatial organization of the chromosomes rather than vice versa (see the text).
Early in the cell cycle, cells have typically one Ssb focus placed at the cell center (Fig. 3A, top row). During most of the remaining cell cycle, most cells have two foci placed approximately at the cell quarter positions (Fig. 3A, second row). As these cells have either two or four replication forks (Fig. 1A, right column), the Ssb foci presumably indicate pairs of forks. Approximately one-third of the foci-containing cells have three or four foci. They generally contain closely apposed pairs centered on the quarter positions. A small but distinctive subclass of cells has three equally spaced foci, with one at the center and the others at the cell quarters (2% of the population) (Fig. 3A, third row). These observations indicate stochastic replication initiation and dissociation of fork pairs (Adachi et al. 2005, 2008; Bates and Kleckner 2005). The foci often appear to have moved out somewhat along the long axis, as has been described previously in slow-growing cells (Bates and Kleckner 2005). In the present case, however, they still remain within somewhat restricted zones centered on the cell quarters (Fig. 3A). One-third of the cell images do not have countable Ssb foci (see the Materials and Methods).
The long axis positions of Ssb foci correspond closely to those of segregating chromosomal foci. To confirm this, we sorted the data to find the subgroup of cells containing an elongated single focus indicating a pair of foci in the act of separating (Fig. 3B; see the Materials and Methods). They were always at or near the cell center for single-focus cells and the cell quarters for three-foci cells irrespective of the marker observed (Fig. 3B). Their long axis distributions are narrow and virtually identical to one another. Approximately 15% of the long axis at the cell center hosts almost all of these events. This contrasts with the broader, spatially varying distributions shown in Figure 2A (except for ter). We conclude that segregation of markers is occurring from regions where the replication forks are active. As these regions are narrower than the distributions of the markers that are being segregated (Fig. 2A), markers must move to the forks to be replicated. In our view, this does not necessarily mean that the replication forks are present in some fixed structure, as originally proposed in the “factory model” (Lemon and Grossman 1998), but rather that they are confined to limited regions by the structural dynamics of the growing nucleoid (see “The Ring Polymer Model and the Nucleoid Duplication Cycle,” below).
The terminus transition
Figure 2A implies that the terminus and some associated sequences must transfer from the vicinity of the new cell pole to the cell center soon after cell birth. This transfer should radically alter the relationship between the replicated and unreplicated DNA so that the unreplicated DNA, including ter, moves from a position outside of the two replicated DNA blocks to one that lies between them (Fig. 2A,C). We tested this hypothesis with population analysis as well as single-cell time-lapse experiments using a microfluidic “mother machine” (Wang et al. 2010).
In Figure 4A (top panel), we followed the position of the terminus marker relative to the origin marker in individual cells containing two origin markers and one terminus marker (2 + 1 cells) throughout the cell cycle. In the smallest newborn cells (age <0), virtually all cells have the terminus near the cell pole, beyond both origin markers. As the population ages, the terminus is transferred to the cell center between the two origin foci. This transition occurs in 100% of the cells, but the individual cell events are broadly distributed over the first half of the cell cycle. We carried out a similar analysis of 2 + 1 foci cells for five other markers at increasing distances from the terminus (Fig. 4A, bottom panel). All showed evidence of a clear transition from the cell pole to the center as the cells aged, with population kinetics similar to those seen with the terminus marker. Thus, any unreplicated DNA associated with the terminus transitions with it.
Figure 4.
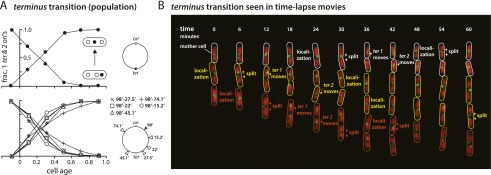
The terminus transition. (A) Evidence at the population level. The top panel shows the statistics of the cells with two origin foci and one terminus. In all cells, the three loci are initially in the order of ori–ori–ter and switch to ori–ter–ori. A similar transition is seen with loci spanning the large fraction of the chromosome. (B) Evidence at the single-cell level. These images show two types of fluorescent fusion proteins: the extended red regions for the nucleoid labeled by HU-mCherry and the green foci for 33.7′ (terminus), marked by GFP-ParB. The same mother cell is outlined in the same color across the time images. The time-lapse images were taken every 6 min and lasted for no more than two cell generations to prevent slowing cell growth. The following sequence of events is evident from the time-lapse movies: the localization of terminus at the cell center, the split of the duplicated terminus foci, and the asynchronous recoil of each terminus region focus to the center of each sister nucleoid.
To further confirm the terminus transition, we also performed single-cell time-lapse experiments. The strain SJ290 has a fluorescent marker near ter (33.7′) but also expresses functional HU-mCherry proteins from the chromosome. We were thus able to visualize the position of ter with respect to the nucleoids in individual cells simultaneously. The time-lapse movies showed the following sequence of events in every cell in our experiments (Fig. 4B; Supplemental Movie S1): (1) localization of ter at the cell pole, (2) separation of the sister nucleoids, (3) local separation of duplicated ter at the septum, and (4) (asynchronous) recoil (spring back from each other) of the separated ter markers to the middle of each sister nucleoid. This last step is completed typically within 6–12 min, a significant fraction of the 55-min average mass-doubling period. Such recoiling motion is a hallmark of entropic elasticity of a stretched polymer well known in DNA biophysics (for example, see the “stem and flower” model by Brochard-Wyart 1993).
Transfer of a segment of the chromosome with the terminus to the new cell center during multifork replication has been described previously (Joshi et al. 2011; Espeli et al. 2012). However, we did not find that the sequences transferred constitute a fixed terminal domain (Mercier et al. 2008; Espeli et al. 2012), but rather it consists of whatever sequences remain unreplicated or unsegregated in the individual cell prior to the event.
At slow growth rates, an analogous event occurs. It accompanies a global rearrangement of the nucleoid that establishes bilateral arm separation and contributes importantly to marker segregation (Hiraga 2000; Bates and Kleckner 2005; Joshi et al. 2011). In the present multifork case, however, much of the initial separation is due to progressive segregation away from the forks at the cell center and quarter positions. The terminal transition serves to further separate loci as it remodels the nucleoid (Figs. 2C, 4). The extent of the unreplicated DNA transferred with the terminus has no obvious limit. Even markers beyond half way between the terminus and the origin are transferred in some of the cells, and the transition appears to be abrupt with no intermediate positions evident (Fig. 4A, bottom panel). However, it occurs in different cells at different stages throughout the first half of the cell cycle, and therefore the extent of the transferred region varies widely (visible in the two daughter cells in Fig. 4B).
Radial axis distributions show stable positioning relative to the radial cell axis
The cross-section of a cell perpendicular to the long cell axis is a disk (Fig. 5A,B). If a marker is evenly distributed within the cylindrical cell volume, the population distribution of the marker along the radial axis will show a maximum at the cell center, where the disk is deepest. Markers that are restricted to the central radial axis of the cell will form a narrower distribution, with a taller single peak at the centerline. In contrast, if the marker is always at the cell periphery, the distribution will show two maxima corresponding to the edges of the nucleoid cylinder. Thus, for any given marker, the radial axis distribution profile should predict the distribution of that marker relative to the cell radial axis in the cell population.
Figure 5.

The left and right arms of the chromosome form parallel structures and occupy each cell half along the cell radial axis. (A) The cell radial axis histograms. The left and right arms of the circular chromosome show characteristic two-peak distributions, implying that they are closer to the inner cell wall membrane. In contrast, the ori and ter regions show single-peak distributions. The radial distributions are constant with respect to the cell age, except for the ter locus. The ter distribution is bimodal for young cells (age group 0.0–0.2). The distribution gradually becomes single-peaked as the age of the cell increases. Because the terminus is localized at the cell center (Fig. 2A), the simplest interpretation is that the terminus region moves toward the central cell axis as constriction progresses. These results can be explained by a ring polymer model of the chromosome (see the text). (B) Examples of single-peak (space-filling and floating nucleoids) and bimodal (near membrane and separated arms) distributions. Orange represents the left chromosome arm, and green represents the right arm (colors match the illustration in A). Due to rotational symmetry of the cylindrical cross-section of E. coli, histograms compiled from a population of cells can be explained by several different models and require further analysis, as in C. (C) The radial axis positions of two genetic loci plotted against each other. Loci on the same arm are likely to be found in the same cell half, whereas loci on the opposite arms are likely found on the opposite cell halves. This supports the separated arms model in B. (D) The average DNA mass distribution along the cell radial axis as inferred by summing the weighted positional histograms (e.g., in A) in each age group. The radial axis distributions are constant, independent of the age group, except for ter.
Figure 5A also shows the radial axis distributions for 14 chromosome markers around the chromosome. Some show a broad single maximum at the center, suggesting that they are rather evenly distributed throughout the cell cross-section in the cell population. Most, however, show a two-peak distribution, suggesting that they are distributed with a bias toward the cell periphery. There is a general trend with markers in the left and right chromosome arms showing a bias toward the cell periphery and markers close to the origin being more uniformly distributed throughout the cross-section. The terminal marker, 33.7′, appears to be an exception to this trend. Closer examination of the data shows that most of the 33.7′ foci lie near the cell wall membrane. The portion of the distribution that surrounds the radial axis comes from dividing cells in which the terminus is constrained to the shrinking septal pore (S Austin, unpubl.). All of the patterns were reproducible in duplicate experiments (data not shown).
An important feature of most radial axis distributions is their constancy. The characteristic one- or two-peak distributions of the markers maintain their shape throughout the cell cycle. This implies that the radial positioning of all markers varies little with time or the increasing numbers of focus copies as the cell cycle progresses. This is true of all markers in this study as well as the average radial axis mass distribution (Fig. 5C). A notable exception is the terminus. In this case, the terminus is biased to the cell periphery early in the cell cycle but becomes displaced toward the radial axis as the septal pore contracts (Fig. 5A, bottom left).
The left and right chromosome arms form separate, parallel structures in the cell cross-section
The unexpected bimodal distributions in Figure 5A have two different explanations (Fig. 5B). One possibility is that the chromosome arms are physically fused and collapsed onto the inner cell wall membrane (near membrane model). The other possibility is that the two arms are in each cell half along the cell radial axis (separated arms model). We can answer this by plotting the radial axis positions of two loci against each other (Fig. 5C). In these plots, the measurement for a 22′ reference marker was oriented such that the marker lies on the left (−ve value) of the cell short axis. The second chromosomal marker was then measured in that same orientation. Therefore, if the peaks of the distributions are on the same side of the histogram axis, the two markers are likely to be found in the same cell half. If the histogram of the second marker is flat, the two markers are uncorrelated (Supplemental Fig. 2). The spatial relationship between two sister nucleoids can be analyzed similarly.
Figure 5C shows that our data are most consistent with the separated arms model. Furthermore, Supplemental Figure 2 shows that loci on different nucleoid sisters are randomly positioned with respect to each other. These trends are true for all other loci that we tested. We also looked for arm separation along the radial axis in 1 + 1 and 4 + 4 foci cells and obtained similar results (data not shown). Thus, in individual cells, the left and right chromosome arms form two separate, or substantially separate, structures that lie in each cell half along the radial axis irrespective of the replication state of the arms.
The cell radial axis data are consistent with a ring polymer model of the nucleoid
When large circular molecules are confined within a small volume, they are not randomly packed to fill the space available. Instead, they form organized ring polymers in which adjacent segments of the molecular sequence are linearly ordered and collapsed onto each other to form a donut. Such structures can be understood as a series of monomers closely connected to each other to form a donut shape that resembles a circle of beads on a string. In the case of the E. coli chromosome, it is estimated that the completed circular chromosome would form a cross-linked ring polymer consisting of ∼15–65 conceptual monomers with a monomer size up to 440 nm (Pelletier et al. 2012). The internal space in the cell is basically cylindrical with a diameter ∼900 nm under our growth conditions. In such a space, the polymer donut must be laterally compressed into a structure that resembles two parallel chains joined at both ends (Fig. 6A). Molecular dynamics simulations show that the two chains would not mix to form a joint structure (Jung et al. 2012). Rather, thermodynamic demixing would ensure that the chains remain separated from each other and from the cylinder walls. One successful way to model this is to confine the two chains within two imaginary tubes placed side by side within the diameter of the cell cylinder (Fig. 6A, left panel). Thus, the two tubes are restricted to regions that lie on either side of the radial cell axis (Jung et al. 2012). The two arms should give a double peak in the radial axis distribution, thus resembling the two-peak distribution seen in the foci short axis distribution data. In contrast, we would expect the looped ends to give a single-peak distribution because they cross the radial axis most of the time (Fig. 5B, floating model). In order to show this, we ran the simulation shown in Supplemental Figure 3. We assumed reasonable parameters that resemble those predicted for the E. coli case. For this, a hypothetical, nonreplicating E. coli chromosome was contained within an open cylinder of dimensions similar to the cells in our study. It was arbitrarily assumed to have 50 conceptual subunits whose diameter was one-quarter of the cylinder diameter (supercomputer simulations kindly run for us by Youngkyun Jung and Bae-Yeun Ha). The radial axis distributions over time show that the arms give a double-peak distribution and the loop ends give a single-peak distribution as predicted.
Figure 6.

The ring polymer model of the bacterial chromosome. (A) The arms of the polymer can be interpreted as two imaginary tubes confined in each half along the radial axis. The tubes meet at the ori region and result in a single-peak distribution, as depicted in the floating model in Figure 5B. Similar principles apply to more complex topologies. For instance, replication forks can be considered as a three-way junction, and the terminus can be considered as a four-way junction. Their radial axis histograms show a single peak. In contrast, loci in the separated arms show double peaks (Supplemental Fig. 3). (B) A ring polymer in narrow versus wide cylindrical containers. The diameter of E. coli varies in response to changes in growth rate (<600–700 nm in slow-growing conditions and >800–900 nm in faster-growing conditions) (Trueba and Woldringh 1980). The principles illustrated in A are valid when the cylinder is sufficiently wide to accommodate two imaginary tubes (diameter 440 nm) (Pelletier et al. 2012). As the cylinder becomes narrower and only one tube can fit, the global orientation of the polymer should be understood as that of a linear polymer in a cylinder (Jun and Wright 2010). This can explain the conformation of the E. coli chromosome in all growth conditions and the major difference of the chromosome conformation between slow- and fast-growing cells seen in the data.
A general principle is that one-peak distributions should occur whenever two or more imaginary tubes meet (Fig. 6A, left panel). For example, replication forks are where three imaginary tubes join. Similarly, the replicated, colocalized terminus regions can be understood as a four-way junction. The cell radial axis distributions of replication forks (Ssb-GFP) and origin and terminus regions indeed confirm this principle (Fig. 6A, left panel). These results are valid as long as the confining cell is wider than two times the thickness of the polymer chain. The dimensions of E. coli cells vary according to their growth rate, and we discuss the implication of thin cells for slow-growing conditions (Fig. 6B; see the Discussion).
The ring polymer model and the nucleoid duplication cycle
Based on the long and radial axis spatial distributions of the dual chromosome markers and how they develop as cells age, we can predict a progression of the ring polymer model through the cell cycle (Fig. 7). The basic mode of structural dynamics is a symmetric, outward flow of newly replicating chain loops along the long axis of the cell. Unreplicated, older chain loops occupy the cell center and gradually “melt away,” while the adjoining new loops continue to fill the growing volume of the cell as replication progresses. Replication forks are naturally positioned where the older and the newer chain loops exchange information: first at the center of the cell and later at the cell quarters.
Figure 7.

Illustration of spatiotemporal development of the chromosome during overlapping cell cycles using the ring polymer model. The conventional replication diagrams at right are color-coded progressively from origin (purple circles) to terminus (green and marked with a black triangle). We illustrate five critical stages in the cell cycle based on the cell age groups. At left are the corresponding long axis positions, as seen in the data in Figure 2. Colored spheres represent the DNA blocks, corresponding to their replication diagrams at the right. Only the long axis information is shown and not how the DNA is packed into the circular cross-section of the cell. A full animation of the figure is given in Supplemental Movie S2.
There are three salient features of the model. (1) The terminus transition can be regarded as a loop isomerization. The outer loop containing the terminus exchanges positions with the adjacent origin-containing loop (age 0.0–0.2) (Fig. 7). The exchange appears to be a driven process toward a lower free-energy state from (higher free energy) stretched conformations of the ter region (Brochard-Wyart 1993; Jun and Mulder 2006). This may aid, or be aided by, the transfer of terminus attachment from the new cell pole to the cell center by the FtsK DNA translocase and MatP protein. (2) The initial segregation of the duplicated origins is a loop demixing event that is consistent with polymer thermodynamic principles. As the sister origin loops form and grow, they will tend to avoid each other. This initiates origin region segregation and sets up the formation of a new set of polymer chains. The symmetrical growth of the chains that constitutes the flow of sequences away from the fork can be regarded as a continuation of this spontaneous demixing process. (3) The DNA immediately surrounding the forks is extended and nonpolymeric. It links the ends of the polymer chains as a three-way junction. The passing of replicated markers through these regions contributes to the time delay between replication and segregation markers. The actual position of the fork relative to the connected chains depends on the dynamics of dissociation of the DNA from the old chain ends and the gathering of the new DNA to the new chain ends. Thus, the forks are potentially mobile with respect to the polymer ends. The two forks emerging from an origin start out together. We propose that fork pair dissociation is fork movement by simple exchanges of polymerization between chains, as illustrated in Figure 7.
In Figure 7, we depict the typical replicating chromosome as overlapping, connected loops (e.g., age groups 0.0–0.2 and 0.6–0.8). This is supported by both polymer physics and data. If two ring polymers are trapped within the same closed cylinder, they become miscible if the end walls exert sufficient force on them. This results in a partial overlap between the chains of the two polymers (Jun and Wright 2010; Jung et al. 2012). Our data also imply partial mixing between the old and new DNA loops (Supplemental Fig. 4).
Because the termini are attached to the cell center, the axis of ring polymer compression is fixed. The separated chains constitute the two chromosome arms, and the origins are present in the loops that join the chains. The relatively unstructured region surrounding the central replication forks (Fig. 7) would presumably allow rotation of one major segment of the nucleoid relative to the other. This would explain why homologous markers on opposite cell halves are randomly aligned with each other about the radial axis, as discussed previously (Supplemental Fig. 3).
Discussion
The replicating nucleoid has its loci positioned in approximate genetic map order. Thus, the DNA must be locally collapsed into an ordered structure. We showed evidence that the nucleoid consists of a branched donut structure. It is compressed such that its origin regions lie in loops that cross the cell radial axis. Its bulk lies in parallel arms that form much of the nucleoid mass. The complexity of the structure goes beyond the currently available predictions for ring polymers. However, the basic properties of the experimental system are sufficiently in accord with theoretical predictions to provide support for the ring polymer chromosome hypothesis (Jung et al. 2012). This, in conjunction with the finding that the chromosome is a soft entropic spring with physical properties consistent with those of a ring polymer (Pelletier et al. 2012), constitutes strong evidence in favor of the hypothesis.
The developmental pathway that we describe appears to be remarkably unitary. It has been suggested that localized effects such as transertion (insertion of membrane proteins during cotranscription and translation) (Woldringh 2002) and the clustering of ribosomal RNA operons (Cabrera et al. 2009) govern the form of the nucleoid. Expression of membrane proteins can influence positioning of specific chromosomal loci (Libby et al. 2012), and the recent superresolution study is consistent with transertion (Bakshi et al. 2012). Either may be important for local nucleoid structure and may help nucleoid separation of the already demixed nucleoids in later stages (Fig. 7) but does not alter the overall ring polymer pattern.
The proposed model is robust and scalable to different growth rates, including the chromosome in slow-growing conditions. Extra rounds of replication in faster-growing conditions, whether inadvertent or programmed, should not hinder segregation as long as the terminus is confined to the cell center, as is obvious from Figure 7. In contrast, the sporadically replicating chromosome in slow-growing cells is laid out as a linear filament with the origin at the center and the terminus region extended between its ends (Fig. 6B, right panel). Markers on the left (L) and right (R) chromosome arms lie in opposite halves along the cell long axis, and the two nucleoids in dividing cells tend to be in a LRLR configuration (Nielsen et al. 2006b; Wang et al. 2006). This can be explained by the relative physical dimensions of the cells and the chromosomes; that is, E. coli increases its cell width from <600–700 nm (slow-growing conditions) to >800–900 nm (multifork replication in fast-growing conditions) in response to changes in growth rate (Trueba and Woldringh 1980). For the ring polymer-like E. coli chromosome in fast-growing conditions, the thickness of each chromosome arm is ∼440 nm (Pelletier et al. 2012). Thus, the left and right arms of the chromosome cannot fit in slow-growing cells along their radial axis but can fit in fast-growing cells, as illustrated in Figure 6B. The thermodynamic driving force is robust to the topology of the polymer; e.g., linear versus ring (Jun and Wright 2010; Jung et al. 2012).
We think that the proposed model could assure chromosome segregation without the aid of any yet to be discovered biochemical mechanisms. Viewed as a structural isomerization, transfer of the terminus should occur spontaneously. However, proteins that act at the terminus (FtsK and MatP) (Yu et al. 1998; Corre and Louarn 2002; Bigot et al. 2007; Mercier et al. 2008; Sivanathan et al. 2009; Espeli et al. 2012) should certainly be essential for proper segregation in our model, as they establish the correct register of the donut compression. This does not mean that the terminus region should form a macrodomain, and indeed, our data in Figure 4A (bottom panel) argue against the macrodomain model.
We also showed that duplicated origins migrate away from each other bidirectionally along the cell long axis. This initiates the segregation of subsequent markers and is essential for the appropriate placement of the origins and propagation of the nucleoid pattern. This is likely to occur spontaneously by thermodynamic demixing of newly replicated origin DNA loops (Jung et al. 2009). The forks proceed naturally from an origin, thus explaining why they start there as a single Ssb focus and then tend to split up later. A continuation of origin demixing and the subsequent reorganization of the DNA into the polymer chains segregate each marker in turn as replication proceeds and preserve marker order for the next generation. Note that we do not favor that any unknown protein anchors the origin of E. coli. Such proteins have been found in some other bacterial types (Yamaichi et al. 2007; Toro et al. 2008), although in these cases, the cell cycle and chromosome topology differ radically from those in E. coli. Positioning of the E. coli origins, replication forks, and segregation zones may all be natural consequences of the form and thermodynamic properties of the developing nucleoid. It may not require any specialized segregation function with the exception of the terminus translocation mechanism. This has obvious consequences when considering the evolutionary paths of early life forms.
Materials and methods
Strains and growth conditions
The strains used here were derivatives of E. coli strain MG1655 constructed and grown as previously described (Nielsen et al. 2006, 2007). Strain SJ173 expresses the fluorescent proteins Ssb-GFP (green) and HU-mCherry (red) from the native promoters of ssb and hupA on the chromosome. Ssb-GFP was a generous gift from A. Wright (Tufts University). Expression of Ssb-GFP did not affect the activity of the wild-type Ssb. HU-mCherry is functional and was produced as the sole source of HU (Pelletier et al. 2012). HU is a histone-like protein and binds to DNA nonspecifically. HU-mCherry thus uniformly stains the chromosome in vivo. SJ290 expresses functional HU-mCherry proteins and has a fluorescence marker (GFP-ParB–ParS) at the terminus (33.7′).
Media
Cells were grown with aeration in AB minimal medium (Clark and Maaloe 1967) supplemented with 0.2% glucose, 1 mg/mL thiamin, 50 mg/mL casamino acids, and 100 mg/mL ampicillin or, in a single case, in AB medium with 0.2% glycerol, 1 mg/mL thiamin, and 100 mg/mL ampicillin. On reaching OD600 = 0.1, cultures were used directly for microscopy and flow cytometry.
Fluorescence microscopy
Fluorescence microscopy was carried out as previously described (Nielsen et al. 2007). For each cell, the cell length, cell width, and distances from one cell pole of each fluorescent focus were measured automatically as previously described (Nielsen and Hansen 2010). The aspect ratio of each focus and the degree of cell septation were also recorded. In most experiments, ∼10,000 cells were measured for each culture. Data were sorted and processed using Microsoft Excel macro programming.
The quality of focus data
The focus data from cells with two chromosomal labels were of high quality, with >98% of the cells giving usable information. However, the quality of the Ssb focus data was less so. As all cells in the population should have replicating chromosomes (Fig. 1), all should have Ssb foci. However, optimized settings for automated counting scored 32% of the cells as having no foci. These were uniformly distributed among cell age groups and were probably a reflection of the poor signal to noise ratio of the Ssb data in general. However, we cannot completely rule out the possibility that some of these cells represent some particular state of the replication forks that remains undetected.
Estimation of the mass density distribution of the DNA
We can compute the mass density distribution of the chromosome from the positional histograms of the markers. The basic idea is that we have the distribution of every labeled locus along the long and short axes of the cell. Furthermore, we also know the frequency of presence of each and every locus in the measured cell population (this is graphically represented by the area below each distribution in Fig. 2A). For example, see the left column of Figure 2A (cell age 0.0–0.2). Most of the labeled loci are present in two copies, whereas a smaller fraction of ter-proximal loci are present in one copy and almost none in two copies. The spatial distribution of each locus represents the spatial distribution of the segment of the chromosomal DNA containing the locus. For example, consider the three consecutive labeled loci 74.1′, 79′, and 84.2′. The 79′ locus represents the 5-min equivalent chromosomal DNA fraction (from 76.6′ to 81.6′). Thus, by summing up all of the histograms, weighted by the length of the DNA that each locus represents and the area under each histogram, we can infer how the entire chromosomal mass is distributed inside the cell.
An alternate approach is to measure fluorescence intensity from cells with fluorescent DNA-binding proteins (HU-mCherry). However, “quantitative” interpretation of the intensity profile of HU-mCherry along the radial axis of the cell is very hard because it is very sensitive to the signals coming from the out-of-focus planes as well as the unavoidable non-uniform background noise when the cells grow in microfluidics devices. For this reason, comparison with focus data was rather arbitrary, especially because of the binary nature of the focus data (the presence or absence of a focus center). We therefore estimated the overall mass density of the DNA from the positions of all DNA marker foci, as described above.
Estimation of the degree of asynchrony of replication initiation
In the replication fork (Ssb-GFP) histograms in Figure 3A, the transition from two foci to three foci is a good measure of the second round of replication cycle (cf. Fig. 1A). The two groups of cells appear about the same frequency in the whole populations because the areas under the two groups of histograms are about the same. Thus, the transition takes ∼20% of the 55-min generation time, corresponding to ∼10 min of initiation asynchrony (see also Wang et al. 2011).
Orientation of measurements for tests of chromosome arm separation
To test for long axis arm separation, we oriented the focus measurements such that the reference foci always lie on the left side of the graphs (value <0.5). In this way, we could see whether the variable focus lies on the same or the opposite side of the cell (Fig. 6B). When testing for radial axis arm separation, we reoriented each reference focus measurement so that the 22′ focus was always placed on the left of the radial axis (i.e., it has a negative value) (Fig. 5C). The relative position of the variable marker to its nearest 22′ partner was then measured using this same orientation. For either axis, the distributions for the reference and the variable markers computed separately without reorientation would be symmetrical with respect to the axis, hiding any tendency for the two loci to be on separate sides of the axis.
Dividing foci and deeply septate cells
Dividing foci were identified by sorting the data by the shape of the intensity profile of the foci. Cells containing elongated foci with aspect ratios of >1.6 were located automatically and inspected visually. We eliminated the occasional cells where the aspect ratio was influenced by general blurring caused by cell movement on the slide. The automated counting estimated the septation of the cells by measuring the ratio of average cell width (excluding the cell center) to the minimum diameter of the cell at the cell center on a scale of 0 to 1. Cells with septation values of 0.75 were considered deeply septate.
Flow cytometry and analysis of the cell cycle
The number of origins per cell and the cell size profile of the population were determined by flow cytometry as previously described (Nielsen et al. 2006a). The average time of segregation of a given marker was determined as previously described (Nielsen et al. 2006a), except that the segregation of early markers was calculated from the point in the cycle at which 50% of the cells went from two to four foci, and the segregation of later markers was calculated from the point at which 50% of the cells went from one to two foci. Age classes of cells were defined by cell length, assuming that length increases exponentially and that the average newborn cell is of age 0. Thus, cells of age <0 are shorter than average at birth, and cells of age >1 are longer than the average cell at division.
Time-lapse microscopy
The time-lapse experiment of the SJ290 strain in a microfluidic device (Fig. 4) was performed as described in Wang et al. (2010), and the cells were grown under the same growth conditions as in “Strains and Growth Conditions.” In the first eight to 10 generations of the time-lapse experiment, we monitored the growth of the cells only in phase contrast so that the cells reached steady-state growth without any effect of fluorescence illumination. We then acquired fluorescence images every 6 min for either 60 min or 90 min, slightly longer than the average mass doubling time of 55 min. We did not notice any visible slowing of growth during fluorescence imaging.
Molecular dynamics simulation of a ring polymer
The simulation was carried out as previously described (Jung et al. 2012) and was kindly performed for us by Youngkyun Jung (Supercomputing Center, Korea Institute of Science and Technology, Daejeon, Korea) and Bae-Yeun Ha (Department of Physics and Astronomy, University of Waterloo, Waterloo, Ontario, Canada). The radial axis distributions of the instantaneous positions at various lengths from the polymer end were plotted. Because the structure is a soft entropic spring that is in constant motion, the specific points on the polymer present at the ends of the loops will vary with time. Thus, in the case of a model chromosome, the sequences around the origin affected by end proximity will be broader than shown in the figures. The closed ends of the cell may also broaden the effect by limiting the extension of the end loops.
Acknowledgments
We thank Youngkyun Jung and Bae-Yeun Ha for supercomputer simulations data, Sattar Taheri-Araghi for help with time-lapse experiments, and A. Wright for helpful discussions. This research was supported in part by the Intramural Program of the National Cancer Institute (S.J.A.), the Paul G. Allen Family Foundation, the Pew Charitable Trusts, and the National Science Foundation CAREER award (S.J.).
Footnotes
Supplemental material is available for this article.
Article is online at http://www.genesdev.org/cgi/doi/10.1101/gad.231050.113.
Freely available online through the Genes & Development Open Access option.
References
- Adachi S, Kohiyama M, Onogi T, Hiraga S 2005. Localization of replication forks in wild-type and mukB mutant cells of Escherichia coli. Mol Genet Genomics 274: 264–271 [DOI] [PubMed] [Google Scholar]
- Adachi S, Fukushima T, Hiraga S 2008. Dynamic events of sister chromosomes in the cell cycle of Escherichia coli. Genes Cells 13: 181–197 [DOI] [PubMed] [Google Scholar]
- Bakshi S, Siryaporn A, Goulian M, Weisshaar JC 2012. Superresolution imaging of ribosomes and RNA polymerase in live Escherichia coli cells. Mol Microbiol 85: 21–38 [DOI] [PMC free article] [PubMed] [Google Scholar]
- Bates D, Kleckner N 2005. Chromosome and replisome dynamics in E. coli: Loss of sister cohesion triggers global chromosome movement and mediates chromosome segregation. Cell 121: 899–911 [DOI] [PMC free article] [PubMed] [Google Scholar]
- Bigot S, Sivanathan V, Possoz C, Barre FX, Cornet F 2007. FtsK, a literate chromosome segregation machine. Mol Microbiol 64: 1434–1441 [DOI] [PubMed] [Google Scholar]
- Brochard-Wyart F 1993. Deformations of one tethered chain in strong flows. Europhys Lett 23: 105–111 [Google Scholar]
- Cabrera JE, Cagliero C, Quan S, Squires CL, Jin DJ 2009. Active transcription of rRNA operons condenses the nucleoid in Escherichia coli: Examining the effect of transcription on nucleoid structure in the absence of transertion. J Bacteriol 191: 4180–4185 [DOI] [PMC free article] [PubMed] [Google Scholar]
- Clark DJ, Maaloe O 1967. DNA replication and the division cycle in Escherichia coli. J Mol Biol 23: 99–112 [Google Scholar]
- Cooper S, Helmstetter CE 1968. Chromosome replication and the division cycle of Escherichia coli B/r. J Mol Biol 31: 519–540 [DOI] [PubMed] [Google Scholar]
- Corre J, Louarn JM 2002. Evidence from terminal recombination gradients that FtsK uses replichore polarity to control chromosome terminus positioning at division in Escherichia coli. J Bacteriol 184: 3801–3807 [DOI] [PMC free article] [PubMed] [Google Scholar]
- Espeli O, Borne R, Dupaigne P, Thiel A, Gigant E, Mercier R, Boccard F 2012. A MatP-divisome interaction coordinates chromosome segregation with cell division in E. coli. EMBO J 31: 3198–3211 [DOI] [PMC free article] [PubMed] [Google Scholar]
- Fisher JK, Bourniquel A, Witz G, Weiner B, Prentiss M, Kleckner N 2013. Four-dimensional imaging of E. coli nucleoid organization and dynamics in living cells. Cell 153: 882–895 [DOI] [PMC free article] [PubMed] [Google Scholar]
- Gordon GS, Sitnikov D, Webb CD, Teleman A, Straight A, Losick R, Murray AW, Wright A 1997. Chromosome and low copy plasmid segregation in E. coli: Visual evidence for distinct mechanisms. Cell 90: 1113–1121 [DOI] [PubMed] [Google Scholar]
- Hiraga S 2000. Dynamic localization of bacterial and plasmid chromosomes. Annu Rev Genet 34: 21–59 [DOI] [PubMed] [Google Scholar]
- Joshi MC, Bourniquel A, Fisher J, Ho BT, Magnan D, Kleckner N, Bates D 2011. Escherichia coli sister chromosome separation includes an abrupt global transition with concomitant release of late-splitting intersister snaps. Proc Natl Acad Sci 108: 2765–2770 [DOI] [PMC free article] [PubMed] [Google Scholar]
- Jun S, Mulder B 2006. Entropy-driven spatial organization of highly confined polymers: Lessons for the bacterial chromosome. Proc Natl Acad Sci 103: 12388–12393 [DOI] [PMC free article] [PubMed] [Google Scholar]
- Jun S, Wright A 2010. Entropy as the driver of chromosome segregation. Nat Rev Microbiol 8: 600–607 [DOI] [PMC free article] [PubMed] [Google Scholar]
- Jung Y, Jun S, Ha BY 2009. Self-avoiding polymer trapped inside a cylindrical pore: Flory free energy and unexpected dynamics. Phys Rev E Stat Nonlin Soft Matter Phys 79: 061912. [DOI] [PubMed] [Google Scholar]
- Jung Y, Jeon C, Kim J, Jeong H, Jun S, Ha BY 2012. Ring polymers as model bacterial chromosomes: Confinement, chain topology, single chain statistics, and how they interact. Soft Matter 8: 2095–2102 [Google Scholar]
- Lemon KP, Grossman AD 1998. Localization of bacterial DNA polymerase: Evidence for a factory model of replication. Science 282: 1516–1519 [DOI] [PubMed] [Google Scholar]
- Libby EA, Roggiani M, Goulian M 2012. Membrane protein expression triggers chromosomal locus repositioning in bacteria. Proc Natl Acad Sci 109: 7445–7450 [DOI] [PMC free article] [PubMed] [Google Scholar]
- Meinhardt H, de Boer PA 2001. Pattern formation in Escherichia coli: A model for the pole-to-pole oscillations of Min proteins and the localization of the division site. Proc Natl Acad Sci 98: 14202–14207 [DOI] [PMC free article] [PubMed] [Google Scholar]
- Mercier R, Petit MA, Schbath S, Robin S, El Karoui M, Boccard F, Espeli O 2008. The MatP/matS site-specific system organizes the terminus region of the E. coli chromosome into a macrodomain. Cell 135: 475–485 [DOI] [PubMed] [Google Scholar]
- Meyer RR, Laine PS 1990. The single-stranded DNA-binding protein of Escherichia coli. Microbiol Rev 54: 342–380 [DOI] [PMC free article] [PubMed] [Google Scholar]
- Nielsen HJ, Hansen FG 2010. An automated and highly efficient method for counting and measuring fluorescent foci in rod-shaped bacteria. J Microsc 239: 194–199 [DOI] [PubMed] [Google Scholar]
- Nielsen HJ, Li Y, Youngren B, Hansen FG, Austin S 2006a. Progressive segregation of the Escherichia coli chromosome. Mol Microbiol 61: 383–393 [DOI] [PubMed] [Google Scholar]
- Nielsen HJ, Ottesen JR, Youngren B, Austin SJ, Hansen FG 2006b. The Escherichia coli chromosome is organized with the left and right chromosome arms in separate cell halves. Mol Microbiol 62: 331–338 [DOI] [PubMed] [Google Scholar]
- Nielsen HJ, Youngren B, Hansen FG, Austin S 2007. Dynamics of Escherichia coli chromosome segregation during multifork replication. J Bacteriol 189: 8660–8666 [DOI] [PMC free article] [PubMed] [Google Scholar]
- Pelletier J, Halvorsen K, Ha BY, Paparcone R, Sandler SJ, Woldringh CL, Wong WP, Jun S 2012. Physical manipulation of the Escherichia coli chromosome reveals its soft nature. Proc Natl Acad Sci 109: E2649–E2656 [DOI] [PMC free article] [PubMed] [Google Scholar]
- Sivanathan V, Emerson JE, Pages C, Cornet F, Sherratt DJ, Arciszewska LK 2009. KOPS- guided DNA translocation by FtsK safeguards Escherichia coli chromosome segregation. Mol Microbiol 71: 1031–1042 [DOI] [PMC free article] [PubMed] [Google Scholar]
- Toro E, Hong SH, McAdams HH, Shapiro L 2008. Caulobacter requires a dedicated mechanism to initiate chromosome segregation. Proc Natl Acad Sci 105: 15435–15440 [DOI] [PMC free article] [PubMed] [Google Scholar]
- Trueba FJ, Woldringh CL 1980. Changes in cell diameter during the division cycle of Escherichia coli. J Bacteriol 142: 869–878 [DOI] [PMC free article] [PubMed] [Google Scholar]
- Wang X, Possoz C, Sherratt DJ 2005. Dancing around the divisome: Asymmetric chromosome segregation in Escherichia coli. Genes Dev 19: 2367–2377 [DOI] [PMC free article] [PubMed] [Google Scholar]
- Wang X, Liu X, Possoz C, Sherratt DJ 2006. The two Escherichia coli chromosome arms locate to separate cell halves. Genes Dev 20: 1727–1731 [DOI] [PMC free article] [PubMed] [Google Scholar]
- Wang P, Robert L, Pelletier J, Dang WL, Taddei F, Wright A, Jun S 2010. Robust growth of Escherichia coli. Curr Biol 20: 1099–1103 [DOI] [PMC free article] [PubMed] [Google Scholar]
- Wang X, Lesterlin C, Reyes-Lamothe R, Ball G, Sherratt D 2011. Replication and segregation of an Escherichia coli chromosome with two replication origins. Proc Natl Acad Sci 108: E243–E250 [DOI] [PMC free article] [PubMed] [Google Scholar]
- Wiggins PA, Cheverallsa KC, Martin JS, Lintnera R, Kondev J 2010. Strong intranucleoid interactions organize the Escherichia coli chromosome into a nucleoid filament. Proc Natl Acad Sci 107: 4991–4995 [DOI] [PMC free article] [PubMed] [Google Scholar]
- Woldringh CL 2002. The role of co-transcriptional translation and protein translocation (transertion) in bacterial chromosome segregation. Mol Microbiol 45: 17–29 [DOI] [PubMed] [Google Scholar]
- Yamaichi Y, Fogel MA, Waldor MK 2007. par genes and the pathology of chromosome loss in Vibrio cholerae. Proc Natl Acad Sci 104: 630–635 [DOI] [PMC free article] [PubMed] [Google Scholar]
- Yazdi NH, Guet CC, Johnson R, Marko JF 2012. Variation of the folding and dynamics of the Escherichia coli chromosome with growth conditions. Mol Microbiol 86: 1318–1333 [DOI] [PMC free article] [PubMed] [Google Scholar]
- Yu XC, Weihe EK, Margolin W 1998. Role of the C terminus of FtsK in Escherichia coli chromosome segregation. J Bacteriol 180: 6424–6428 [DOI] [PMC free article] [PubMed] [Google Scholar]