

Abstract
Objectives
This work aimed to refine a large animal in minimally invasive reversible middle cerebral artery (MCA) occlusion (MCAO) model to account for leptomeningeal collateral formation.
Materials and Methods
An angiographically based methodology allowed for transient MCA and carotid terminus occlusion in 12 mongrel dogs and assessment of pial collateral recruitment. Outcome measures included 1- and 24-hour magnetic resonance imaging-based infarct volume calculation, a behavioral scale and histopathologic sections.
Results
MCAO succeeded in 8 of 12 dogs (67% efficiency). One-hour postreperfusion infarct volume predicted 24-hour postreperfusion infarct volume (r2 = 0.997, P < 0.0001). Pial collateral recruitment varied with time and reproducibly assessed predicted infarct volume on 1-hour postre-perfusion mean diffusivity maps (P < 0.0001; r2 = 0.946) and 24-hour fluid-attenuated inversion recovery FLAIR magnetic resonance imaging (P < 0.0033; r2 = 0.961). The canine stroke scale score correlated with infarct volumes and pial collateral score.
Conclusion
This canine MCAO model produces defined cerebral infarct lesions whose volumes correlate with leptomeningeal collateral formation and canine behavior.
Keywords: animal models, diffusion tensor imaging, middle cerebral artery infarction, collateral circulation, stroke assessment, angiography
Immediate leptomeningeal collateral recruitment acts as an endogenous protective response in acute ischemic stroke limiting permanent tissue damage because of proximal cerebral artery occlusion. 1-3 Patients with well-developed leptomeningeal collateral formation immediately following onset of acute ischemic stroke tend to have significantly smaller infarct volumes and better outcomes relative to those that have little leptomeningeal collateral recruitment.3,4 In effect, therapeutic strategies enhancing pial collateral recruitment could potentially improve outcomes in the setting of persistent vessel occlusion following acute ischemic stroke.1-5 Recommendations for experimental stroke include development of small and large animal models that accurately allow for the assessment of acute ischemic stroke.6-9 An animal model that allows for the dynamic evaluation of leptomeningeal collateral recruitment to an ischemic territory during acute ischemic stroke can lead to an exploration of variability in the development of pial collateral recruitment and possibly the enhancement of this innate mechanism for neuroprotection. The acute ischemic stroke model presented here uses endovascular transient middle cerebral artery (MCA) occlusion (MCAO) using a coil occlusion method that allows for angiographic confirmation of MCAO, in vivo assessment of infarct volume, pial collateral recruitment during occlusion, and behavioral changes.
MATERIALS AND METHODS
The local institutional animal care and use committee approved the study protocol.
Endovascular Canine MCA Occlusion
Endovascular MCAO materials and methods were optimized in mongrel canines.10 The current model, however, uses an occlusion site that includes the proximal anterior cerebral artery (ACA) and the distal internal carotid artery (ICA) more rigorous physiologic, magnetic resonance imaging (MRI), and digital subtraction angiography (DSA) monitoring, and behavioral testing. Twelve mongrel dogs (20–30 kg) received 300-mg clopidogrel and intravenous heparin. One day before percutaneous intervention, mongrel dogs with a body weight of 20 to 30 kg received a 300-mg loading dose of clopidogrel. On the day of surgery, the animals were sedated with telazol (6 mg/kg bw intramuscularly; vol, <3 mL.) and anesthetized (1.5%–2.0% isoflurane) and ventilated (12 bpm, vol, 5 mL/kg). Continuous cardiac rhythm monitoring, end-tidal CO2, body temperature, and intra-arterial blood pressure were recorded and maintained within physiologic range. In addition pH, paCO2, paO2, HCT, glucose, and hematocrit levels were assessed before the procedure, at the time of occlusion, 30 minutes following occlusion, and after reversing the transient MCAO to ensure normal physiologic range.
Bilateral common femoral artery access was obtained percutaneously using 5 French sheaths. Under fluoroscopic guidance (GE Medical OEC 9800 Plus Cardiac) a 5-French guide catheter was advanced into 1 vertebral artery and connected to pressurized normal saline. A 4-French catheter was entered through the sheath at the contralateral puncture site to provide arteriographic evaluation of the vertebrobasilar arterial system during coil deployment, blood pressure monitoring at the level of the aortic arch, as well as bilateral carotid and vertebrobasilar arteriographic evaluation. Heparin (2500 units) was intravenously administered.
The MCA was accessed via the circle of Willis (Fig. 1). Through the vertebral artery guide catheter an microcatheter (SL-10, Boston Scientific, Natick MA) guided by a microwire (synchro2 soft, Boston Scientific, Natick MA) was advanced into the MCA following which the microcatheter was tracked into the MCA. Papaverine (0.3 mg/mL delivered at 1 mL aliquots) was infused into the vertebrobasilar system to resolve severe vasospasm. After the microcatheter was in place, it was manipulated to deliver an embolic coil (Matrix 3 mm by 20 cm, Boston Scientific, Natick, MA) partly into the MCA to include the M1 segment, partly into the ICA to occlude the distal ICA and partly in the ACA to occlude the ACA origin. Occlusion was confirmed angiographically. If occlusion was not complete, the coil was repositioned. Total occlusion time was 60 minutes. Arteriograms evaluating the vertebrobasilar system and both internal carotid arteries were acquired at 16 frames per second using 4 mL aliquots of iohexol (Omnipaque 300, GE Healthcare) injected though the 4-French catheter at the time of occlusion and every 15 minutes following the occlusion and immediately before removal of the coil to confirm occlusion and evaluate leptomeningeal collateral recruitment. At the end of the transient occlusion, the coil was removed and vertebral and internal carotid arteriograms confirmed reperfusion. The catheters were then removed. Activated clotting time was measured prior to removal of arterial access and protamine administered to reverse heparinization before the removal of common femoral artery sheaths. Suture was percutaneously applied at the arteriotomy sites for hemostasis. The animals underwent MRI under anesthesia 1-hour and 24 hours after reperfusion. Canines were euthanized (Euthasol, intravenous, 1 mL/4.6 kg) immediately following 24 hours MRI after which necropsy was performed to isolate the brain for histopathologic evaluation.
FIGURE 1.
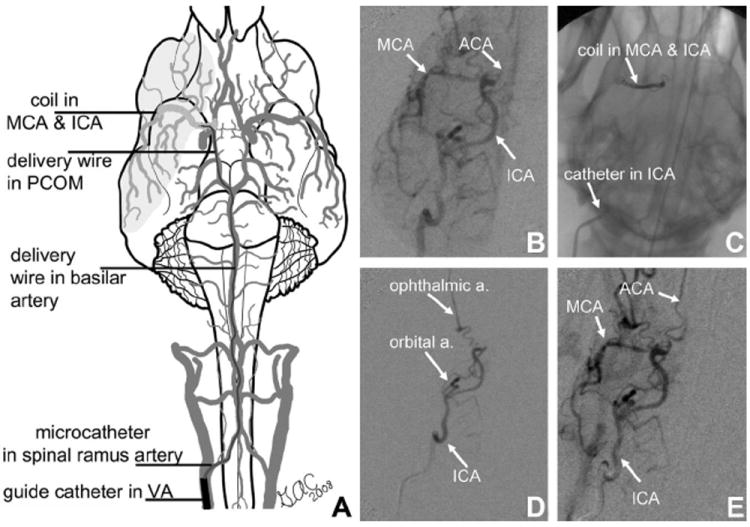
Minimally invasive approach to MCA occlusion in canine. A, (Adapted from Thrombus and Stroke. New York, NY: Informa Health Care USA Inc9) illustrates coil placement within the MCA, proximal ACA, and carotid terminus. Right internal carotid arteriograms before (B), during (D), and following reperfusion (E) confirm MCA and ICA bifurcation occlusion using retrievable Matrix embolic occlusion coil (C) and reperfusion following its removal (E). Reverse filling of potential external carotid collateralization (ie, orbital artery) (D) indicates that they do not provide collateral flow to the occluded territory.
Potential exclusion criteria during the surgery include perforation of intracranial vasculature that may be avoided with meticulous technique, mechanical vasospasm resulting in vertebrobasilar artery or posterior communicating artery territory occlusion, inadequate MCAO, or excessive bleeding from the arteriotomy sites, and monitored physiologic and hematologic testing out of normal range.
Behavioral Testing
Six hours following the occlusion, canines were assessed for forelimb sensory and motor function using paw-placing tasks walking, visual and tactile responsiveness, spontaneous limb use, and preferential gaze. A simple 10-point stroke scale scoring system (Table 1), based on an assessment of level of consciousness, gaze, vision, ability to walk, and sensory function, was adapted from the National Institutes of Health Scale Scoring system.11 Neurologic assessment was performed by a stroke neurologist (Y.M.). Animals were excluded from behavioral testing if sedatives were administered within 2 hours of the examination.
TABLE 1.
Canine Behavioral Stroke Scale Scoring System
| Level of consciousness | 0 = Alert, keenly responsive |
| 1 = Not alert; arousal by minor stimulation | |
| 2 = Not alert; requires repeated stimulation to attend, or requires strong or painful stimulation to move | |
| 3 = Responds only with reflex motor or totally unresponsive, flaccid and areflexic | |
| Best gaze | 0 = Normal |
| 1 = Gaze is abnormal in one or both eyes, but forced deviation or total gaze paresis is not present | |
| 2 = Forced deviation | |
| Visual | 0 = Normal |
| 1 = Hemianopsia | |
| Motor | 0 = Normal |
| 1 = Mildly impaired (limp) | |
| 2 = Significantly impaired | |
| 3 = Unable to walk | |
| Sensory | 0 = Normal |
| 1 = Impaired |
Magnetic Resonance Imaging
Evaluation of the infarct volume was accomplished using an 8-channel sensitivity encoding knee coil in a 3 T MRI (Achieva, Philips Healthcare) imaging system. Images were obtained 1 hour after reperfusion and at 24 hours. Sequences included the following: diffusion tensor imaging (DTI) (field of view [FOV] = 140 × 140 mm, matrix = 128 × 128, number of excitations [NEX] = 1, repetition time [TR]/echo time [TE] 192–2131/71, slice thickness = 3 mm, b value = 1000, total scan time approximately 4 minutes), T2 turbo spin echo (FOV = 150 mm, matrix = 512 × 512, NEX = 1, TR/TE = 3000/100, slice thickness = 3 mm, total scan time approximately 8 minutes), T2 fluid-attenuated inversion recovery (FLAIR) (FOV = 160 mm, matrix = 512 × 512, NEX = 1, TR/TE/inversion time = 11,000/125/2800, slice thickness = 3 mm, total scan time approximately 8 minutes) and 3-dimensonal time-of-flight magnetic resonance angiography (FOV = 150 mm, matrix = 512 × 512, TR/TE = 8.6/3.45, flip angle = 20, slice thickness = 1 mm, total scan time approximately 6 minutes). DTI data were transferred to a work station where mean diffusivity (MD) maps were derived from the 1-hour postreperfursion DTI (FSL 4.1.4, Oxford University). Magnetic resonance angiography helped reconfirm reperfusion to the transiently occluded territory. T2 turbo spin echo images assisted in identifying any unexpected pathology. Infarct volumes were calculated by importing MD maps and FLAIR images into Image J (National Institutes of Health). Two blinded observers (R.M.K., G.A.C.) independently outlined infarct volumes using a semi-automated threshold technique modified from a previously published method,12 as described in Figure 2.
FIGURE 2.
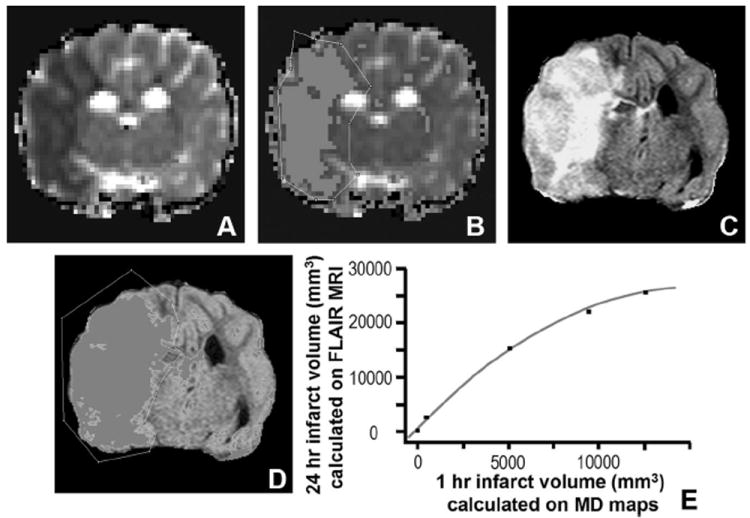
Calculation and correlation of infarct volumes obtained 1 hour and 1 day following reperfusion. MD (A) images obtained 1 hour following reperfusion and FLAIR images (C) obtained 24 hours following reperfusion from a canine status post-transient MCA occlusion. Highlighted regions (B, D) are derived from a threshold set 1.5 standard deviations lower (B) or higher (D) than the average MD (D) or signal intensity (SI) (B) calculated from the contralateral hemisphere. Regions suspected not to represent artifact were outlined and cross-sectional areas were measured. Infarct volumes were then estimated by multiplying the calculated areas by the slice thickness and summing the volumes from each slice. Bivariate polynomial fit (E) for infarct volume determination (r2 = 0.997, P < 0.0001) measured on 1-hour postreperfusion MD (MD) maps versus 24-hour FLAIR imaging (mm3 = cubic millimeters).
Angiographic Evaluation of Leptomeningeal Collateral Recruitment
DSA acquisitions obtained just prior to reperfusion were reviewed to assess leptomeningeal collateral recruitment. An 11-point scale was developed and implemented for this study, which took into account anatomic extent and transit time of leptomeningeal collaterals from the posterior (PCA) and ACA circulations to the affected MCA territory. DSA images were reviewed using a cine viewer (FP image, available at: www.fpimage.com) to identify leptomeningeal collateral reconstitution of the anterior, middle, and posterior aspects of the MCA territory (Figs. 3 and 4). The horizontal portions of the MCA and PCA were used as landmarks dividing the MCA territory into these 3 regions—anterior, middle, and posterior (Fig. 4). Images were compared with the arterial and venous phases of the preocclusion arteriograms on the side of the occlusion. Leptomeningeal collateral recruitment was scored as follows: up to 3 points were given if leptomeningeal collaterals were identified extending over the surface of the brain projecting over each of the 3 sections of the MCA territory (1 point was given if there was reconstitution of arteries identified over the anterior portion of the MCA territory, another if identified over the middle, and another if identified projecting of the posterior region of the MCA territory). An additional point was given for each of these territories (up to 3 more points) if there was reconstitution of branches along the lateral surface of the MCA territory to reach the distal M2 segments flowing in an anteroposterior direction. One additional point was given if there was angiographic reconstitution of the proximal M2 segments and one more if this reached the junction of M1 and M2 segments. Up to 3 additional points were given for transit time. Extent of reconstitution to the ischemic territory was evaluated on images derived from the early venous phase when the jugular vein first opacified. One point was given if there was minimal reconstitution of the MCA territory; another point if there was clear reconstitution of MCA branches over the surface of the brain, and a third point11 if there was reconstitution branches along the lateral surface of the MCA territory along the operculum to the distal M2 branches.
FIGURE 3.
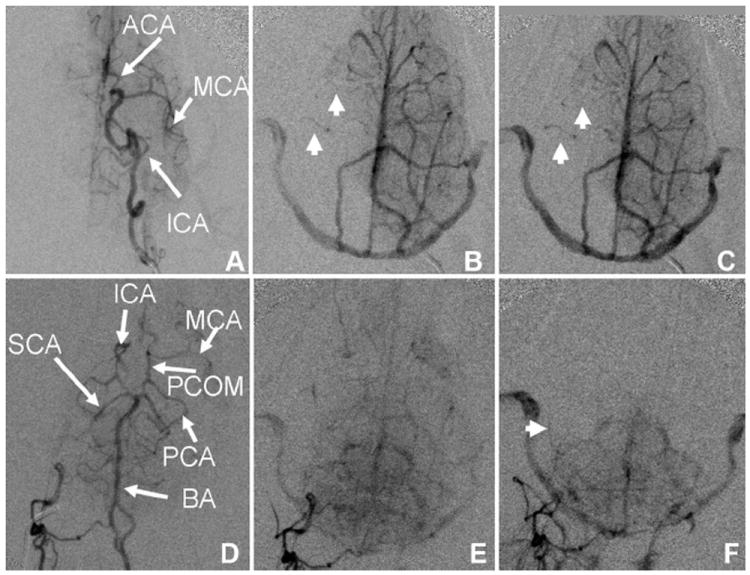
Angiographic evaluation of pial collateral recruitment. Left ICA (A–C) and right vertebral artery (D–F) arterial (A, D) early venous phase (B, E) and late venous phase (C, F) arteriograms during right MCAO demonstrate lack of circle of Willis collateral flow and pial collateral recruitment with reconstitution of right MCA territory branches (arrowheads). Circulation time is assessed by comparing the extent of pial collateral recruitment at the time contrast arrives to the jugular veins (B, E). SCA indicates superior cerebellar artery; BA, basilar artery.
FIGURE 4.
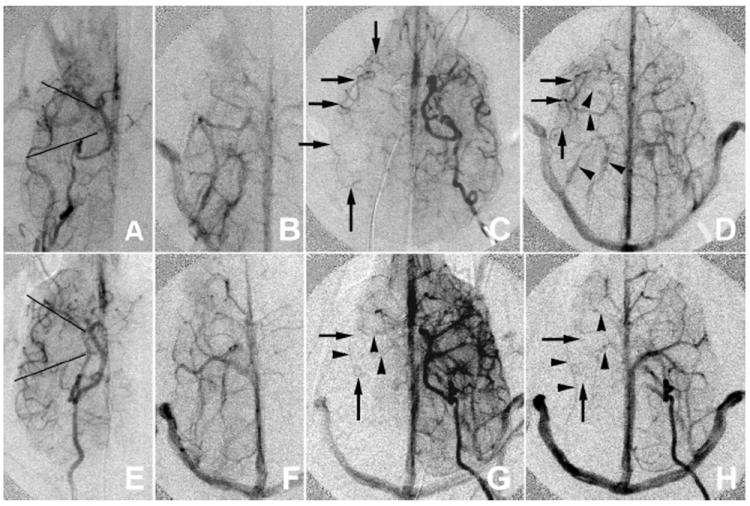
Comparison of canines with good (A–D) and poor (E–H) collateral formation. Preocclusion arterial (A, E) and venous (E, F) phases are compared with intraocclusion early (C, G) and late (D, H) venous phase ICA arteriogram images. Preocclusion images help identify the location of reconstituted MCA vasculature. Only arteries are used in the leptomeningeal collateral assessment. Opacified veins (arrowheads) are studied so that they are not confused with arteries (arrows). The MCA territory is divided into anterior middle and posterior portions divided by lines projecting over the horizontal portions of M1 and P1 (A, E). The dog with poor leptomeningeal recruitment (E–H) has no reconstitution of MCA vessels along the lateral aspect of the territory whereas in the dog with good pial collaterals (A–D) there is reconstitution of the MCA branches along the lateral aspect of the MCA territory and even the distal M1 segment in the early venous phase. The early venous phase (first opacification of the jugular vein) is used to assess transit time.
Statistical Analysis
Statistical analysis was performed using JMP software version 5.1 (SAS; Cary, NC). Pial collateral score at 60 minutes and canine stroke scale score (CSSS) were correlated to infarct volume measured on 1-hour postreperfusion MD maps and 24-hour FLAIR MRI using linear fit analysis. Bland-Altman statistic13 was used to assess the reproducibility of infarct volume calculation and leptomeningeal collateral scoring between 2 observers. Bivariate linear fit analysis and polynomial fit analysis were used to determine how well infarct volume calculated at 1-hour postreperfusion correlated with infarct volume calculated at 24 hours.
Histology
Following isolation of the brain during necropsy, continuous 3-mm coronal slices were collected throughout the ipsilateral and contralateral hemispheres using a canine brain matrix (Ted Pella Inc, Redding, CA). Sections were rinsed in phosphate buffered saline, embedded in OCT compound (Sakura Finetek, Torrance, CA) and frozen at −80°C. OCT embedded slices were subsequently cut in 8-μm thick sections on a Leica CM 3050S cryostat with a CryoJane tape transfer system (Leica Microsystems, Wetzlar, Germany) and mounted onto slides for histologic determinations. Hematoxylin and eosin staining of frozen canine brain tissue was performed to contrast gross stroke pathology in infarct affected and contralateral control tissue as previously described.10 Five times FOV images were stitched using Axiovision Mosaix tiling module for high-resolution composite of contralateral and stroke hemisphere.
RESULTS
Twelve mongrel dogs were used for this study. Four were excluded (2 because of vessel perforation, 1 because of posterior communicating artery occlusion, and 1 because of incomplete occlusion). Both vessel perforations occurred during coil deployment at the distal ICA while attempting to reposition the coil. Therefore, overall efficiency was 67%. Five of 8 animals with successful MCAO survived 24 hours. Physiologic parameters monitored in this study were within physiologic range for the animals entered into the analysis. Postreperfusion arteriograms confirmed reperfusion in all cases with no evidence for peripheral thrombotic events. Experience with occlusion both at the horizontal portion of the MCA from previous work10 versus occlusion that also included the distal ICA and proximal ACA in this study indicates that the latter occlusion was less technically challenging and less susceptible to recanalization. Bland-Altman statistic for leptomeningeal collateral score was 22.6% indicating that 95% of calculated scores were within 1.3 point of each other. Mean difference between 2 observers for pial score was 0.23 (σ = 0.69) for a mean score of 5.9 and an individual intraclass correlation of 0.98 (mean, 0.99). Pial collateral score and the CSSS correlated with infarct volume determinations (Fig. 5). Two animals received sedation within 2 hours of behavioral testing and were therefore excluded from analysis for behavioral testing.
FIGURE 5.
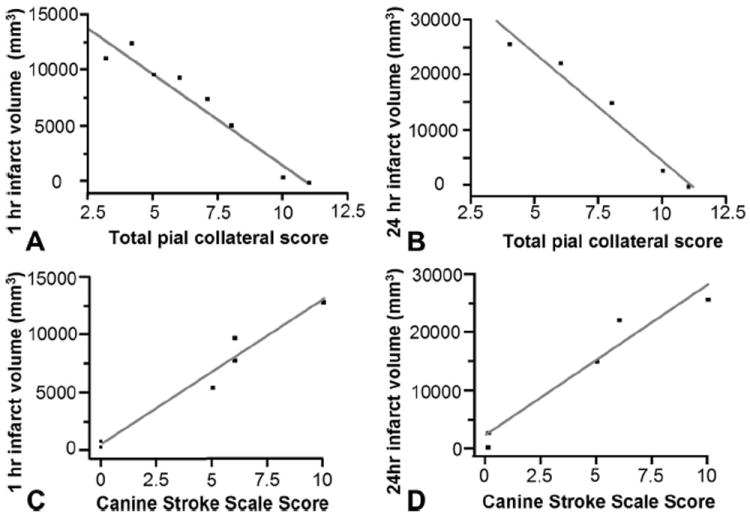
Bivariate linear fit for infarct volume versus pial collateral score and CSSS. Infarct volume in cubic millimeters was measured on 1-hour postreperfusion MD maps and 24-hour FLAIR MRI. Pial collateral score correlated with 1 hours postreperfusion MD maps (P < 0.0001; r2 = 0.946) and 24-hour FLAIR MRI (P = 0.0033; r2 = 0.961). CSSS correlated with 1 hours postreperfusion MD maps (P = 0.0006; r2 = 0.961) and 24-hour FLAIR MRI (P = 0.0063; r2 = 0.941).
Among animals that survived 24 hours, MD volume calculations were highly predictive of 24-hour volume calculations (Fig. 2) with a better polynomial fit (r2 = 0.997, P < 0.0001) versus linear fit (r2 = 0.961, P < 0.0001). Bland-Altman statistic for infarct volume calculated at 24 hours was 15.9% at 1 hour and 5.8% at 24 hours. Between 2 observers, 95% of volume estimates were within those percentages. (intraclass correlation for MD = 0.99 mean and 0.98 individual with 139 mm3 mean difference σ = 477; intraclass correlation for FLAIR MRI = 0.99 mean and 0.99 individual with 335 mm3 mean difference σ = 198). Histopathologic sections confirmed presence of cerebral infarction in all specimens examined (Fig. 6).
FIGURE 6.
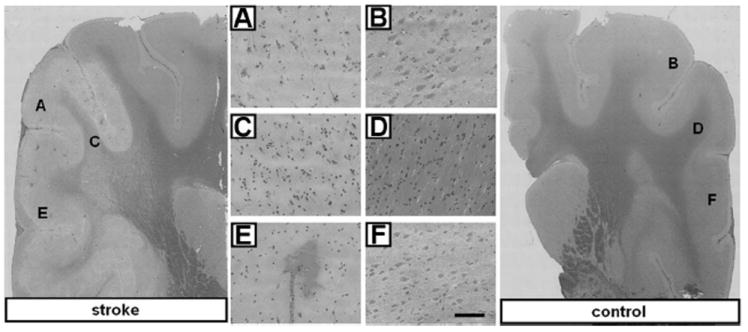
Histochemical comparison of 24 hours poststroke infarct and contralateral control tissue. Representative hematoxylin and eosin stained coronal sections from stroke and contralateral control brain tissue 24 hours after MCA occlusion and reperfusion. Cell bodies of infarct affected tissue in stroke affected hemisphere appear shrunken and pyknotic as compared with those of control tissue. Twenty times magnified FOV in S1 somatosensory cortex (A vs. B) and cerebral white matter (C vs. D). E, Intense eosin staining of red blood cells demonstrates evidence of hemorrhagic transformation in stroke-affected cortex as compared with (F) contralateral control tissue. Bar = 100 μm.
Pial collateral recruitment varied with time (Fig. 7). Comparing pial collateral scores at the time of occlusion to scores immediately prior to reperfusion there was clear variability in pial collateral score. Although there was no median change throughout the group, pial collateral scores ranged from a decrease of 2 point to an increase of 5 points. Furthermore, the pial collateral score which best correlated with estimated infarct volume at 1-hour postocclusion was immediately prior to reperfusion.
FIGURE 7.
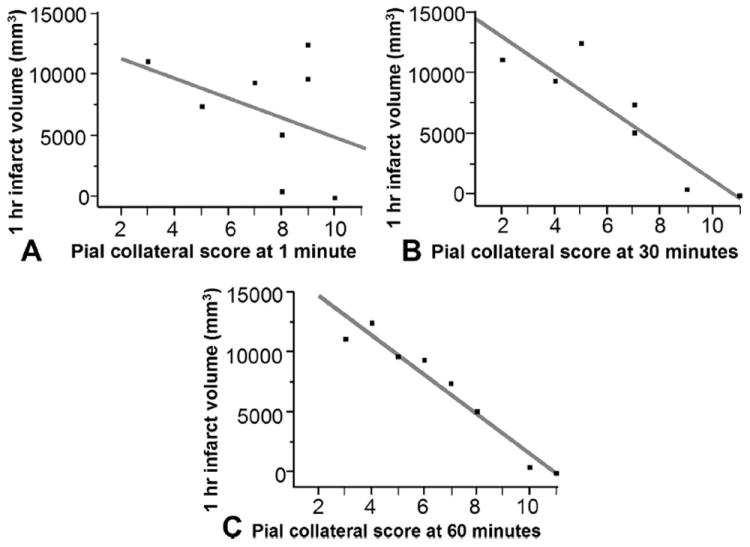
Bivariate linear fit for infarct volume 1-hour postocclusion versus pial collateral score over time. Pial collateral score at the time of occlusion (A) did not significantly correlate with infarct volume (P = 0.332, r2 = 0.156). Whereas pial collateral score at 30 minutes (B) postocclusion (P = 0.0058, r2 = 0.810) and 60 minutes (C) postocclusion immediately prior to reperfusion did (P = 0.0001, r2 = 0.944).
DISCUSSION
The current study demonstrates feasibility of a large animal transient endovascular MCAO model evaluating pial collateral recruitment. Key differences between this model and other models include the following: angiographic confirmation of occlusion and angiographic evaluation of pial collateral recruitment. Angiographic evaluation of potential collateral pathways through the circle of Willis, and external carotid artery9,14 ensured that only pial collateral pathways were able to perfuse the affected tissues. Unlike other endovascular canine MCA occlusion models,9,15 the use of a retrievable coil allows precise placement of the occlusion, reversal of the occlusion, and a global assessment of pial collateral recruitment. MRI assessed infarct volume at 1-hour postreperfusion and 24 hours postreperfusion. Finally, a behavioral scale was developed to assess clinically evident effects of the induced cerebral infarction.
Assessment of pial collateral recruitment shown here allows for dynamic study of pial collateral recruitment during MCAO when evaluating outcomes. Although evaluation of their extent can be predictive of outcomes,1-4 it is unclear whether leptomeningeal recruitment has a cause-effect relationship for outcomes in the setting of acute ischemic stroke. Following are the factors shown to influence leptomeningeal anastomoses: variability in diameter and number, systemic blood pressure, vascular dynamics, age of the patient, N-methyl-d-aspartate receptor activation, and cholinergic neurogenic mechanisms.1,15-18 Pial arterial networks vary between species. Comparative anatomic studies across vertebrate species indicate that the pial network organization along the forebrain of canines is more comparable to primates than that of felines, rabbits, or hens.19 As such, a reproducible assessment of pial collateral recruitment in canines presented here may help in the overall investigation of acute cerebral ischemia.
MRI analysis provided the opportunity to measure infarct volume in vivo. One-hour reperfusion using MD maps closely correlated with 24-hour postocclusion MRI indicating that MD maps may be used as a predictor for infarct volume. This is especially important for larger infarctions where the animal may not survive 24 hours because of brain herniation as demonstrated in animals whose 24-hour occlusion information was not available. On the basis of data recorded in this study, it would be reasonable to use 1-hour postreperfusion MRI as a predictor of 24 hours infarct volume. In the current study, all animals were imaged at the same points following reperfusion, and reperfusion time, and extent were identical in all animals. Furthermore, reperfusion substantially reduces any penumbra zone of oligemic tissue destined to infarct had reperfusion not occurred. This differs from human clinical studies where reperfusion and imaging time relative to time of onset are not controlled, resulting in a poorer correlation between infarct volumes derived from early diffusion imaging and final infarct volumes.20,21
The final infarct volume using MD maps correlated best with a polynomial fit (Fig. 2). Vasogenic edema 24 hours after reperfusion with associated mass effect occurring within a confined space is not yet realized 1 hour following occlusion. Because the space within the cranial vault is confined,22 a smaller proportional volume growth of large versus small cerebral infarcts is expected.
Potential problems that may occur with this endovascular animal model include perforation of intracranial vasculature and mechanical vasospasm leading to vertebrobasilar infarction. These pitfalls may be avoided with meticulous technique and periodic administration of spasmolytic agents. Proximal occlusion at the communicating segment of the ICA often resulted in large infarct volumes, which can result in brain herniation and death when vasogenic edema ensued. Although this did not affect assessment of pial collateral formation and 1-hour postreperfusion MRI, it affects histopathologic assessment at 24 hours. Postoperative ventilator support could allow for longer animal survival times. Alternatively, occlusion along the distal M1 segment would lead to smaller infarct volumes avoiding brain herniation; however, meticulous technique would be needed for more distal occlusion sites.
The intended role of this model is to study leptomeningeal collateral formation. Individual variablity in leptomeningeal collateral formation defined with a 1-hour transient occlusion in this model may limit its use for evaluation of acute ischemic stroke because of the resultant variability in infarct volumes. However, extending the occlusion time may lead to more reproducible infarct volumes but in doing so would limit the model when evaluating leptomeningeal collateral formation. As mentioned earlier, individual variability in leptomeningeal collateral formation is present in humans but is poorly understood. It is hoped that the model presented here will allow for the study of this variablity. This model was not intended to address thrombolysis using tissue plasminogen activator. In general, the intrinsic fibrinolytic system of canines is more active than that of humans and as a result is not as readily suited for evaluation of thrombolytic agents.23,24
CONCLUSION
An endovascular approach to transient MCA occlusion is feasible and can consistently produce infarct lesions in the canine neocortex, which correlate to leptomeningeal collateral formation and canine behavior using the scoring systems described. MD maps generated 1-hour postreperfusion following transient MCA occlusion in a canine model can serve as a reliable measurement for infarct volume determination. Preliminary findings indicate that leptomeningeal collateral recruitment varied over time. Among the points studied, leptomeningeal collateral recruitment immediately before reperfusion was most predictive of infarct volumes. This method can potentially serve as an excellent preclinical model to study leptomeningeal collateral recruitment during acute ischemic stroke and span the translational gap that exists between laboratory and clinical stroke outcomes.
Acknowledgments
Supported in part by NIH NS42617 (to C.K.S.); by the Ohio State Wright Center for innovation (to M.K.); and Material product by a Boston Scientific research grant (to G.A.C.).
References
- 1.Brozici Mç, van der Zwan A, Hillen B. Anatomy and functionality of leptomeningeal collateral anastomoses: a review. Stroke. 2003;34:2750–2762. doi: 10.1161/01.STR.0000095791.85737.65. [DOI] [PubMed] [Google Scholar]
- 2.Bang OY, Saver JL, Buck BH, et al. Impact of collateral flow on tissue fate in acute ischemic stroke. J Neurol Neurosurg Psychiatry. 2008;79:625–629. doi: 10.1136/jnnp.2007.132100. [DOI] [PMC free article] [PubMed] [Google Scholar]
- 3.Christoforidis GA, Mohammad Y, Kehagias D, et al. Angiographic assessment of pial collaterals as a prognostic indicator following intra-arterial thrombolysis for acute ischemic stroke. Am J Neuroradiol. 2005;26:1789–1797. [PMC free article] [PubMed] [Google Scholar]
- 4.Christoforidis GA, Karakasis C, Mohammad Y, et al. Predictors of hemorrhage following intra-arterial thrombolysis for acute ischemic stroke: the role of pial collateral formation. Am J Neuroradiol. 2009;30:165–170. doi: 10.3174/ajnr.A1276. [DOI] [PMC free article] [PubMed] [Google Scholar]
- 5.Wu S, Thornhill RE, Chen S, et al. Relative recirculation: a fast, model-free surrogate for the measurement of blood-brain barrier permeability and the prediction of hemorrhagic transformation in acute ischemic stroke. Invest Radiol. 2009;44:662–668. doi: 10.1097/RLI.0b013e3181ae9c40. [DOI] [PubMed] [Google Scholar]
- 6.Stroke Therapy Academic Industry Roundtable (STAIR) Recommendations for standards regarding preclinical neuroprotective and restorative drug development. Stroke. 1999;30:2752–2758. doi: 10.1161/01.str.30.12.2752. [DOI] [PubMed] [Google Scholar]
- 7.Dirnagl U. Bench to bedside: the quest for quality in experimental stroke research. J Cereb Blood Flow Metab. 2006;26:1465–1478. doi: 10.1038/sj.jcbfm.9600298. [DOI] [PubMed] [Google Scholar]
- 8.Traystman RJ. Animal models of focal and global cerebral ischemia. ILAR J. 2003;44:85–95. doi: 10.1093/ilar.44.2.85. [DOI] [PubMed] [Google Scholar]
- 9.Gounis MJ, Sicard KM, Wakhloo AK, et al. In vivo experimental models of focal ischemic stroke. In: Wakhloo AK, Gounis MJ, Lieber BB, et al., editors. Thrombus and Stroke. New York, NY: Informa Health Care USA Inc; 2008. pp. 39–55. [Google Scholar]
- 10.Rink C, Christoforidis G, Abduljalil A, et al. Minimally invasive neuroradiologic model of preclinical transient middle cerebral artery occlusion in canines. Proc Natl Acad Sci USA. 2008;105:14100–14105. doi: 10.1073/pnas.0806678105. [DOI] [PMC free article] [PubMed] [Google Scholar]
- 11.Lyden P, Lu M, Jackson C, et al. Underlying structure of the National Institutes of Health stroke scale: results of a factor analysis. Stroke. 1999;30:2347–2354. doi: 10.1161/01.str.30.11.2347. [DOI] [PubMed] [Google Scholar]
- 12.Kazemi M, Silva MD, Li F, et al. Investigation of techniques to quantify in vivo lesion volume based on comparison of water apparent diffusion coefficient maps with histology in focal cerebral ischemia in rats. Magn Reson Imaging. 2004;22:653–659. doi: 10.1016/j.mri.2004.01.043. [DOI] [PubMed] [Google Scholar]
- 13.Bland JM, Altman DG. Measuring agreement in method comparison studies. Stat Methods Med Res. 1999;8:135–160. doi: 10.1177/096228029900800204. [DOI] [PubMed] [Google Scholar]
- 14.Miller ME, Christensen GC, Evans HE. Miller’s Anatomy of the Dog. Philadelphia, PA: WB Saunders; 1964. [Google Scholar]
- 15.Loftus CM, Greene GM, Detwiler KN, et al. Studies of collateral perfusion to canine middle cerebral artery territory. Am J Physiol. 1990;259:H560–H566. doi: 10.1152/ajpheart.1990.259.2.H560. [DOI] [PubMed] [Google Scholar]
- 16.Christoforidis GA, Mohammad Y, Kontzialis M, et al. Predictors for good pial collateral formation in acute ischemic stroke. Stroke. 2008;2:606. [Google Scholar]
- 17.Robertson SC, Loftus CM. Effect of N-methyl-d-aspartate and inhibition of neuronal nitric oxide on collateral cerebral blood flow after middle cerebral artery occlusion. Neurosurgery. 1998;42:117–124. doi: 10.1097/00006123-199801000-00023. [DOI] [PubMed] [Google Scholar]
- 18.Baramidze D, Mchedlishvili G, Gordeladze Z, et al. Cerebral microcirculation: heterogeneity of pial arterial network controlling microcirculation of cerebral cortex. In J Microcirc Clin Exp. 1992;11:143–155. [PubMed] [Google Scholar]
- 19.Mchedlishvili G, Kuridze N. The modular organization of the pial areterial system in phylogeny. J Cereb Blood Flow Metab. 1984:391–396. doi: 10.1038/jcbfm.1984.57. [DOI] [PubMed] [Google Scholar]
- 20.Rivers CS, Wardlaw JM, Armitage PA, et al. Acute ischemic stroke lesion measurement on diffusion-weighted imaging-important considerations in designing acute stroke trials with magnetic resonance imaging. J Stroke Cerebrovasc Dis. 2007;16:64–70. doi: 10.1016/j.jstrokecerebrovasdis.2006.11.003. [DOI] [PubMed] [Google Scholar]
- 21.Na DG, Thijs VN, Albers GW, et al. Diffusion-weighted MR imaging in acute ischemia: value of apparent diffusion coefficient and signal intensity thresholds in predicting tissue at risk and final infarct size. Am J Neuroradiol. 2004;25:1331–1336. [PMC free article] [PubMed] [Google Scholar]
- 22.Loubinoux I, Volk I, Berredon J, et al. Spreading of vasogenic and cytotoxic edema assessed by quantitative diffusion and T2 magnetic resonance imaging. Stroke. 1997;28:419–426. doi: 10.1161/01.str.28.2.419. [DOI] [PubMed] [Google Scholar]
- 23.Osterman FA, Bell WR, Montali RJ, et al. Natural history of autologous blood clot embolization in swine. Invest Radiol. 1976;11:267–276. doi: 10.1097/00004424-197607000-00003. [DOI] [PubMed] [Google Scholar]
- 24.Kesava P, Graves V, Salamat S, et al. Intraarterial thrombolysis in a pig model: a preliminary note. Am J Neuroradiol. 1997;18:915–920. [PMC free article] [PubMed] [Google Scholar]