Abstract
Blood flow speed is an important functional parameter. Doppler ultrasound flowmetry lacks sufficient sensitivity to slow blood flow (several to tens of millimeters per second) in deep tissue. To address this challenge, we developed ultrasonically encoded photoacoustic flowgraphy combining ultrasonic thermal tagging with photoacoustic imaging. Focused ultrasound generates a confined heat source in acoustically absorptive fluid. Thermal waves propagate with the flow and are directly visualized in pseudo color using photoacoustic computed tomography. The Doppler shift is employed to calculate the flow speed. This method requires only acoustic and optical absorption, and thus is applicable to continuous fluid. A blood flow speed as low as 0.24 mm·s−1 was successfully measured. Deep blood flow imaging was experimentally demonstrated under 5-mm-thick chicken breast tissue.
Introduction
High-resolution blood flow imaging in deep tissue offers valuable functional information for diagnosing and assessing many diseases [1–4]. Doppler ultrasound is a longstanding technology that achieves high-resolution non-invasive flow imaging at depths [1]. However, Doppler ultrasound suffers from two major limitations. The first is the poor sensitivity to blood [2]. The Doppler signal relies on ultrasound scattering from flowing blood cells, which is usually much weaker than the scattering from surrounding tissues. Since ultrasound attenuates exponentially with its frequency and propagation path length, low frequency ultrasound is often used to measure blood flow in deep tissue, which weakens scattering even further. The second limitation is that slowly flowing blood cells cause small Doppler shifts, which are difficult to separate from Doppler signals due to surrounding tissues. These limitations make Doppler ultrasound difficult to measure slow flow without contrast agents [2, 5, 6]. A new technique that can measure slow blood flow should find many biomedical applications, such as functional brain imaging, early cancer detection and treatment monitoring, and the detection of intraluminal atherosclerotic plagues.
In comparison, photoacoustic (PA) tomography has recently been recognized as a promising technique enabling high-resolution deep in vivo imaging [7–13]. PA imaging provides unique optical absorption contrast beyond the ballistic regime, as well as high sensitivity to blood in the visible and near-infrared spectral range. PA measurement of blood flow has attracted growing interest [14–20]. In the ballistic and quasi-ballistic regimes (~1 mm deep in soft tissue), an optical beam can be effectively focused, allowing for sensing cellular-level features and then readily computing the flow speed. However, in the quasi-diffusive and diffusive regimes, fine features cannot be well resolved. Unlike ultrasound, PA signals tend to have weak speckles and strong boundaries [21, 22], precluding Doppler sensing in continuously absorbing flow. Although time-domain cross-correlation and frequency-domain Doppler shift have been demonstrated on blood mimicking phantoms [14, 17, 19], neither method succeeded in whole blood flow sensing, due to the high density of blood cells. Therefore, high-resolution PA blood flow sensing in deep tissue remains a challenge.
To overcome these challenges in Doppler ultrasound and PA flow sensing, we developed ultrasonically encoded photoacoustic flowgraphy (UE-PAF) for slow blood flow imaging in deep tissue. In UE-PAF, sinusoidally modulated ultrasound is focused into the flowing medium to generate confined heat sources due to acoustic absorption. PA computed tomography is then utilized to image the heat propagation in the fluid, with optical absorption contrast and photoacoustically determined spatial resolution. Since optical absorption is usually orders of magnitude stronger in blood than in surrounding tissues in the visible and near-infrared spectral range, PA imaging of blood provides higher contrast than ultrasound imaging. The PA signal is sensitive to temperature, thus the heat propagation can be clearly imaged in flowing blood. In addition, as the heat source is modulated at a given frequency, its signal can be easily separated from the motion signal of surrounding tissues.
Method
We assume that the ultrasonic heating is fixed at x = 0, the flow speed is vf, the angle between the flow vector and the x-axis is θ, and thermal conduction is negligible during PA imaging. The fluid temperature in response to sinusoidal heating varies according to
| (1) |
where T̃ is the temperature variation from the average temperature, t is the “slow” time instead of the “fast” PA flight time, AT is the amplitude of the temperature variation at x, f0 is the heating modulation frequency, and t0 is a constant. We have , where AT (0) is a constant, α is the thermal diffusivity, and β is a constant coefficient. The detailed derivation of AT (x) can be obtained in the supplemental materials.
The temperature variation refers to the slowly changing temperature induced by ultrasonic heating, rather than the instantaneous temperature rise induced by pulsed optical absorption. The “slow” time refers to sub-second-scale PA measurement time at each laser pulse, and the “fast” time is the microsecond-scale photoacoustic flight time within each PA measurement.
In PA imaging, if the optical excitation is in both thermal and stress confinements, the initial pressure p0 can be approximated as a linear function of temperature [12, 23–25] as
| (2) |
where p0 denotes the magnitude of the initial pressure induced by each laser pulse, a and b are empirical constants, T0 is the average temperature, μa is the optical absorption coefficient, and F is the optical fluence. We assume that T0, μa, and F are time-invariant. The time-variant part of the pressure magnitude p̃0 can be written as
| (3) |
where .
If we measure the pressure point by point, and linearly scan the measurement point along the flow direction at a speed of vm, then we have x = vmt. Eq. (3) then becomes
| (4) |
If the amplitude Ap (vmt) varies slowly, then p̃0 (t) can be separated through envelope detection into an amplitude modulation signal Ap (vmt)and a sinusoidal carrier signal . The Doppler shift of the carrier signal from the heating frequency is
| (5) |
When vm = vf cos(θ), the Doppler shift will reduce the carrier signal to a constant of sin(−2πf0 t0).
In reality, it is difficult to always scan the detection point at the same speed as the blood flow. Instead, we can first acquire a series of two-dimensional (2D) PA images and then re-sample the PA signals at different positions with a certain time interval during post-processing. The artificial scanning speed can be changed by tuning the spatial and temporal step sizes. When the carrier signal of p̃ (t) varies minimally, the tuned scanning speed is equal to the flow speed.
With 2D imaging capability, the phase shift between different positions can also be used to determine the flow speed vf cos(θ). From Eq. (3), at positions x1 and x1+Δx, the phases of the carrier signals are and , respectively. The phase shift is . Simultaneous measurements of p̃0(t, x1) and p̃0 (t, x1 + Δx) give the phase shift of Δφ. With known f0 and Δx, the flow speed vf cos(θ)can be readily determined. Similarly, flow speed can also be calculated from cross-correlation between two consecutive 2D images. These two methods are equivalent to the above Doppler shift method.
Experimental setup
Figure 1 (a) shows a schematic of the UE-PAF system used in experiments. A single-element focused ultrasound transducer is used to sinusoidally heat up a fixed confined volume of blood. The heat propagates with blood flow, generating a temperature gradient along the blood flow direction. At the same time, nanosecond laser pulses are delivered to the blood, inducing PA signals. The laser beam is expanded so that absorbers over a large area are excited simultaneously. A ring-shaped receiving ultrasound transducer array is used to detect the PA waves propagating in different directions. The received PA signals are then reconstructed using backprojection [26] to form two-dimensional images. The value of each pixel is proportional to its local initial pressure rise, which is linearly related to the local temperature. Detailed description of the experimental setup can be found in the supplemental materials.
Figure 1.
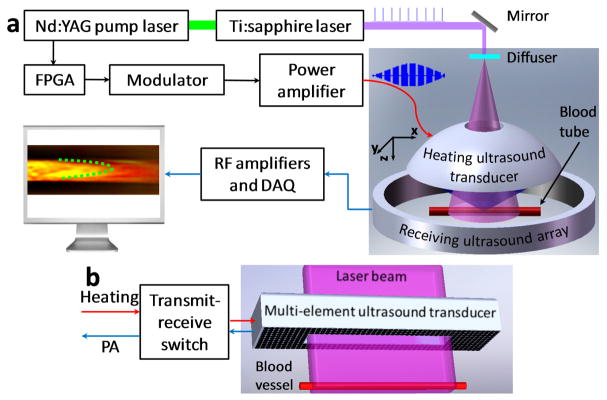
(Color online) (a), Schematic of an ultrasonically encoded photoacoustic flowgraphy (UE-PAF) system. (b) Conceptual design of a reflection-mode UE-PAF probe.
Taking advantage of the full-ring receiving aperture, we can set the reconstruction x-axis to be along the flow direction, so that the angle θ is zero and the measured flow speed is vf. It should be noted that in general cases, the measured flow speed is vf cos(θ).
The heating ultrasound transducer is concave with a hole in the center for light delivery. The central frequency and radius for the heating transducer are 7.5 MHz and 24 mm, respectively. The effective heating spot within the blood tube has a diameter of ~1 mm. The average power of the heating ultrasound is adjusted between 2 and 5 W, so that temperature modulation can be observed in the PA signals. The average ultrasound intensity in the blood tube is estimated to be less than 500 W·cm−2.
The current experimental setup, shown in Figure 1 (a), was developed to demonstrate the principles. For future clinical practices, reflection-mode UE-PAF can be developed, allowing easy access to different anatomical sites. Figure 1 (b) shows a conceptual design of a reflection-mode UE-PAF probe. A two-dimensional ultrasound transducer array is used to dynamically focus the heating. The array has an opening in the center, so that an expanded laser beam can pass through. The ultrasound array is also used to receive PA signals. A transmit-receive switch is employed to alternate the ultrasound array between the heating and PA detection modes.
Results and discussions
Reconstructed PA images were first averaged over all frames in several heating cycles, so that a stable background image could be obtained without the thermally induced fluctuations. Then the background image was subtracted from each subsequent PA image, producing a relative temperature change map of the blood, i.e., the bT̃(t, x)μa (x)F(x) term in Eq. (2). The temperature map was color-coded to show the changes from the average temperature. Figure 2 (a) shows a typical photoacoustic image of whole blood without ultrasonically encoding, where no features can be resolved for flow sensing. Figure 2 (b)–(g) present six consecutive images showing the PA signal variations due to heat propagation in flowing whole blood. The heating spot is centered at the middle point of the left edge. Blood flows towards the positive x-axis. Parabolic thermal waves can be visualized as they propagate downstream. Supplementary video 1 shows a movie of the thermal wave propagating in blood flow. To increase the signal-to-noise ratio, the PA changes were averaged over multiple consecutive heating cycles.
Figure 2.
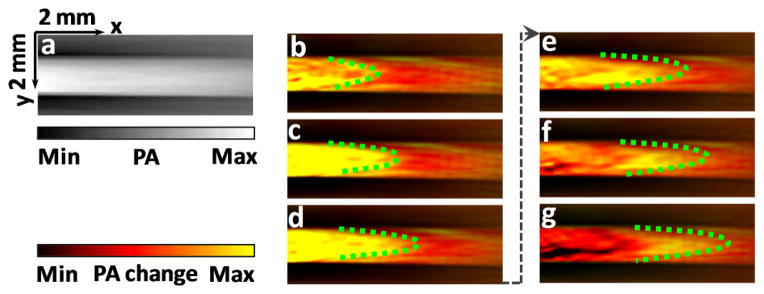
(Color online) (a), A typical photoacoustic image of blood flow without ultrasonically encoding. (b)–(g), Ultrasonically-encoded photoacoustic flow images of whole blood in a tube. Time interval between adjacent images is 1.6 seconds. Dashed line highlights a parabolic heating peak propagating with blood flow. PA: photoacoustic.
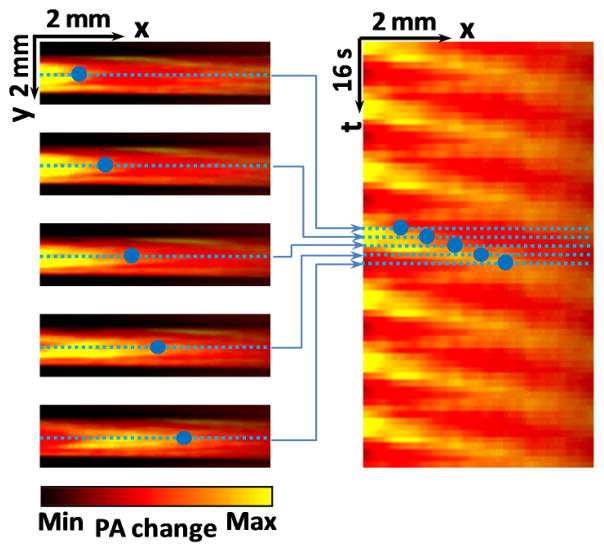
To measure the flow speed, PA flow images were converted into thermal flow trajectories in a spatial-temporal (x-t) plane. As illustrated in Figure 3, for each flow image, one line along the flow path was extracted. Lines from consecutive frames were placed together to form the temporal dimension. The trajectories in the x-t plane were re-sampled along the direction of x = vm t. By adjusting the slope vm, we can determine the flow speed when the re-sampled data reach the minimum variation.
Figure 3.
(Color online) Flow trajectories in x-t plane. Each horizontal line in the right figure is extracted from one photoacoustic image along the flow direction. The blue dots represent a trajectory of a thermally tagged feature. PA: photoacoustic.
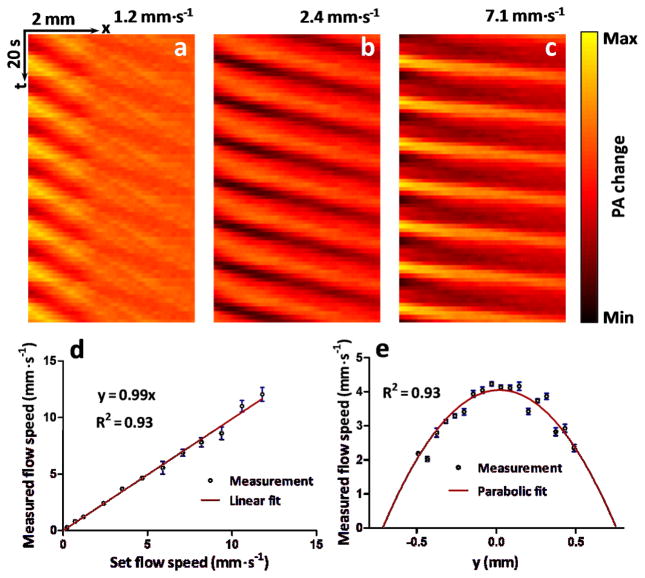
Figures 4 (a)–(c) show three representative thermal trajectory images at different flow speeds. As expected, the steepness of the trajectory on the x-t plane becomes smaller when flow speed increases. The slopes of the thermal trajectories (Δx/Δt) were determined by local peak detection on the x-t plane, followed by linear fitting. A coefficient that converts the trajectory slopes to flow speeds was calibrated by measuring a known blood flow speed. Different flow speeds were set from 0.24 to 11.80 mm·s−1 using a syringe pump. The measured flow speed was plotted in Figure 4 (d). The measurement error was estimated with the normalized root-mean-square deviation (NRMSD), which were 2.7% respectively.
Figure 4.
(Color online) (a)–(c), Representative thermal trajectories at different blood flow speeds. (d), Measured flow speed versus set flow speed. Error bars represent standard errors. N=8 for each flow speed. (e), Flow speed distribution along the radial direction (y-axis) of a cylindrical tube. PA: photoacoustic.
In a blood phantom, we experimentally measured a flow speed as low as 0.24±0.01 mm·s−1, which was less than one fourth of the lowest speed detectable by Doppler ultrasound flowmetry [5]. The limiting factors on slow flow detection are thermal diffusion, the heating spot size, and the signal-to-noise ratio. According to Eq. (3), the slowest detectable flow has to be fast enough so that the fluid can travel through the heating region before the thermal diffusion smoothes the modulated temperature distribution below the noise level. In future studies, the lowest detectable flow speed can be further reduced by optimizing the heating spot size.
The current highest detectable flow speed is 11.8 mm·s−1, limited by the imaging frame rate and the field of view. The current 2D imaging speed is 1.6 second per frame. Because much faster frame rates have been previously demonstrated [27], the highest detectable flow speed can be further improved.
Owing to the 2D PA imaging capability, different flow speeds can be simultaneously measured. Figure 4 (e) shows the flow speed distribution across a round tube with a 1.5 mm inner diameter. A parabolic distribution in the radial direction is clearly identified. For future in vivo blood flow imaging, we can extract points along the curved blood vessels and then calculate the flow speed. If the flow speed changes along the vessel due to diameter change or for other reasons, then average flow speeds can be calculated in small segments. If the blood flow has strong pulsation due to heart beating, we can measure averages flow speeds over multiple pulsation cycles. Assuming the pulsation frequency is stable and can be measured using other methods, we can set the ultrasound heating at a modulation frequency different from the pulsation. Then the pulsation will be averaged out over multiple heating cycles. Moreover, the pulsation in slow flowing vessels is not as strong as that in fast flowing vessels.
With multiple heating spots on different vessels, an even larger flow field can be simultaneously measured, and this can provide higher throughput than point-by-point flow sensing. One possible approach is to employ an ultrasound array to dynamically heat multiple spots in multiple vessels. If they are far enough apart from each other, the contrast will not be affected. The ultrasound heating and PA detection can potentially be performed by the same transducer array to improve alignment and reduce footprint.
Deep flow imaging was demonstrated by measuring blood flow covered with chicken breast tissue. The chicken breast, placed between the blood and the heating ultrasound transducer, diffused the PA excitation light and attenuated the ultrasound heating. As shown in Figure 5, thermal trajectories were clearly visualized under 5 mm thickness. Since both heating and detection resolutions are acoustically defined, the spatial resolution of flow imaging scales approximately linearly with the depth. While the optical penetration depth of the imaging wavelength (800 nm) is high in biological tissue, acoustic attenuation of the heating ultrasound should be considered when imaging deeply. Lower frequency and higher power heating ultrasound transducers can be used to further extend the flow imaging depth.
Figure 5.
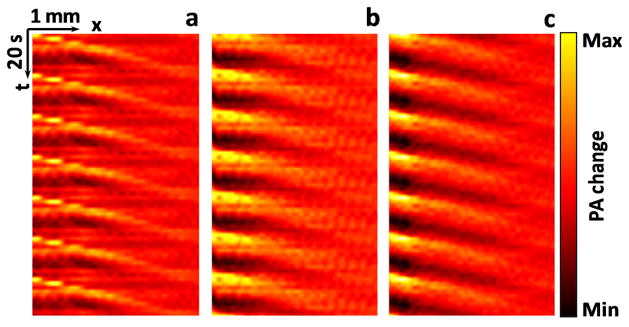
(Color online) Thermal trajectories imaged beneath chicken breast tissue. (a) Without tissue, average of 7 heating cycles. (b) 3-mm-thick tissue, average of 21 heating cycles. (c) 5-mm-thick tissue, average of 35 heating cycles. The flow speed was set to 1.4 mm·s−1. The measured flow speeds for (a)–(c) were 1.5±0.1 mm·s−1, 1.6±0.2 mm·s−1, and 1.5±0.2 mm·s−1 (mean ± standard error, N=8), respectively. PA: photoacoustic.
During the heating, the maximum PA amplitude change was ±6.2%. Because the PA signal depends on temperature in an approximately linear relationship, the estimated temperature fluctuation was ±1.3 °C (room temperature 20 °C). Such a small short-term temperature change should be safe for most in vivo imaging applications. The maximum temperature increase was always monitored during experiments, so that we could adjust the power of the heating ultrasound transducer to avoid overheating.
In blood flow measurement, Doppler ultrasound senses the speed of only blood cells, not the plasma. In contrast, UE-PAF detects blood flow speed of all thermal carriers, including both plasma and blood cells, which could be different. In UE-PAF, acoustic and optical absorption, rather than scattering, provides imaging contrasts, which potentially enables label-free flow imaging of continuous absorptive media.
Conclusion
To summarize, we present an ultrasonically encoded PA flow imaging method. A sinusoidally modulated ultrasound transducer heats the acoustically absorptive flow media and generates thermally tagged features in the fluid. PA computed tomography detects the thermal propagations in the fluid. The Doppler shift of the thermal-tagged features is employed to determine the flow speed. A blood flow speed as low as 0.24 mm·s−1 was successfully measured. Deep blood flow was clearly imaged under 5-mm-thick chicken breast tissue. Based on acoustic and optical absorption, UE-PAF has enabled high-resolution slow flow imaging in deep tissue, addressing a long-standing challenge in PA and ultrasound flow sensing. Combined with spectral imaging, UE-PAF can potentially provide simultaneous measurement of blood flow, oxygen saturation, and even the metabolic rate of oxygen, all in a single modality.
Supplementary Material
Acknowledgments
The authors appreciate Prof. James Ballard’s help with editing the manuscript. This work was sponsored by NIH grants DP1 EB016986 (NIH Director’s Pioneer Award), R01 EB008085, R01 CA134539, U54 CA136398, R01 CA157277, and R01 CA159959. Lihong Wang has a financial interest in Microphotoacoustics, Inc. and Endra, Inc., which, however, did not support this work. Konstantin Maslov has a financial interest in Microphotoacoustics, Inc., which, however, did not support this work.
References
- 1.Benchimol DKBA. JAMA. 1983;249:1502. [Google Scholar]
- 2.Mace E, et al. Nat Meth. 2011;8:662. doi: 10.1038/nmeth.1641. [DOI] [PubMed] [Google Scholar]
- 3.Rowland KJ, et al. Journal of Pediatric Surgery. 2012;47:1143. doi: 10.1016/j.jpedsurg.2012.03.020. [DOI] [PMC free article] [PubMed] [Google Scholar]
- 4.Krumholz A, et al. Journal of Biomedical Optics. 2012;17:060502. doi: 10.1117/1.JBO.17.6.060502. [DOI] [PMC free article] [PubMed] [Google Scholar]
- 5.Ting TH, Newhouse VL, Li Y. Ultrasonics. 1992;30:225. doi: 10.1016/0041-624x(92)90081-v. [DOI] [PubMed] [Google Scholar]
- 6.Heimdal A, Torp H. Ultrasonics, Ferroelectrics and Frequency Control, IEEE Transactions on. 1997;44:873. doi: 10.1109/58.585126. [DOI] [PubMed] [Google Scholar]
- 7.Zhang E, Laufer J, Beard P. Appl Opt. 2008;47:561. doi: 10.1364/ao.47.000561. [DOI] [PubMed] [Google Scholar]
- 8.Wang L, et al. Opt Lett. 2011;36:139. doi: 10.1364/OL.36.000139. [DOI] [PMC free article] [PubMed] [Google Scholar]
- 9.Wang L, et al. Journal of Biomedical Optics. 2012;17:106007. doi: 10.1117/1.JBO.17.10.106007. [DOI] [PMC free article] [PubMed] [Google Scholar]
- 10.Yao J, et al. Journal of Biomedical Optics. 2012;17:080505. doi: 10.1117/1.JBO.17.8.080505. [DOI] [PMC free article] [PubMed] [Google Scholar]
- 11.Gao L, et al. Journal of Biophotonics. 2012 [Google Scholar]
- 12.Gao L, et al. Journal of Biomedical Optics. 2013;18:026003. [Google Scholar]
- 13.Wang L, Maslov K, Wang LV. Proceedings of the National Academy of Sciences. 2013;110:5759. doi: 10.1073/pnas.1215578110. [DOI] [PMC free article] [PubMed] [Google Scholar]
- 14.Fang H, Maslov K, Wang LV. Physical Review Letters. 2007;99:184501. doi: 10.1103/PhysRevLett.99.184501. [DOI] [PubMed] [Google Scholar]
- 15.Chen-Wei W, et al. Ultrasonics, Ferroelectrics and Frequency Control, IEEE Transactions on. 2007;54:1131. doi: 10.1109/tuffc.2007.367. [DOI] [PubMed] [Google Scholar]
- 16.Ma S, Yang S, Xing D. Opt Express. 2010;18:9991. doi: 10.1364/OE.18.009991. [DOI] [PubMed] [Google Scholar]
- 17.Sheinfeld A, Gilead S, Eyal A. Opt Express. 2010;18:4212. doi: 10.1364/OE.18.004212. [DOI] [PubMed] [Google Scholar]
- 18.Yao J, et al. Opt Lett. 2010;35:1419. doi: 10.1364/OL.35.001419. [DOI] [PMC free article] [PubMed] [Google Scholar]
- 19.Brunker J, Beard P. The Journal of the Acoustical Society of America. 2012;132:1780. doi: 10.1121/1.4739458. [DOI] [PubMed] [Google Scholar]
- 20.Sheinfeld A, Eyal A. Biomed Opt Express. 2012;3:800. doi: 10.1364/BOE.3.000800. [DOI] [PMC free article] [PubMed] [Google Scholar]
- 21.Guo Z, Li L, Wang LV. Medical Physics. 2009;36:4084. doi: 10.1118/1.3187231. [DOI] [PMC free article] [PubMed] [Google Scholar]
- 22.Guo Z, Xu Z, Wang LV. Journal of Biomedical Optics. 2012;17:046009. doi: 10.1117/1.JBO.17.4.046009. [DOI] [PMC free article] [PubMed] [Google Scholar]
- 23.Irina VL, Kirill VL, Rinat OE. Journal of Physics D: Applied Physics. 2005;38:2633. [Google Scholar]
- 24.Shah J, et al. Journal of Biomedical Optics. 2008;13:034024. doi: 10.1117/1.294036. [DOI] [PMC free article] [PubMed] [Google Scholar]
- 25.Pramanik M, Wang LV. Journal of Biomedical Optics. 2009;14:054024. doi: 10.1117/1.3247155. [DOI] [PMC free article] [PubMed] [Google Scholar]
- 26.Xu M, Wang LV. Physical Review E. 2005;71:016706. doi: 10.1103/PhysRevE.71.016706. [DOI] [PubMed] [Google Scholar]
- 27.Zemp RJ, et al. Opt Express. 2008;16:7915. doi: 10.1364/oe.16.007915. [DOI] [PMC free article] [PubMed] [Google Scholar]
Associated Data
This section collects any data citations, data availability statements, or supplementary materials included in this article.


