

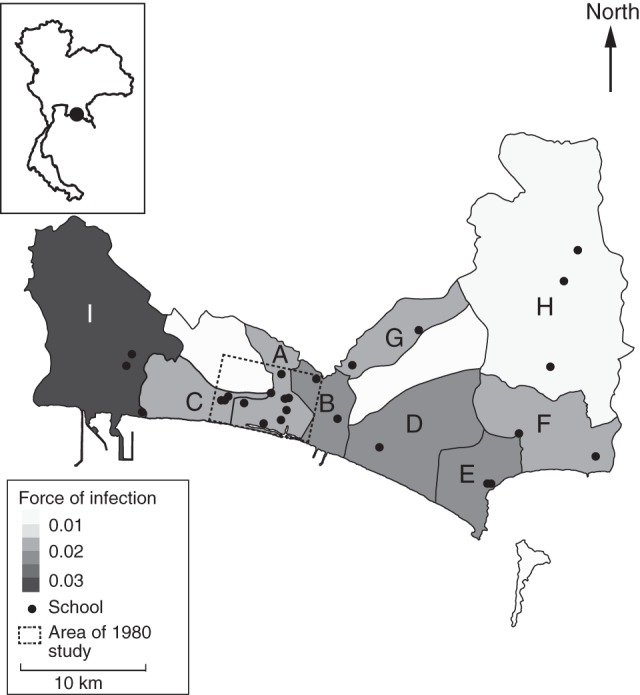
Abstract
Dengue virus has traditionally caused substantial morbidity and mortality among children less than 15 years of age in Southeast Asia. Over the last 2 decades, a significant increase in the mean age of cases has been reported, and a once pediatric disease now causes substantial burden among the adult population. An age-stratified serological study (n = 1,736) was conducted in 2010 among schoolchildren in the Mueang Rayong district of Thailand, where a similar study had been conducted in 1980/1981. Serotype-specific forces of infection (λ(t)) and basic reproductive numbers (R0) of dengue were estimated for the periods 1969–1980 and 1993–2010. Despite a significant increase in the age at exposure and a decrease in λ(t) from 0.038/year to 0.019/year, R0 changed only from 3.3 to 3.2. Significant heterogeneity was observed across subdistricts and schools, with R0 ranging between 1.7 and 6.8. These findings are consistent with the idea that the observed age shift might be a consequence of the demographic transition in Thailand. Changes in critical vaccination fractions, estimated by using R0, have not accompanied the increase in age at exposure. These results have implications for dengue control interventions because multiple countries in Southeast Asia are undergoing similar demographic transitions. It is likely that dengue will never again be a disease exclusively of children.
Keywords: basic reproductive number, critical vaccination fraction, demography, dengue, force of infection, transmission dynamics
Dengue disease has been a major public health problem in Thailand over the past 50 years. Dengue fever and dengue hemorrhagic fever have traditionally affected children, with rare cases in adults, but over the past decades, a shift toward older age groups has been observed (1–3). In the 1980s, the mean age of clinical cases was 8–10 years, but among cases reported during 2002–2008, it had increased to 18 years. This shift has occurred despite a roughly constant number of reported cases over the same period. Similar shifts have been reported in other Southeast Asian countries including Vietnam, Indonesia, and Sri Lanka (1–5).
The following 2 main hypotheses have been proposed to explain this shift: 1) Thailand has undergone dramatic urbanization and development over the last decades that might have led to a reduction in the transmission potential of dengue virus. Thus, the increase in the mean age of cases could reflect exposure later in life, resulting from vector control programs or decreased contact between humans and vectors (e.g., improved housing or increased air conditioning use) (6–9); 2) the shift might be a consequence of the demographic transition taking place in Thailand and other Southeast Asian countries. Mathematical models of disease transmission and computational simulations predict that this transition, characterized by decreasing birth rates and increasing life expectancy, will lead to an increase in the average age at infection, even if the transmission potential of a disease stays the same. Alternative hypotheses include changes in surveillance patterns and changes in the virus itself that might result in more clinical disease among adults or reinfection of those immune to previously circulating viruses.
For multiserotype diseases like dengue, for which the factors associated with symptomatic disease have not been fully characterized, it is not clear that the age distribution of clinically apparent cases represents the age distribution of infection. Secondary infection by a heterotypic serotype has consistently been found to be a main risk factor for developing severe disease after infection (10), but the associations among age, risk of infection, and clinical disease are not well understood. In such instances, inference from the age distribution of cases can be misleading, and age at exposure can be determined only through age-stratified serosurveys.
In December 2010, we conducted an age-stratified, school-based serological survey in Mueang Rayong district, Thailand. This study was designed to replicate a serosurvey conducted in the same location in 1980/1981 to the extent possible (11, 12). By using data from the 2 studies, we estimated serotype-specific forces of infection (λ) and basic reproductive numbers (R0, a measure of transmission potential) for each of the dengue serotypes for the periods 1969–1980 and 1993–2010. Our results suggest that, despite a 50% decrease in the force of infection, R0 (and hence transmission potential) has not changed significantly. These results suggest that factors other than a decrease in the transmission potential might be driving the epidemiologic shift of dengue in Thailand.
MATERIALS AND METHODS
Rayong Province is located in southeast Thailand and is hyperendemic for dengue. It has historically reported 1 of the highest rates of dengue in Thailand (13). The reported dengue incidence was 183.6 per 100,000 population (116,947 cases) in 2010 and, of these, 52.0% (60,770) were cases of dengue hemorrhagic fever (14). We used data from age-stratified serosurveys conducted 30 years apart in the Mueang Rayong district.
1980/1981 Surveys
In 1980 and 1981, 2 school-based age-stratified serosurveys were conducted in the municipal area of Mueang Rayong, Thailand, as part of a then ongoing cohort study. Details about this study have been published elsewhere (11, 12). Dengue serostatus was determined by using a single dilution (1:30) neutralization test. Past exposure to dengue virus (to 1 or more serotypes) was assumed if there was 70% or more plaque reduction to 1 or more dengue serotypes at a 1:30 dilution. In a subsample, the endpoint titer needed to achieve 50% plaque reduction was calculated from 2 or more dilutions. Data from the 1980 serosurvey were previously analyzed by Ferguson et al. (15) to produce estimates of λ and R0.
2010 Survey
In December 2010, we conducted a new school-based, age-stratified serosurvey in Mueang Rayong district. This serosurvey was not limited to the municipal area but included all of the subdistricts within Mueang Rayong. A probabilistic sample of 25 schools and classes were selected from administrative data provided by the Rayong school district administration, and children aged 4–18 years were sampled. Dengue serostatus was determined by using the single dilution neutralization test against the 4 dengue serotypes at a single 1:10 dilution. The decision to use a single 1:10 dilution instead of a 1:30 dilution was based on improved sensitivity when characterizing historical infections (R.J., unpublished data, 2009) and a lack of clarity in the original survey as to the precise methods used for each reported sample. Past exposure to dengue virus was defined as 70% or more plaque reduction to 1 or more dengue serotypes. We used a higher (90%) plaque reduction cutoff to differentiate children with monotypic versus multitypic immunity in order to optimize the specificity of the assay (R.J., unpublished data, 2009). We also assessed several additional plaque reduction cutpoints.
By using the 1980/1981 and 2010 data sets, we estimated the average and serotype-specific forces of infection λ(t) and basic reproductive number R0 in the Mueang Rayong municipal area. To characterize spatial heterogeneity in transmission, we also used the data from the 2010 survey to estimate subdistrict- and school-specific λ(t) and R0. All statistical analyses were performed in R program, version 2.14.0 (R Foundation for Statistical Computing, Vienna, Austria) and JAGS, version 3.1.0 (16).
Estimating the force of infection
The force of infection (λ) is used to characterize transmission hazard in a given setting and is defined as the rate at which susceptible individuals are infected. Age-stratified serosurveys can be used to estimate λ. By assuming that the risk of infection does not vary with age and that immunity is lifelong, the difference in seroprevalence between subjects a and a + 1 year of age can be attributed to transmission that occurred between a and a + 1 year ago. Methods to estimate forces of infection from seroprevalence data have been described elsewhere (15, 17–20).
Given the age ranges in the seroprevalence surveys available, we were able to estimate λ(t) for the periods 1969–1980 (from the 1980/1981 serosurvey) and 1993–2010 (from the 2010 serosurvey). We estimated forces of infection averaged across all serotypes (λ(t)), as well as for each serotype (λi(t)). We fit models assuming a constant force of infection throughout time and models that allowed for yearly time-varying forces of infection (piecewise constant). To produce subdistrict- and school-specific estimates of  , we also fit a random-effects model.
Estimating the basic reproductive number (R0)
R0 is the number of secondary infections generated by a primary infection in a completely susceptible population during the entire duration of infectiousness and, as such, is a measure of transmission potential. For vector-borne diseases, multiple R0 can be estimated (e.g., human-to-mosquito, mosquito-to-human, human-to-human). Here, we estimate the number of secondary human infections that arise from 1 infectious human as mediated through the vector, as proposed by Ferguson et al in 1999 (15). As with λ(t), we provide average estimates of R0 across all serotypes, as well as serotype-specific estimates. Our estimates of R0 assume that individuals can be infected by up to 2 serotypes and are afterward immune to further infection.
At equilibrium, R0 is related to the critical vaccination fraction (V) by the equation 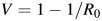 and hence gives insight into the level of control that is required to eventually block transmission (21). We estimated R0 for Mueang Rayong by using our λ(t) estimates and data from the 1980 and 2010 Thailand censuses (22, 23).
Full details on all methods can be found in Web Appendix 1 and Web Figure 1, available at http://aje.oxfordjournals.org/. The protocol for this study was reviewed and approved by the institutional review boards of the Thai Ministry of Public Health (Nonthaburi, Thailand) and the Johns Hopkins Bloomberg School of Public Health (Baltimore, Maryland).
RESULTS
The 1980 and 1981 surveys contained data from 1,009 and 1,235 children aged 0–10 years and 0–7 years, respectively. The 2010 serosurvey included data from 1,736 children aged 4–18 years, of whom 898 lived in the Mueang Rayong municipal area (area of the 1980 and 1981 studies). We excluded from analysis 89 children aged 4 or 5 years from the 2010 data set because of their low participation rate (20%–30%) compared with all other age groups (>50%).
Overall, 59% of the sampled children showed evidence of prior exposure to dengue virus in the 2010 study. Figures 1 and 2 show the age-specific seroprevalence in the 2010 serosurvey compared with the 1980 serosurvey. According to the 1980 survey, 96% of the population had been exposed to dengue by age 11 years. The 2010 survey estimated that only 65% (95% confidence interval (CI): 61%, 75%) of children aged 11 years had been exposed and that, at age 18 years, 18% (95% CI: 10%, 26%) of the population remained susceptible to dengue virus.
Figure 1.

Age-specific dengue seroprevalence in Mueang Rayong district, Thailand, according to the A) 1980, and B) 2010 serosurveys. Numbers on the top of each bar indicate the number of samples in each age group. Whereas the 1980 serosurvey showed that 96% of the population had been exposed to dengue by age 11 years, the 2010 serosurvey showed that only 82% of the population was exposed by age 18 years. DENV-1, DENV-2, DENV-3, and DENV-4 refer to dengue virus serotypes 1–4, respectively, and ≥2 DENV refers to 2 or more dengue virus serotypes.
Figure 2.
Age-specific dengue seroprevalence in Mueang Rayong district, Thailand, according to the 1980 and 2010 serosurveys. Solid lines show the fits of the constant λ(t) (serotype-specific forces of infection) models. Dashed lines show the fits of the time-varying λ(t) model. Bars represent 95% confidence intervals. Results show a significant increase in the age at exposure to dengue virus. DENV-1, DENV-2, DENV-3, and DENV-4 refer to dengue virus serotypes 1–4, respectively, and ≥2 DENV refers to 2 or more dengue virus serotypes.
Force of infection
The estimated time-constant force of infection (λ(t)) for the period 1969–1980 was 0.038 per year (95% CI: 0.036, 0.039). This means that, on average, 3.7% (1 − e−0.038) of susceptible individuals were infected by each serotype each year during this period. In contrast, the estimated time-constant  for the period 1993–2010 was 0.019 per year (95% CI: 0.017, 0.020) for the municipal area, ranging between 0.007 and 0.025 among schools in the municipality. These results suggest a 50% decrease in λ between the 2 periods (Figure 2).
Allowing for time-varying λ(t) (piecewise constant) (Figure 2) significantly improved the fit of the model to the 1980/1981 age-specific seroprevalence data (likelihood ratio test, P < 0.001) but did not significantly improve the fit to the 2010 data (likelihood ratio test, P = 0.1). Results of this time-varying model suggest that transmission intensity was higher in 1969 and 1970 than in the rest of the estimated period but should be interpreted with caution because of the cross-sectional nature of the data.
Basic reproductive number and critical vaccination fraction
By using the estimates of λ(t) and age-specific census data from the 1980 and 2010 censuses, we estimated the average R0 to have been 3.3 (95% CI: 3.1, 3.4) for the period 1969–1980, corresponding to a critical vaccination fraction of 70%. The estimated R0 for the period 1993–2010 was 3.2 (95% CI: 2.7, 3.3) for the municipal area, but ranged from 1.8 to 4.3 among schools in this area. These R0 estimates correspond to a critical vaccination fraction of 69% (range, 44%–77%). Thus, our results suggest that, despite a 50% decrease in λ(t) over the last 30 years, R0 and the critical vaccination fraction have not changed. Results from sensitivity analyses (Web Appendix 2, Web Tables 1 and 2, and Web Figure 2) also suggest decreases in λ(t) that far exceed changes in R0.
Serotype-specific estimates of λ and R0
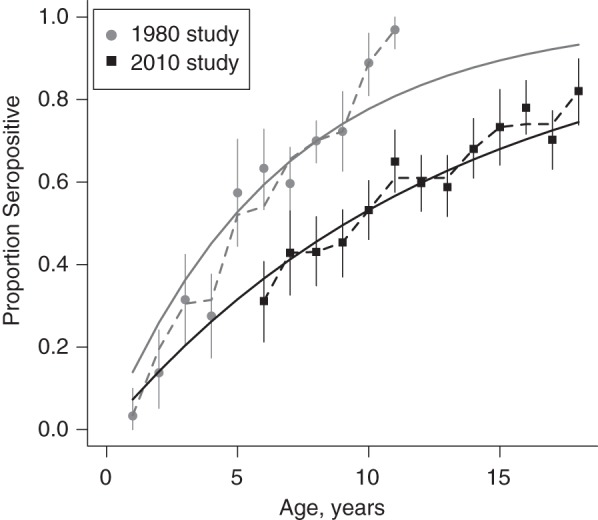
Figure 3B shows our serotype-specific estimates of the basic reproductive number and force of infection for the 2 time periods. These estimates are also consistent with greater reductions in the force of infection across all serotypes (Figure 3A) than in the basic reproductive number. Interestingly, dengue virus serotype 2 seems to continue to cause the highest hazard of infection in Mueang Rayong district. Between 1993 and 2010, R0 and the critical vaccination fraction for dengue virus serotype 2 were 3.7 (95% CI: 3.5, 3.8) and 73%, respectively, which was significantly higher than the corresponding values for the other serotypes.
Figure 3.
Serotype-specific estimates of A) λ(t) (serotype-specific forces of infection), and B) R0 (basic reproductive number) for dengue for the periods 1969–1980 and 1993–2010 in Mueang Rayong district, Thailand. DENV-1, DENV-2, DENV-3, and DENV-4 refer to dengue virus serotypes 1–4, respectively. Although the force of infection has decreased by approximately 50%, changes in R0 have been significantly smaller.
As expected, our serotype-specific estimates of λ(t) for the period 1969–1980 are similar to those produced by Ferguson et al. (15) for the period 1969–1979 (using the 1980 data set only). Our R0 estimates are slightly higher because of the assumptions we made regarding interaction between serotypes (Web Table 1).
Spatial heterogeneity in λ and R0
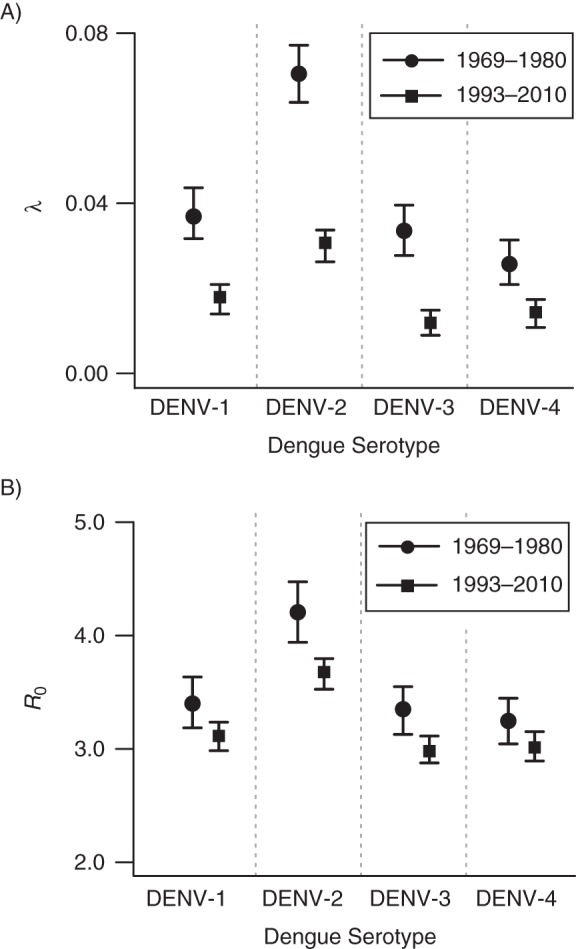
Figure 4 shows our subdistrict-specific estimates of  for the period 1993–2010. The sample included schools in 9 of the 15 subdistricts in Mueang Rayong; therefore, we were able to estimate
  only for these 9 locations.
Figure 4.
Estimated λ(t) (serotype-specific forces of infection) for the 9 subdistricts of Mueang Rayong, Thailand, represented in the 2010 serological study. Locator map on the upper left corner shows the location of Mueang Rayong district (black point) within Thailand. Results show significant heterogeneity in λ(t) among subdistricts. A) Tha Pradu, B) Choeng Noen, C) Noen Phra, D) Taphong, E) Phe, F) Klaeng, G) Na Ta Khuan, H) Ka Chet, and I) Map Ta Phut. Credible intervals of our estimates are provided in Web Table 1, available at http://aje.oxfordjournals.org/.
Our results suggest that there is significant heterogeneity in transmission intensity within the Mueang Rayong district. The between-subdistrict variance in  was estimated to be 0.50 (95% CI: 0.27, 0.54). Relative to Tha Pradu, the subdistrict that includes the central urban area of Mueang Rayong, the
  of subdistricts Choeng Noen and Map Ta Phut were significantly higher during the period 1993–2010 (relative
  s of 1.35 (95% CI: 1.12, 1.63) and 1.91 (95% CI: 1.55, 2.30), respectively), and
  in Ka Chet was significantly lower (relative
  of 0.49 (95% CI: 0.34, 0.67)). Estimates of subdistrict-specific
  and relative
  are provided in Web Table 3.
Heterogeneity in transmission was also significant when looking at finer spatial scales. The between-school variance in  was estimated to be 0.42 (95% CI: 0.20, 0.79) for schools located in the municipality, and
  ranged from 0.009 to 0.024 among these schools. Estimates of
  ranged between 0.007 and 0.044 when all schools in the district were considered.
As expected from the heterogeneity in λ(t), R0 and V were also heterogeneous across subdistricts (Figure 5).The mean R0 in Mueang Rayong district estimated by using this model was 3.2 (95% CI: 2.52, 4.04) but ranged from 1.82 (95% CI: 1.52, 2.20) in Ka Chet to 5.13 (95% CI: 4.38, 5.96) in Map Ta Phut. This implies that the mean critical vaccination fraction can range from 45% to 81% in different subdistricts. School-specific estimates of R0 ranged between 1.71 (V = 0.41) and 6.76 (V = 0.85) and are presented in Web Figure 3.
Figure 5.
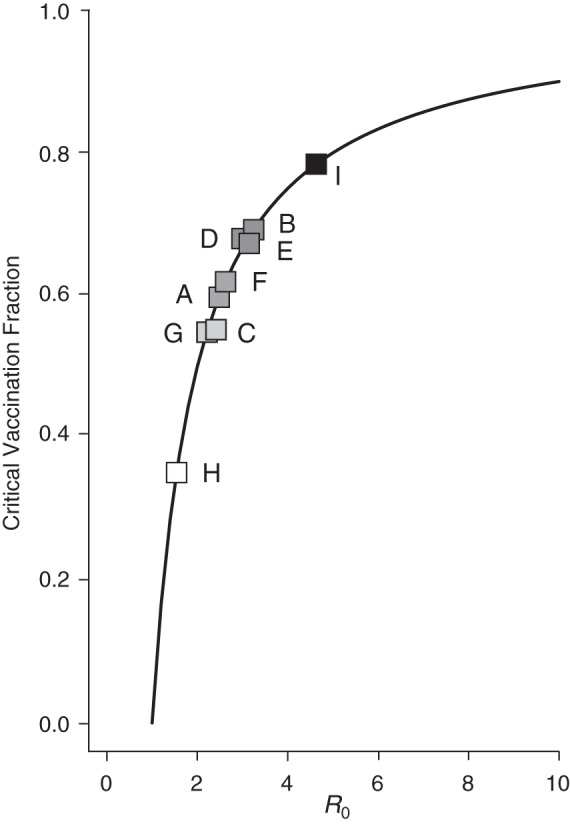
Heterogeneity of R0 (basic reproductive number) and critical vaccination fraction estimates between subdistricts of Mueang Rayong, Thailand. Estimates obtained from the 2010 serological study. Solid line represents the equation V (critical vaccination fraction) . Squares represent the V and R0 estimates for the 9 subdistricts included in the serosurvey. A) Tha Pradu, B) Choeng Noen, C) Noen Phra, D) Taphong, E) Phe, F) Klaeng, G) Na Ta Khuan, H) Ka Chet, and I) Map Ta Phut. Darker shades represent higher R0.
Though it is likely that part of this observed heterogeneity could be explained by demographic or socioeconomic factors, none of the predictors measured in this study (sex, number of household members, access to electricity, vehicle ownership, availability of running water, residence time at address) showed a significant association when included in the random-effects model. Interestingly, Map Ta Phut is a major industrial subdistrict in the region with the highest rates of immigration and mobility of the population.
DISCUSSION
Thailand and several other Southeast Asian countries have experienced a dramatic shift in the age distribution of dengue cases over the last 30 years. Traditionally, severe dengue affected young children, but during recent years, cases have become increasingly common among adolescents and young adults (3, 5) despite a roughly constant incidence. Our results show that underlying this shift there have been significant changes in the age of those exposed and patterns of exposure to dengue virus.
Although several studies have reported shifts in the age of dengue cases, all of these have been based on case data alone and can therefore be biased because of age dependence of clinical disease (24, 25). Our results, from age-stratified serological studies conducted in the same location 30 years apart, suggest a decrease in the force of infection of approximately 50%, with a much smaller, nonsignificant change in R0. These findings are consistent with case data–based results reported previously by several coauthors (3). By using age-specific incidence data, Cummings et al. (3) estimated λ(t) and R0 for the period 1980–2005 for 72 provinces and showed a significant decrease in λ(t) accompanied by a slighter change in R0. These findings imply that, despite urbanization and development in Mueang Rayong district during the last 30 years, the transmission potential and critical vaccination fraction of dengue have not significantly changed.
Our observations are consistent with the shift in age of exposure to dengue being driven by changes in the age structure of the Thai population over the last 30 years (Web Figure 4) (3). The idea that changes in the age structure of populations can lead to changes in the transmission hazard and age distribution of cases has been discussed for several infectious diseases (17, 26). Similarly, the impact of population growth on R0 has also been discussed (27, 28). Decreases in birth rate and increases in life expectancy lead to a decrease in both the rate at which susceptible individuals enter the population and the rate at which immune individuals are removed from it. This results in smaller households, an increased probability of contact with older (immune) people, and, in the case of vector-borne diseases, an increase in the likelihood that infectious bites will be delivered to an already immune person. Because of this reduced hazard, more individuals remain susceptible to primary or secondary infection into adulthood, and infections come from a broader range of age classes.
Although our results suggest that the demographic transition might be a major driving force behind the observed changes in the epidemiology of dengue in Mueang Rayong district, they do not preclude that other factors might also play a role. Mueang Rayong has experienced major changes over the last 30 years, becoming a tourist and industrial center in central/eastern Thailand. Mueang Rayong municipality has undergone progressive urbanization; its population has grown from 38,000 in 1980 to 58,000 in 2010, and its density has increased from 2,190 people/km2 to more than 3,400 people/km2 (29). The mean size of households has decreased from 5.6 in 1980 to 3.1 in 2000, and access to electricity and tap water has become almost universal (30). Furthermore, Thailand reinforced its vector control programs and educational campaigns in the 1990s (31, 32). Though each of these factors may contribute to changes in the serological pattern of dengue infection, major impacts are inconsistent with the small change in R0 over these last 30 years. Extensive longitudinal data (serological, demographic, and entomological) would be necessary to fully characterize the relative contribution of entomological versus demographic factors to the current epidemiologic shift observed in dengue in Thailand and other Southeast Asian countries.
We present the first estimates in 30 years of the basic reproductive number of dengue derived from serological data. Our estimates suggest that R0 of dengue virus serotype 2 is significantly higher than that of other serotypes, implying that it would require a higher level of vaccination to control transmission. However, though our findings show some degree of heterogeneity in transmission potential among serotypes, other sources of heterogeneity seem to be more important. In particular, our results suggest that the critical vaccination threshold might vary by as much as 45% in different locations within the same district, and this difference might be greater when looking at finer spatial scales. Spatial heterogeneity in transmission potential has been previously described for dengue and other vector-borne diseases (33–35) and implies that higher vaccination coverages or targeted vaccination might be required to effectively control transmission. Further characterization of the extent of heterogeneity will be fundamental to designing proper vaccination strategies.
Although the plaque reduction neutralization assay is considered the “gold standard” to characterize immunity after dengue exposure, optimal cutpoints to classify immune responses for seroprevalence studies have not been established. Optimal neutralization cutpoints for the single dilution neutralization test used in this study are also lacking, particularly for differentiating monotypic versus multitypic immunity. We present results from 70% and 90% neutralization based on data (R.J., unpublished data, 2009) suggesting that these might be the optimal cutpoints in terms of sensitivity and specificity, but we performed sensitivity analyses for different neutralization levels (Web Figure 5).
Although estimates of λ(t) from age-stratified serological data are robust to changes in demography, this method of estimating R0 does make the simplifying assumption that the population structures during each period (i.e., 1969–1980 and 1993–2010) were stable and equal to the population structures in 1980 and 2010, respectively. Properly accounting for changes in demography would require incorporating detailed longitudinal population data (mortality, births, migration) into the model and is beyond the scope of our study. Sensitivity analyses in which we used multiple population structures for each time period show that our findings are robust to this assumption, because the estimated reduction in λ(t) between the 2 periods was always much larger than the reduction in R0 (Web Table 1).
Estimates of λ(t) and R0 from seroprevalence data are also sensitive to model choice and to assumptions made regarding mixing of the population and interactions between serotypes, among others. Estimates of R0 are also sensitive to assumptions made regarding force of infection during unobserved periods (e.g., before 1969 and during 1981–1993). Our estimates assume homogeneous mixing and full immunity after 2 infections by heterologous serotypes and ignore short-lived cross-protection between serotypes. They also assume a constant hazard of infection prior to 1969 (equal to the constant hazard in the period 1969–1980). Results from sensitivity analyses suggest that our findings are also robust to these assumptions (Web Tables 1 and 2 and Web Figure 2).
These findings have important implications in the design and implementation of interventions and highlight the relevance of considering changes in demography as drivers of changes in age distribution of infectious diseases. If the demographic transition is in fact a major driving force behind the observed changes in the epidemiology of dengue in Thailand and Southeast Asia, it is very likely that dengue will never again be a disease exclusively of children. Epidemiologic surveillance, control programs, and management of dengue will need to expand and focus on the detection, treatment, and prevention of both adult and childhood cases.
Supplementary Material
ACKNOWLEDGMENTS
Author affiliations: Department of Epidemiology, Johns Hopkins Bloomberg School of Public Health, Johns Hopkins University, Baltimore, Maryland (Isabel Rodríguez-Barraquer, Justin Lessler, Derek A.T. Cummings); Bureau of Epidemiology, Ministry of Public Health, Nonthaburi, Thailand (Rome Buathong, Sopon Iamsirithaworn); Armed Forces Research Institute of Medical Sciences, Bangkok, Thailand (Ananda Nisalak, Richard G. Jarman, Robert V. Gibbons); and Viral Disease Branch, Walter Reed Army Institute of Research, Silver Spring, Maryland (Richard G. Jarman).
We are particularly grateful to the Rayong School District, Rayong Hospital, and the Rayong Provincial Health Office.
Financial support was provided by the National Institute of General Medical Sciences Models of Infectious Disease Agent Study (grant 1U54GM088491-0109 to D.A.T.C. and I.R.B.) and the Bill and Melinda Gates Foundation Vaccine Modeling Initiative (which supported D.A.T.C.). D.A.T.C. holds a Career Award at the Scientific Interface from the Burroughs Wellcome Fund.
The funding sources were not involved in the collection, analysis, or interpretation of data, nor in the writing of the report and decision to submit the paper for publication.
Conflict of interest: none declared.
REFERENCES
- 1.Halstead SB. More dengue, more questions. Emerg Infect Dis. 2005;11(5):740–741. doi: 10.3201/eid1105.050346. [DOI] [PMC free article] [PubMed] [Google Scholar]
- 2.Kongsomboon K, Singhasivanon P, Kaewkungwal J, et al. Temporal trends of dengue fever/dengue hemorrhagic fever in Bangkok, Thailand from 1981 to 2000: an age-period-cohort analysis. Southeast Asian J Trop Med Public Health. 2004;35(4):913–917. [PubMed] [Google Scholar]
- 3.Cummings DA, Iamsirithaworn S, Lessler JT, et al. The impact of the demographic transition on dengue in Thailand: insights from a statistical analysis and mathematical modeling. PLoS Med. 2009;6(9):e1000139. doi: 10.1371/journal.pmed.1000139. [DOI] [PMC free article] [PubMed] [Google Scholar]
- 4.Thai KT, Binh TQ, Giao PT, et al. Seroprevalence of dengue antibodies, annual incidence and risk factors among children in southern Vietnam. Trop Med Int Health. 2005;10(4):379–386. doi: 10.1111/j.1365-3156.2005.01388.x. [DOI] [PubMed] [Google Scholar]
- 5.Setiati TE, Wagenaar JFP, de Kruif MD, et al. Changing epidemiology of dengue haemorrhagic fever in Indonesia. Bull World Health Organ. 2006;30:1–4. [Google Scholar]
- 6.Egger J. Reconstructing historical changes in the force of infection of dengue fever in Singapore: implications for surveillance and control. Bull World Health Organ. 2008;86(3):187–196. doi: 10.2471/BLT.07.040170. [DOI] [PMC free article] [PubMed] [Google Scholar]
- 7.Nagao Y, Koelle K. Decreases in dengue transmission may act to increase the incidence of dengue hemorrhagic fever. Proc Natl Acad Sci U S A. 2008;105(6):2238–2243. doi: 10.1073/pnas.0709029105. [DOI] [PMC free article] [PubMed] [Google Scholar]
- 8.Nagao Y, Tawatsin A, Thammapalo S, et al. Geographical gradient of mean age of dengue haemorrhagic fever patients in northern Thailand. Epidemiol Infect. 2011;140(3):479–490. doi: 10.1017/S0950268811000653. [DOI] [PMC free article] [PubMed] [Google Scholar]
- 9.Thammapalo S, Nagao Y, Sakamoto W, et al. Relationship between transmission intensity and incidence of dengue hemorrhagic fever in Thailand. PLoS Negl Trop Dis. 2008;2(7):e263. doi: 10.1371/journal.pntd.0000263. [DOI] [PMC free article] [PubMed] [Google Scholar]
- 10.Burke DS, Nisalak A, Johnson DE, et al. A prospective study of dengue infections in Bangkok. Am J Trop Med Hyg. 1988;38(1):172–180. doi: 10.4269/ajtmh.1988.38.172. [DOI] [PubMed] [Google Scholar]
- 11.Sangkawibha N, Rojanasuphot S, Ahandrik S, et al. Risk factors in dengue shock syndrome: a prospective epidemiologic study in Rayong, Thailand. I. The 1980 outbreak. Am J Epidemiol. 1984;120(5):653–669. doi: 10.1093/oxfordjournals.aje.a113932. [DOI] [PubMed] [Google Scholar]
- 12.Sangkawibha N. Bangkok, Thailand: Department of Medical Science, Ministry of Public Health; 1986. Completion Report of the WHO Collaborative Research Project: A Prospective Epidemiological Study of Dengue Haemorrhagic Fever in Thailand, 1980–1984. [Google Scholar]
- 13.Hanafusa S, Chanyasanha C, Sujirarat D, et al. Clinical features and differences between child and adult dengue infections in Rayong Province, southeast Thailand. Southeast Asian J Trop Med Public Health. 2008;39(2):252–259. [PubMed] [Google Scholar]
- 14.Bureau of Epidemiology, Ministry of Public Health of Thailand. Nonthaburi, Thailand: Bureau of Epidemiology, Ministry of Public Health of Thailand; 2010. Annual Epidemiological Surveillance Report. [Google Scholar]
- 15.Ferguson NM, Donnelly CA, Anderson RM. Transmission dynamics and epidemiology of dengue: insights from age-stratified sero-prevalence surveys. Philos Trans R Soc Lond B Biol Sci. 1999;354(1384):757–768. doi: 10.1098/rstb.1999.0428. [DOI] [PMC free article] [PubMed] [Google Scholar]
- 16.Plummer M. Lyon, France: 2012. JAGS version 3.3.0 user manual http://sourceforge.net/projects/mcmc-jags/ (Accessed October 1, 2012) [Google Scholar]
- 17.Grenfell BT, Anderson RM. The estimation of age-related rates of infection from case notifications and serological data. J Hyg (Lond) 1985;95(2):419–436. doi: 10.1017/s0022172400062859. [DOI] [PMC free article] [PubMed] [Google Scholar]
- 18.Hens N, Aerts M, Faes C, et al. Seventy-five years of estimating the force of infection from current status data. Epidemiol Infect. 2009;138(06):802–812. doi: 10.1017/S0950268809990781. [DOI] [PubMed] [Google Scholar]
- 19.Rodriguez-Barraquer I, Cordeiro MT, Braga C, et al. From re-emergence to hyperendemicity: the natural history of the dengue epidemic in Brazil. PLoS Negl Trop Dis. 2011;5(1):e935. doi: 10.1371/journal.pntd.0000935. [DOI] [PMC free article] [PubMed] [Google Scholar]
- 20.Heisey DM, Joly DO, Messier F. The fitting of general force-of-infection models to wildlife disease prevalence data. Ecology. 2006;87(9):2356–2365. doi: 10.1890/0012-9658(2006)87[2356:tfogfm]2.0.co;2. [DOI] [PubMed] [Google Scholar]
- 21.Anderson RM, May RM, Anderson B. New York, NY: Oxford University Press; 1992. Infectious Diseases of Humans: Dynamics and Control (Oxford Science Publications) [Google Scholar]
- 22.National Statistical Office, Thailand. Bangkok, Thailand: National Statistical Office; 1980. Population and Housing Census, 1980. [Google Scholar]
- 23.National Statistical Office, Thailand. Bangkok, Thailand: National Statistical Office; 2010. Population and Housing Census, 2010. [Google Scholar]
- 24.Egger JR, Coleman PG. Age and clinical dengue illness. Emerging Infect Dis. 2007;13(6):924–925. doi: 10.3201/eid1306.070008. [DOI] [PMC free article] [PubMed] [Google Scholar]
- 25.Guzman MG, Kouri G, Bravo J, et al. Effect of age on outcome of secondary dengue 2 infections. Int J Infect Dis. 2002;6(2):118–124. doi: 10.1016/s1201-9712(02)90072-x. [DOI] [PubMed] [Google Scholar]
- 26.Reves R. Declining fertility in England and Wales as a major cause of the twentieth century decline in mortality. Am J Epidemiol. 1985;122(1):112–126. doi: 10.1093/oxfordjournals.aje.a114070. [DOI] [PubMed] [Google Scholar]
- 27.May RM, Anderson RM. Endemic infections in growing populations. Math Biosci. 1985;77(1-2):141–156. [Google Scholar]
- 28.Inaba H, Nishiura H. The basic reproduction number of an infectious disease in a stable population: the impact of population growth rate on the eradication threshold. Math Model Nat Phenom. 2008;3(7):194–228. [Google Scholar]
- 29.National Statistical Office, Thailand. Bangkok, Thailand: National Statistical Office; 1980. Statistical Yearbook, Thailand, 1980. [Google Scholar]
- 30.National Statistical Office, Thailand. Bangkok, Thailand: National Statistical Office; 2000. Population and Housing Census, 2000. [Google Scholar]
- 31.Jatanasen S. Environmental manipulation and health education in Aedes aegypti control in Thailand. Bull World Health Organ. 1967;36(4):636–638. [PMC free article] [PubMed] [Google Scholar]
- 32.Swaddiwudhipong W, Chaovakiratipong C, Nguntra P, et al. Effect of health education on community participation in control of dengue hemorrhagic fever in an urban area of Thailand. Southeast Asian J Trop Med Public Health. 1992;23(2):200–206. [PubMed] [Google Scholar]
- 33.Siqueira JB, Martelli CMT, Maciel IJ, et al. Household survey of dengue infection in central Brazil: spatial point pattern analysis and risk factors assessment. Am J Trop Med Hyg. 2004;71(5):646–651. [PubMed] [Google Scholar]
- 34.Thai KT, Nagelkerke N, Phuong HL, et al. Geographical heterogeneity of dengue transmission in two villages in southern Vietnam. Epidemiol Infect. 2010;138(04):585–591. doi: 10.1017/S095026880999046X. [DOI] [PubMed] [Google Scholar]
- 35.Smith DL, McKenzie FE, Snow RW, et al. Revisiting the basic reproductive number for malaria and its implications for malaria control. PLoS Biol. 2007;5(3):e42. doi: 10.1371/journal.pbio.0050042. [DOI] [PMC free article] [PubMed] [Google Scholar]
Associated Data
This section collects any data citations, data availability statements, or supplementary materials included in this article.